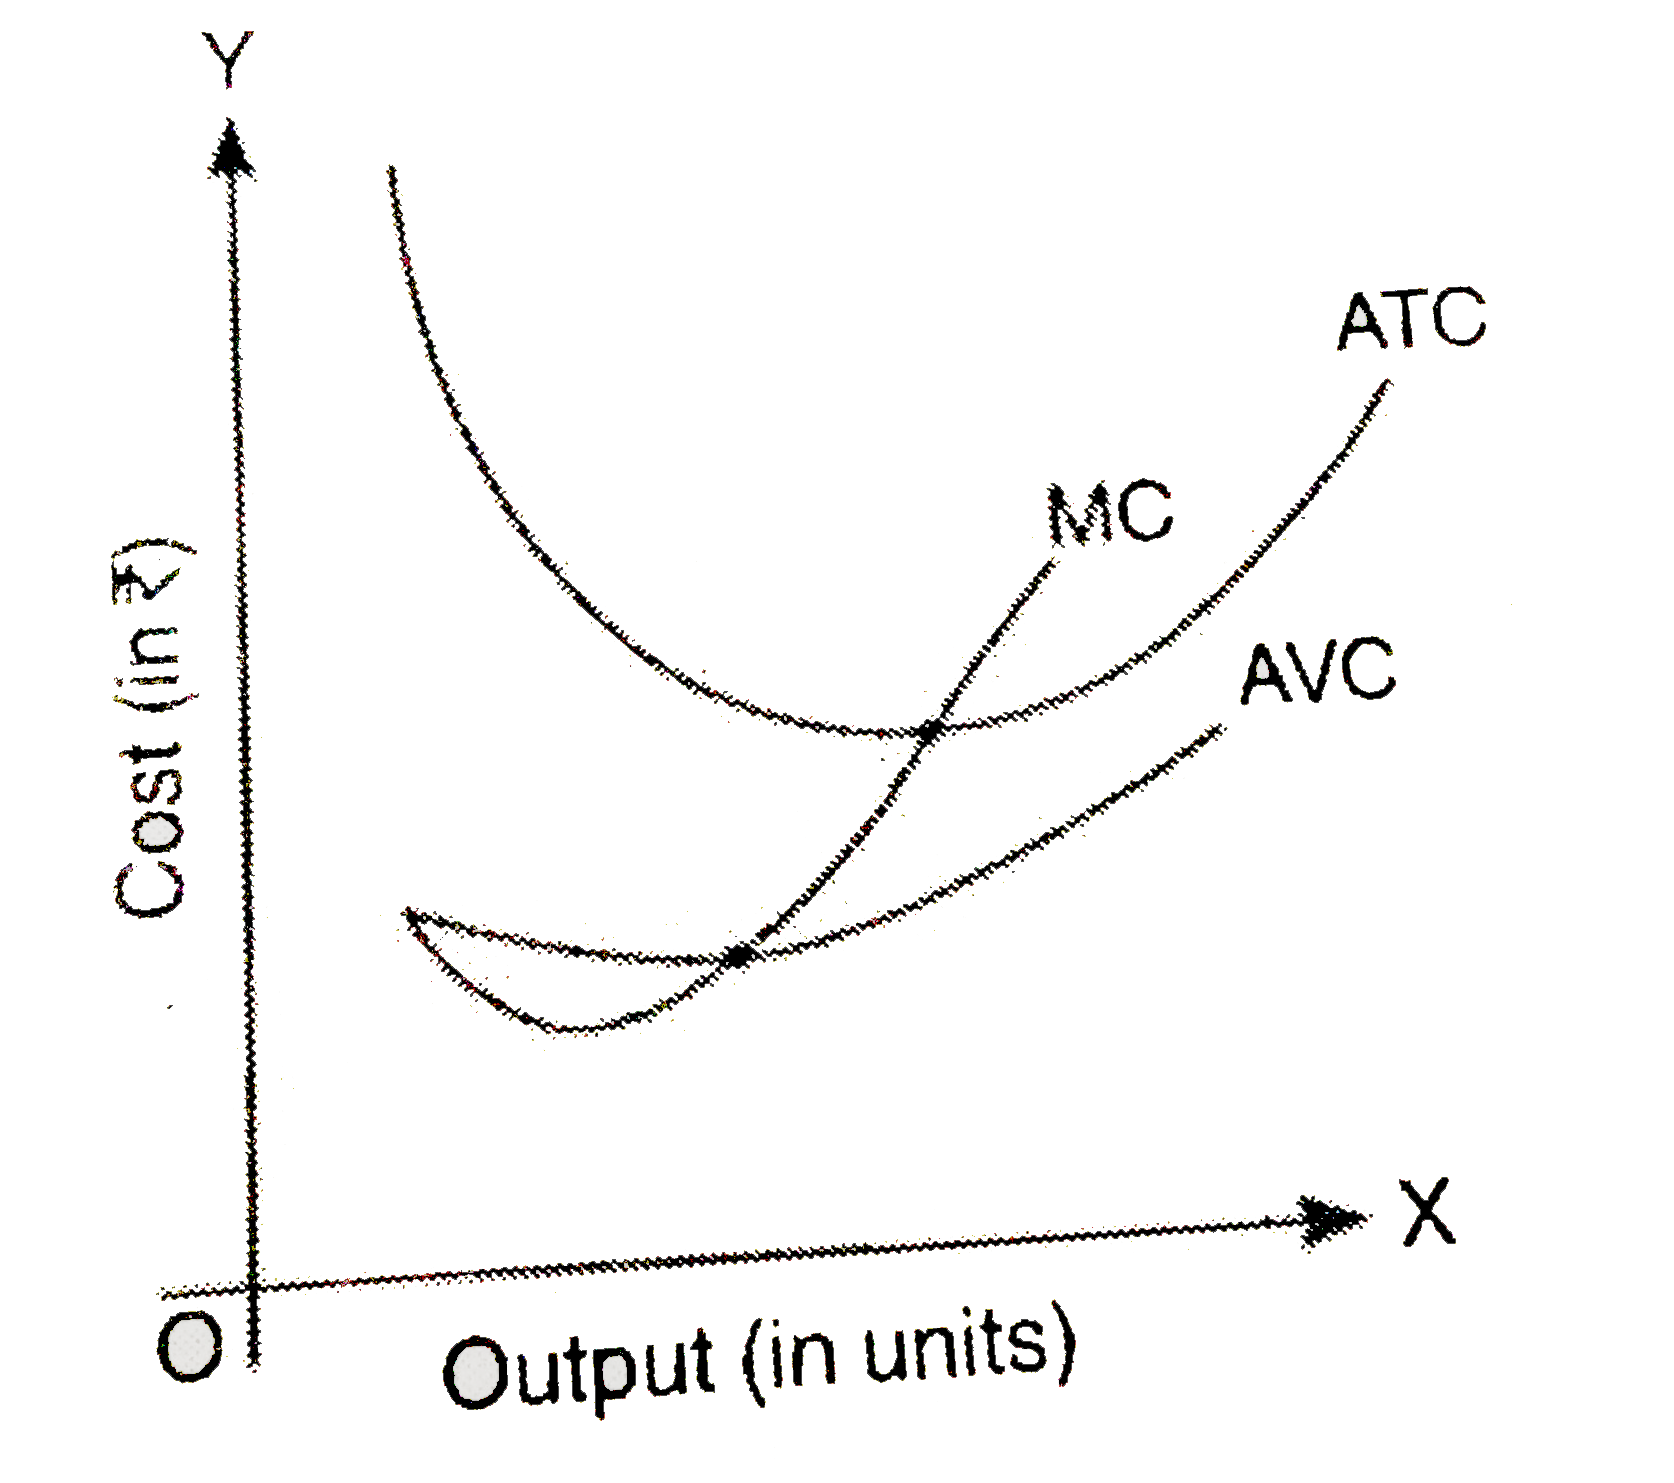
Draw Average Variable Cost (AVC), Average Total Cost (ATC) and Marginal Cost (MC) curves in a single diagram. State the relation between MC curve and AVC and ATC curves.
Video Solution
Text Solution
(i) MC curves intersects ATC and AVC curves at their minimum points.
(ii) Vertical distance between ATC curve and AVC curve goes on declining as output increases.
(ii) Vertical distance between ATC curve and AVC curve goes on declining as output increases.
Relationship among MC, AVC & AC:
When MC<ATC or AVC,ATC or AVC falls,
MC=ATC or AVC,ATC or AVC constant
MC>ATC or : AVC, ATC orAVC rises.

|
Topper's Solved these Questions
- DEMAND AND ITS DETERMINANTSBOOK - SANDEEP GARGCHAPTER - DEMAND AND ITS DETERMINANTSEXERCISE - Model test paper 2
12 Videos
- DEMAND AND ITS DETERMINANTSBOOK - SANDEEP GARGCHAPTER - DEMAND AND ITS DETERMINANTSEXERCISE - Model test paper 3
12 Videos
- DEMAND AND ITS DETERMINANTSBOOK - SANDEEP GARGCHAPTER - DEMAND AND ITS DETERMINANTSEXERCISE - Model test paper 3
12 Videos
- DEMANDBOOK - SANDEEP GARGCHAPTER - DEMANDEXERCISE - Unsolved particles
4 Videos
- ELASTICITY OF DEMANDBOOK - SANDEEP GARGCHAPTER - ELASTICITY OF DEMANDEXERCISE - Unsolved practicals
79 Videos
Similar Questions
Knowledge Check
Area under marginal cost curve is
ATVCBTFCCAFCDAVCMC Curve cuts the AVC and ATC Curves :
AFrom AboveBFrom belowCEither (a) and (b)DNeither (a) nor (b)
Draw ATC, AVC and MC curves in a single diagram. Also explain the relation between (a) ATC and AVC curves and (b) MC, ATC and AVC curves.
View SolutionDraw average total cost, average variable cost and marginal cost curves in a single diagram. Also, explain the relationship between ATC and AVC.
View SolutionDraw ATC,AVC and MC curves on a single diagram.
View SolutionWhat is the relation between AVC and ATC if TFC is zero.
View SolutionState the relation between total cost and marginal cost.
View SolutionState the relation between total cost and marginal cost.
View Solution
