A cube (side =10cm) of density 0.5g/cm3 is placed in a vessel of base area 20cm×20cm. A liquid of density 1.0gcm2 is gradually filled in the vessel at a constant rate Q=50cm3/s
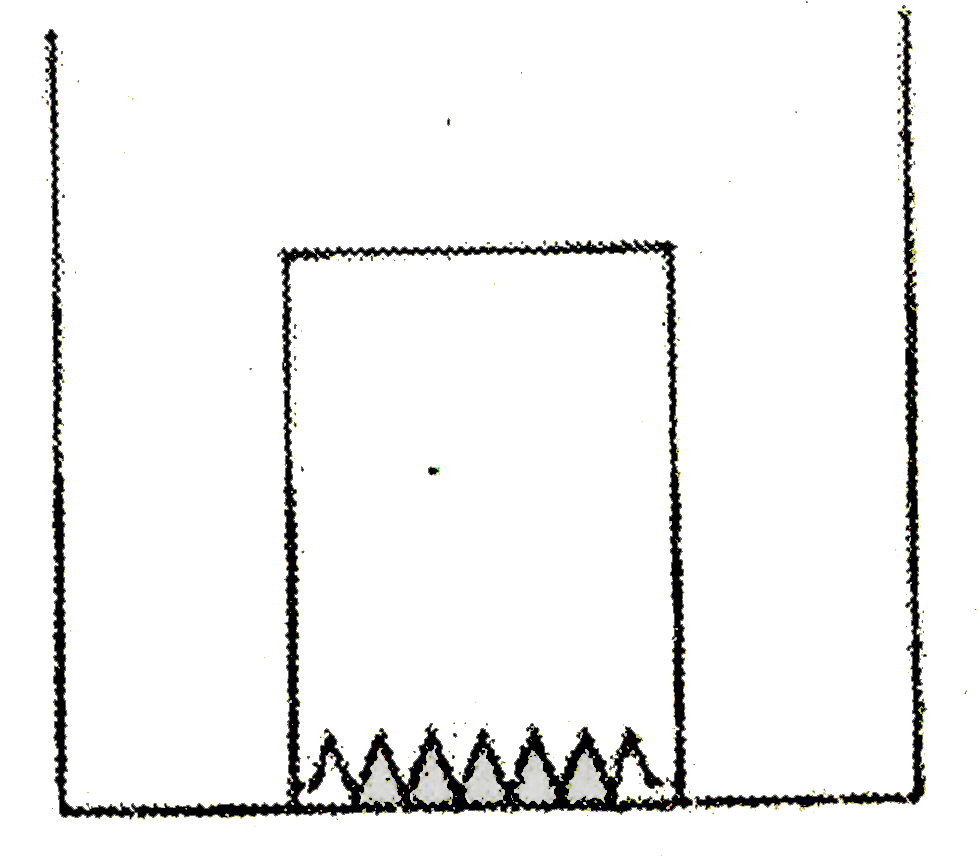
If we plot a graph between the normal reaction on cube by the vessel versus time. The graph will be like
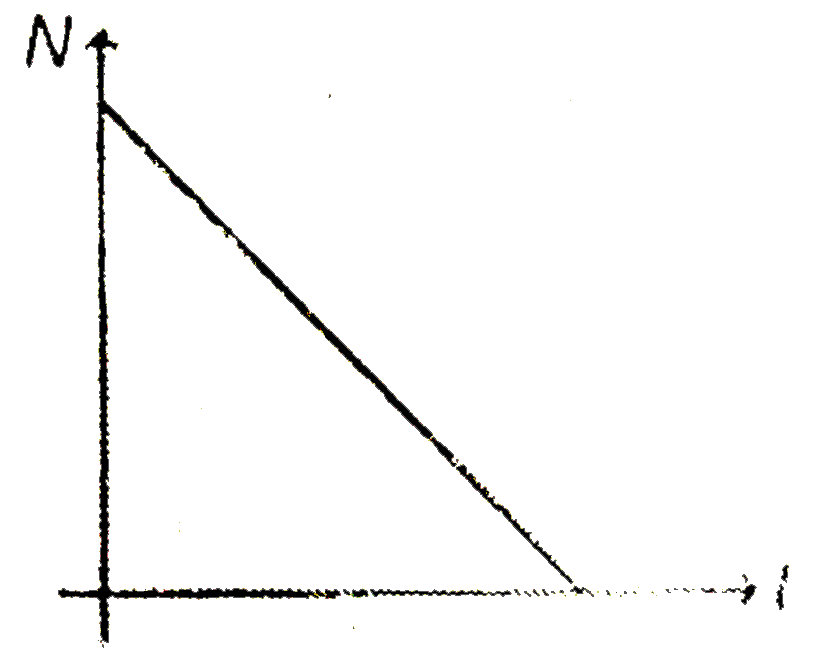
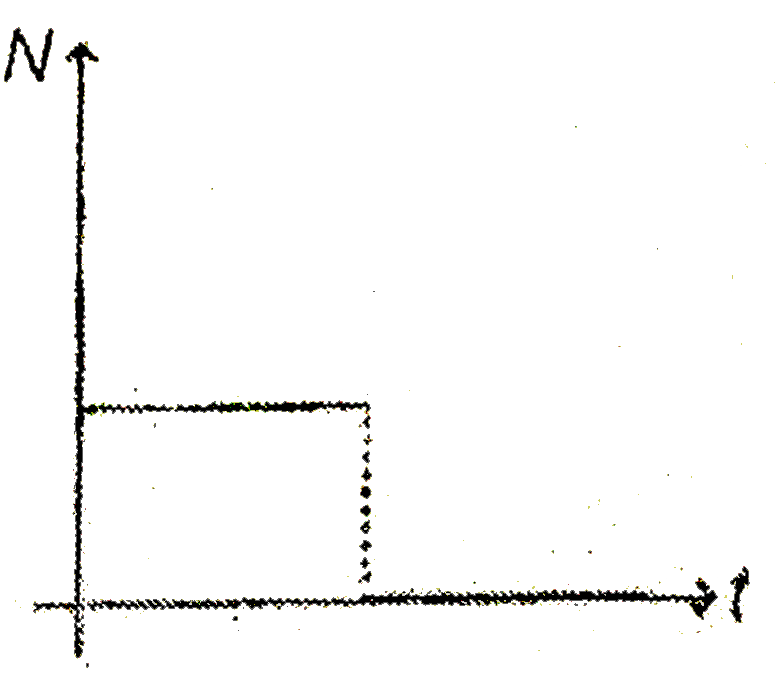
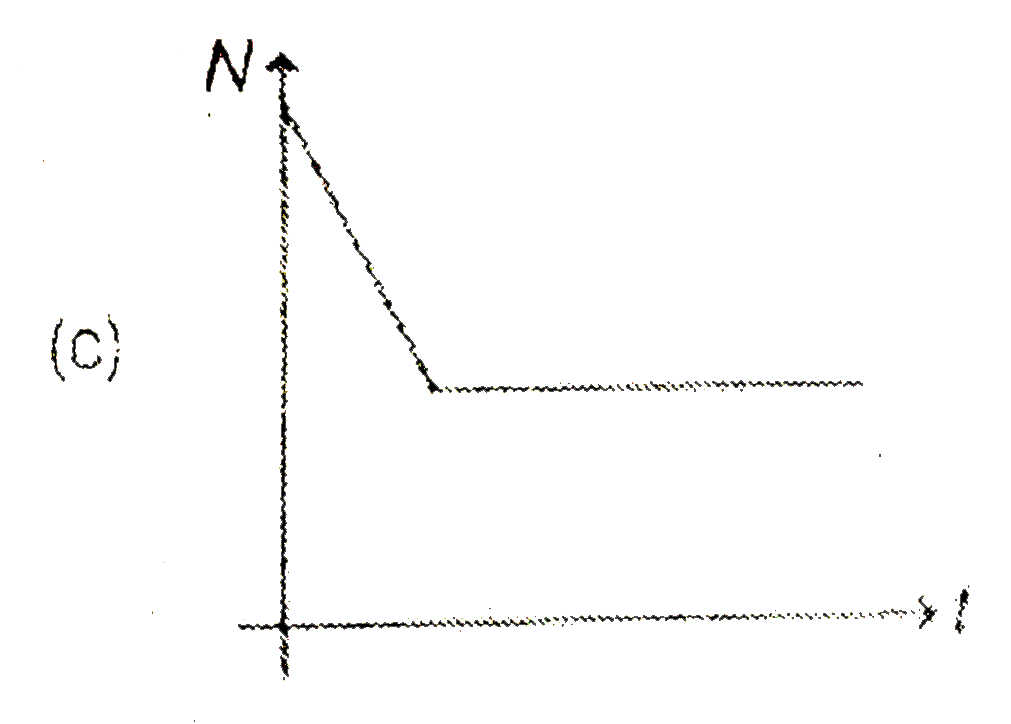
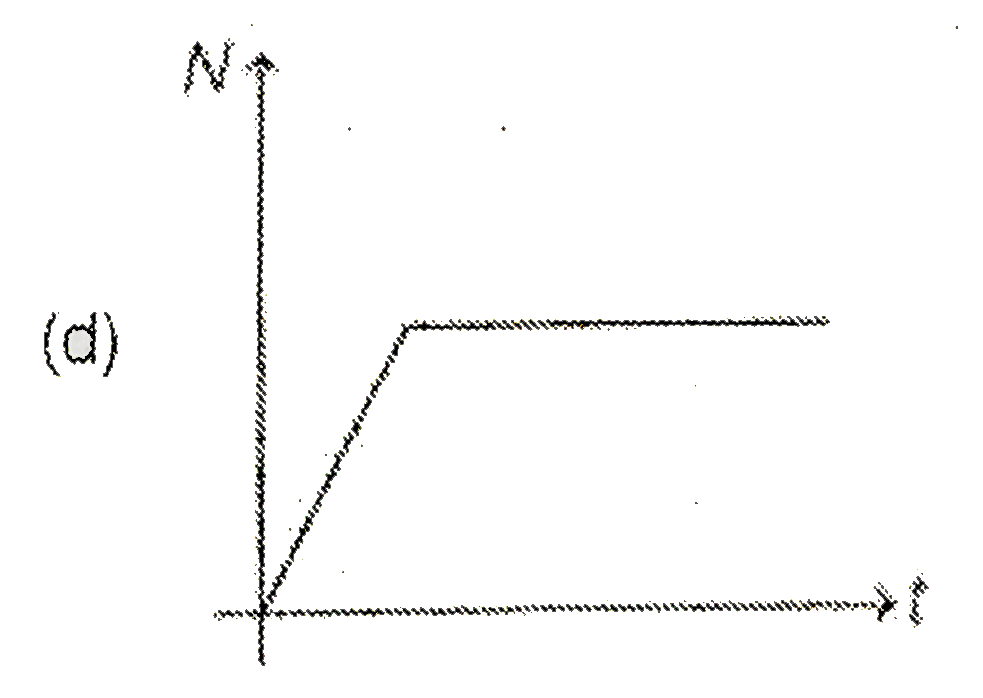
The correct Answer is:A
Step by step video & image solution for A cube (side =10 cm) of density 0.5 g//cm^(3) is placed in a vessel of base area 20 cmxx20 cm. A liquid of density 1.0 g/ cm^(2) is gradually filled in the vessel at a constant rate Q=50 cm^(3)//s If we plot a graph between the normal reaction on cube by the vessel versus time. The graph will be like by Physics experts to help you in doubts & scoring excellent marks in Class 11 exams.
Updated on:21/07/2023Topper's Solved these Questions
- PROPERTIES OF MATTERBook:DC PANDEY ENGLISHChapter:PROPERTIES OF MATTERExercise:Matrix Matching
Explore 12 Videos
- PROPERTIES OF MATTERBook:DC PANDEY ENGLISHChapter:PROPERTIES OF MATTERExercise:Integer
Explore 8 Videos
- PROPERTIES OF MATTERBook:DC PANDEY ENGLISHChapter:PROPERTIES OF MATTERExercise:More than one option is correct
Explore 21 Videos
- PROJECTILE MOTIONBook:DC PANDEY ENGLISHChapter:PROJECTILE MOTIONExercise:Level - 2 Subjective
Explore 10 Videos
- RAY OPTICSBook:DC PANDEY ENGLISHChapter:RAY OPTICSExercise:Integer type q.
Explore 14 Videos
Similar Questions
A cube (side =10cm) of density 0.5g/cm3 is placed in a vessel of base area 20cm×20cm. A liquid of density 1.0g/cm3 is gradually filled in the vessel at a constant rate Q=50cm3/s
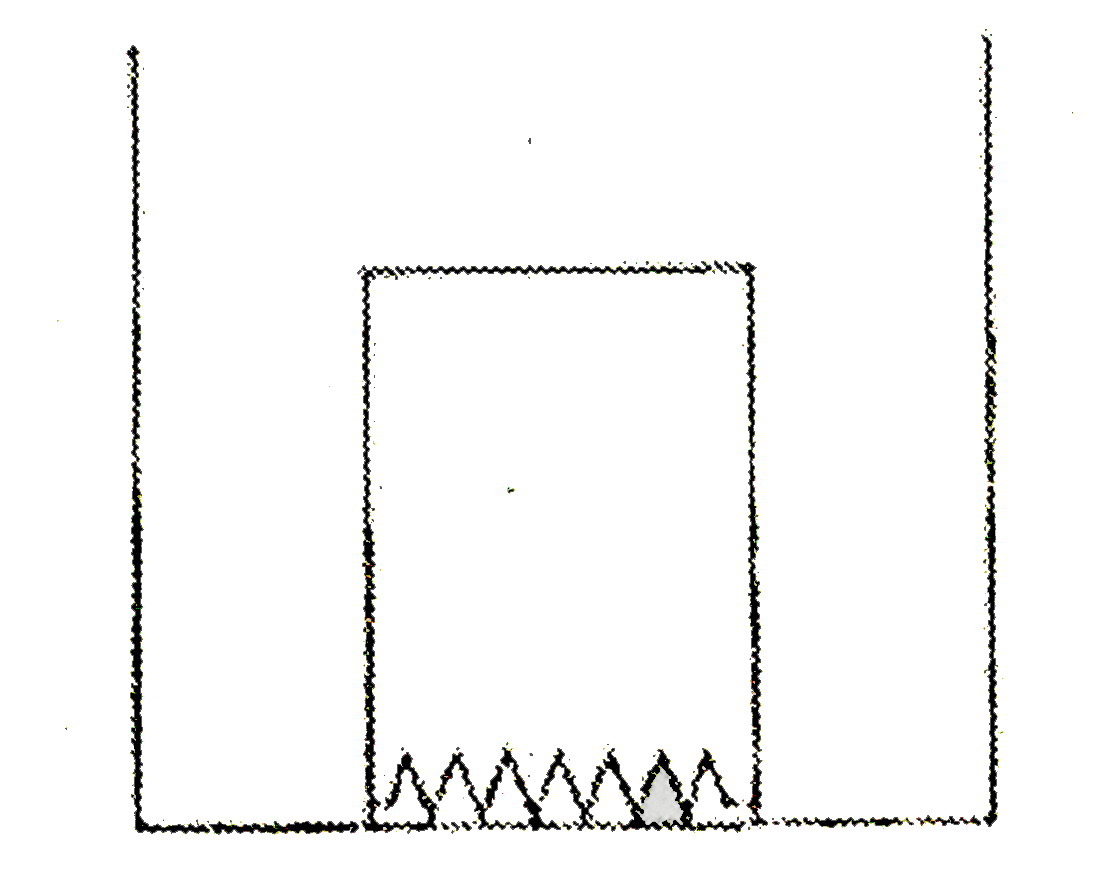
The cube will leave contact with the vessel after time t= ......... s.
View SolutionTwo solids A and B of density 2.5 g cm−3 and 0.80g cm−3 are placed in a liquid L of density 1.2 g cm−3 Which solid is likely to float and why?
View SolutionThe molarity of 20% by mass H2SO4 solution of density 1.02gcm−3 is :
View SolutionA metal cube of edge 5 cm and density 9.0cm−3 is suspended by a thread so as to be completely immersed in a liquid of density 1.2gcm−3. Find the tension in thread. (Take g=10ms−2)
View SolutionA body of density 2.5g/cm3 is let free in a liquid of density 1.25g/cm3 . The downward acceleration of the of the body while sinking in the liquid is . _______
View SolutionA vessel of base area 100 cm x 60 cm and height 200 cm is completely filled with a liquid of density 1.1×10³kgm−3 Ignoring the atmosphere pressure find the thrust at the bottom of the vessel
View SolutionA vessel of base area 100 cm x 60 cm and height 200 cm is completely filled with a liquid of density 1.1×10³kgm−3 Ignoring the atmosphere pressure find the pressure at the depth of 5 cm from the free surface
View SolutionA ball has acceleration of 98cms2 in a liquid of density 1g(cm)3. The radius of ball is 1cm. Find mass of ball (g=980cms2)
View SolutionIf the density of wood is 0.6 g/cm3 , what is the mass of 2cm3 ?
View SolutionIf the density of wood is 0.6 g/cm3 , what is the mass of 10cm3 ?
View Solution