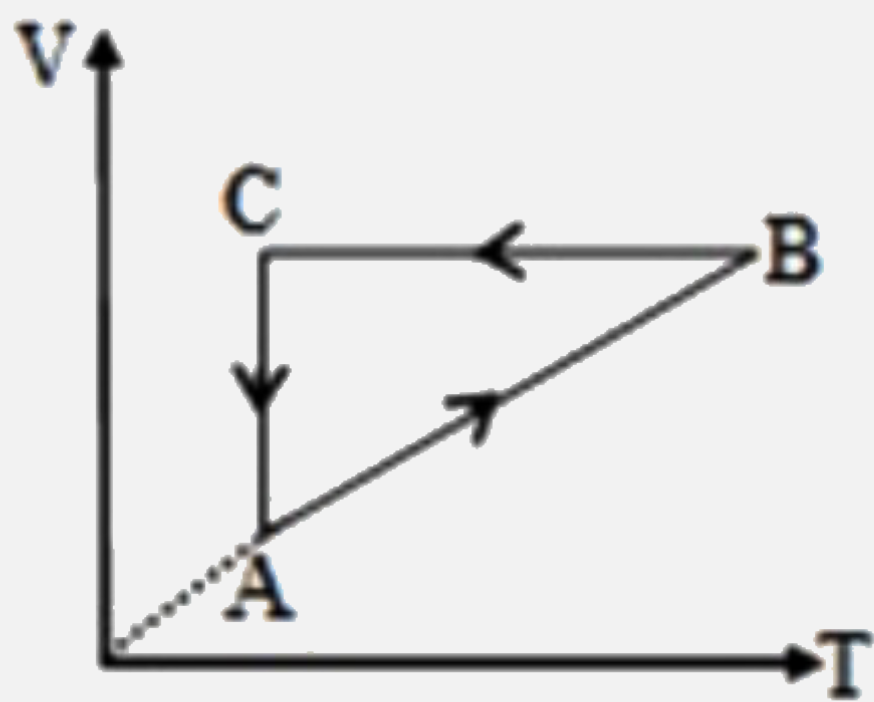
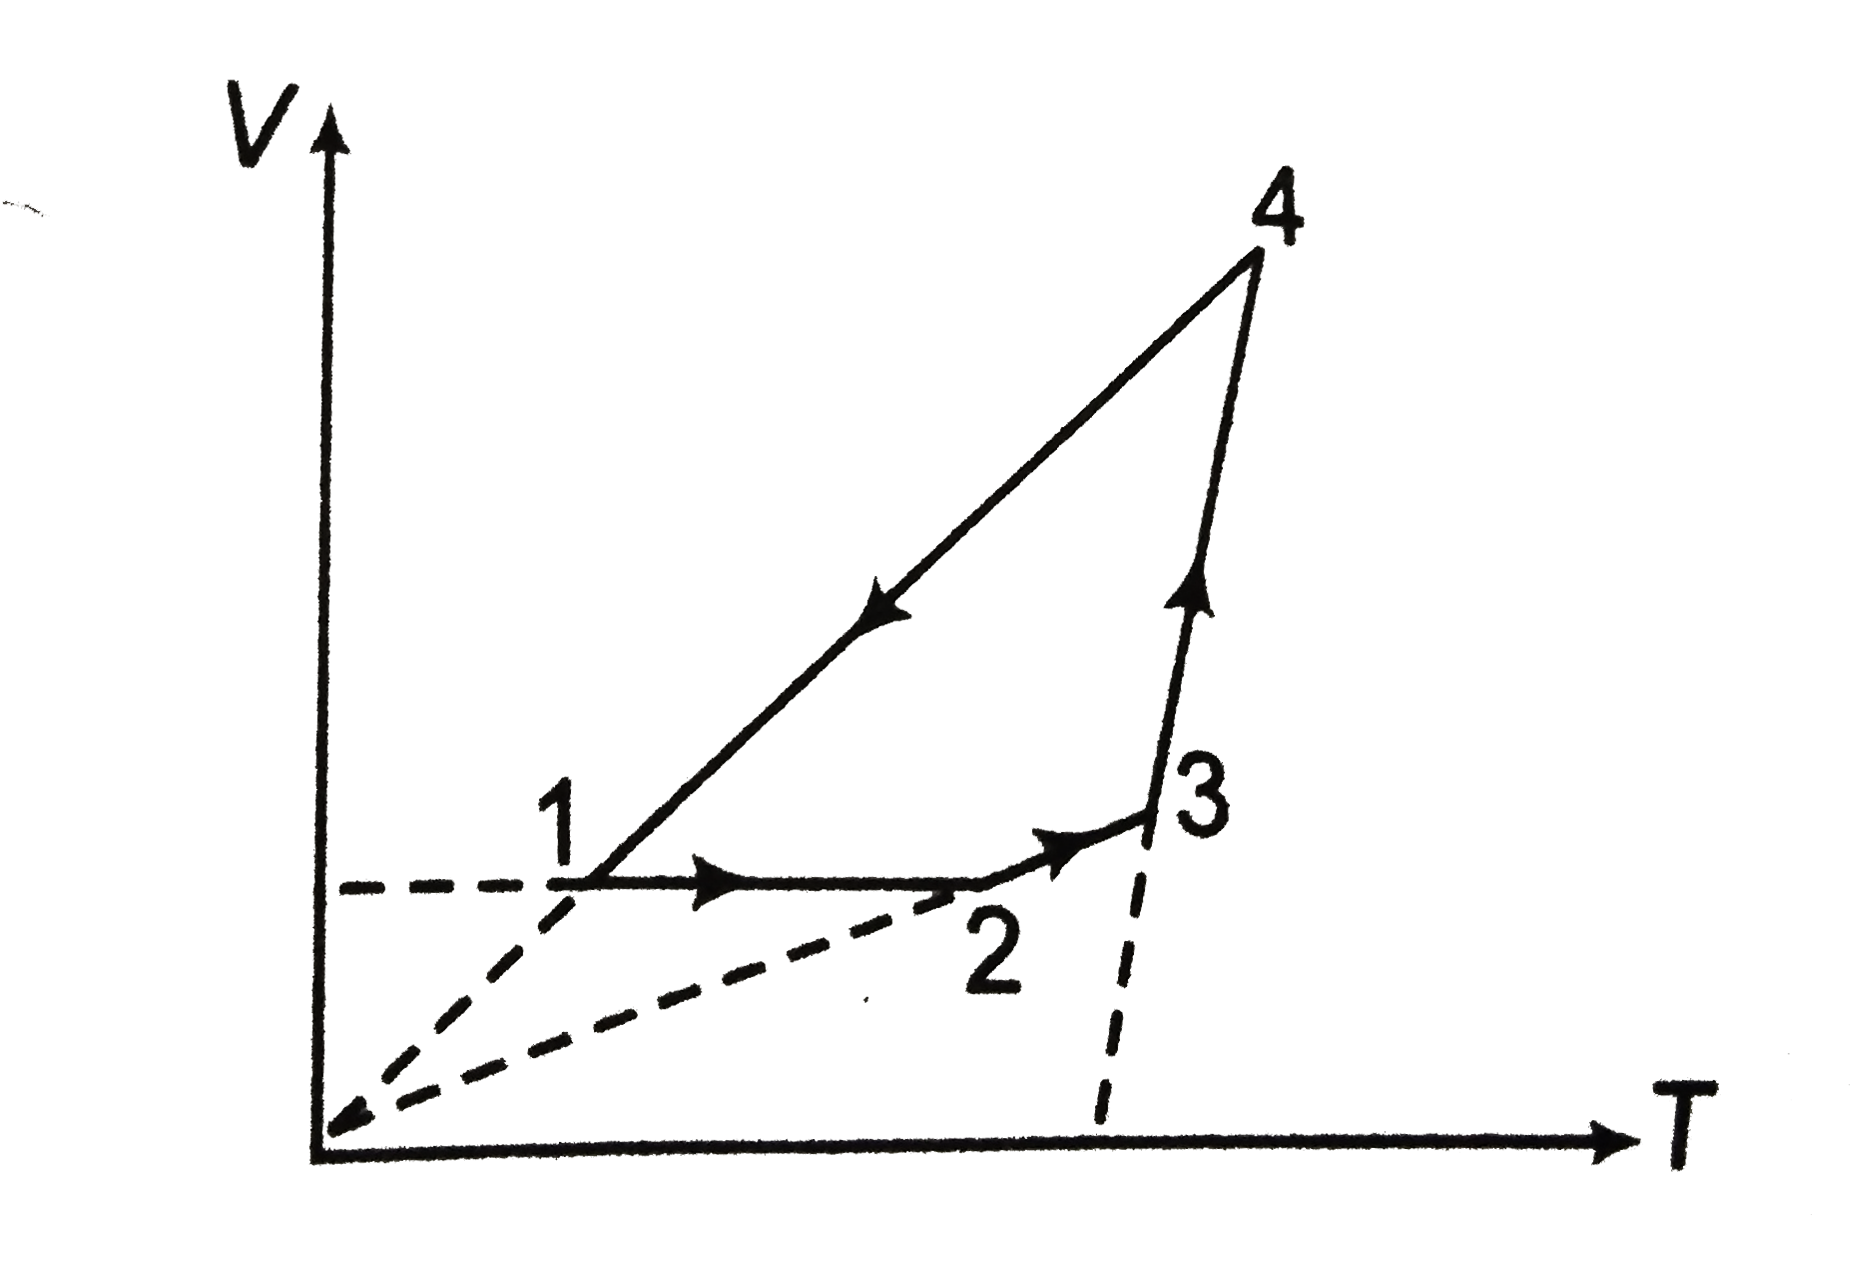
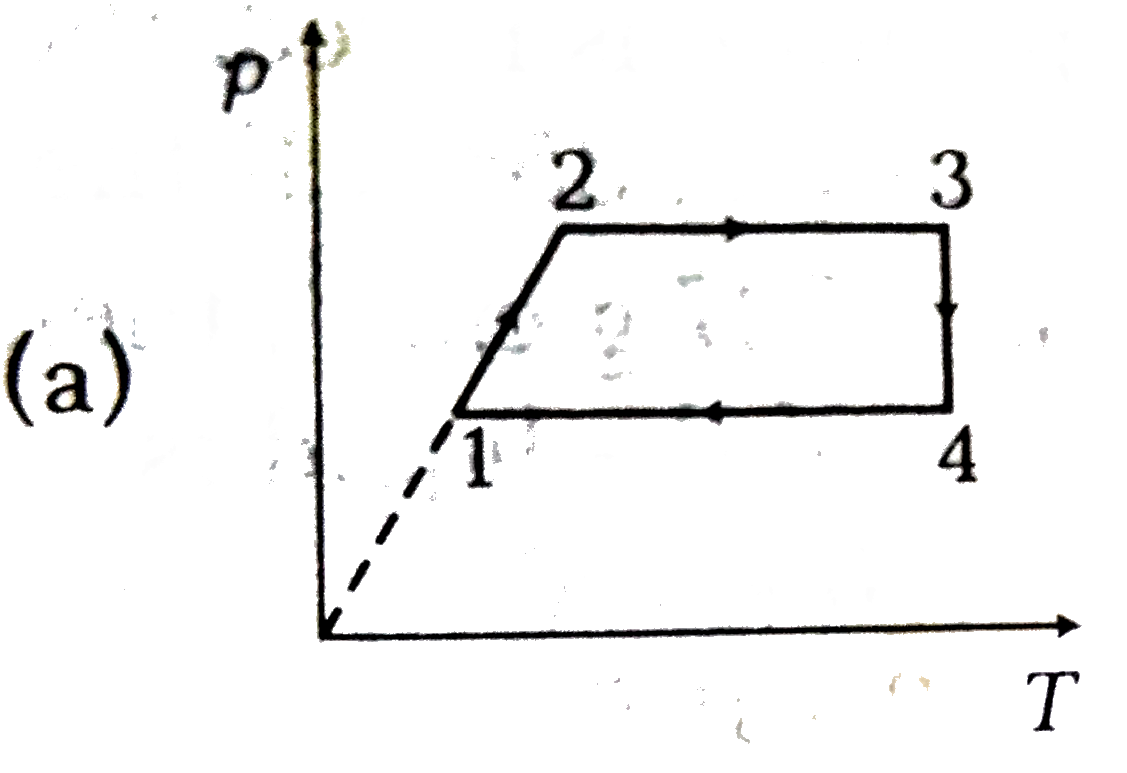
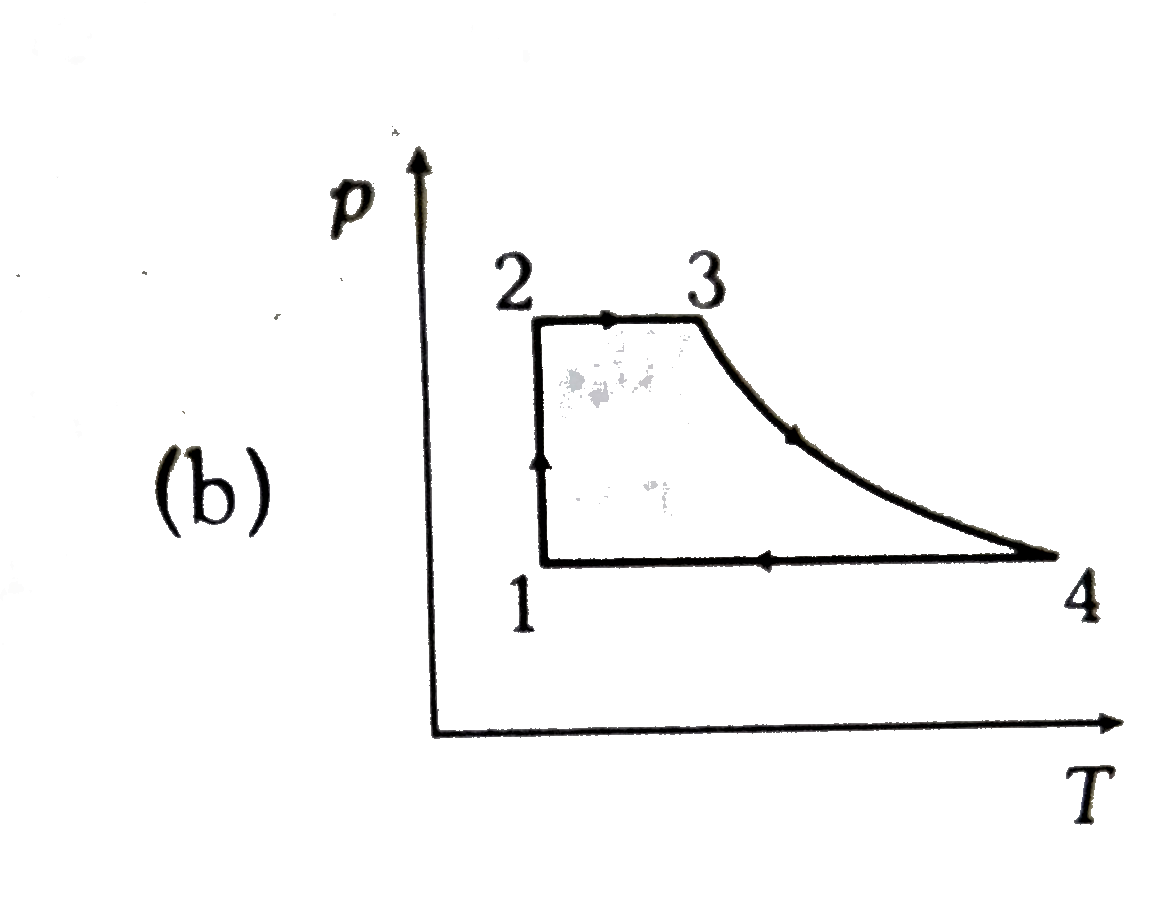
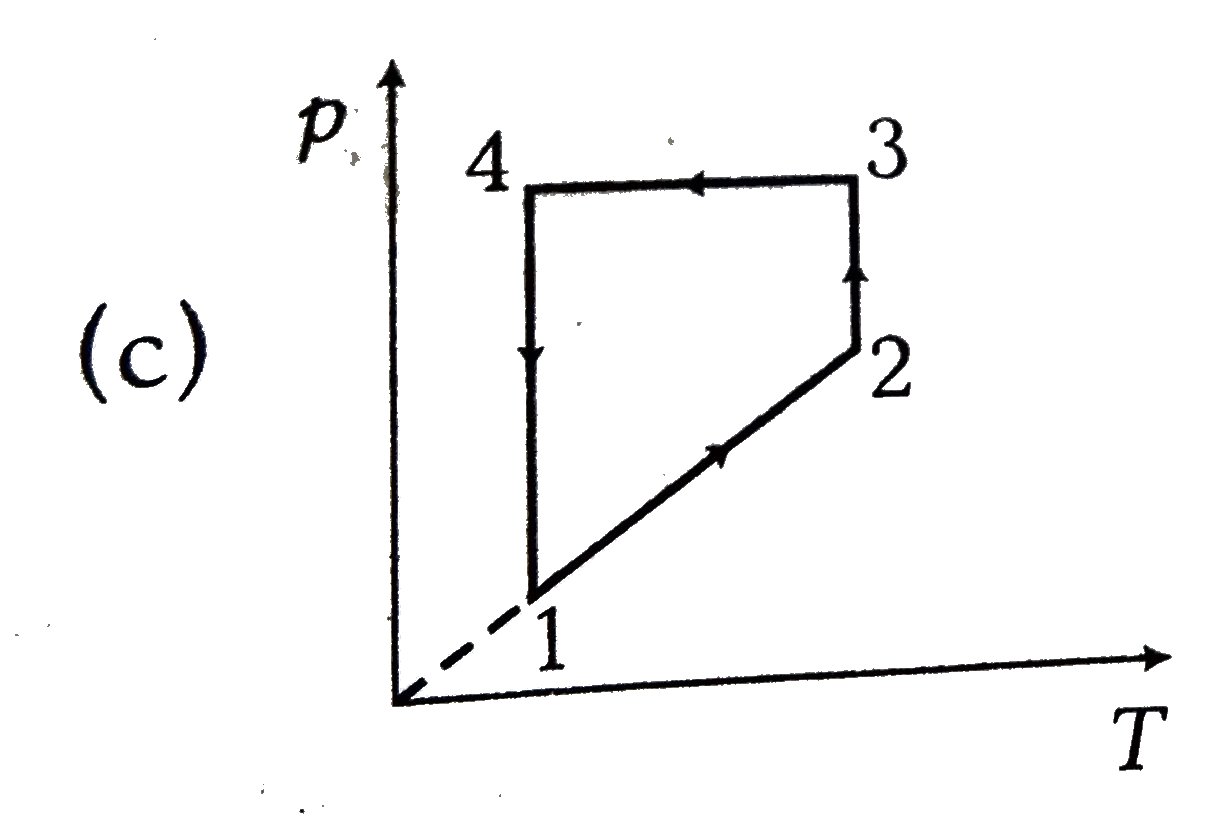
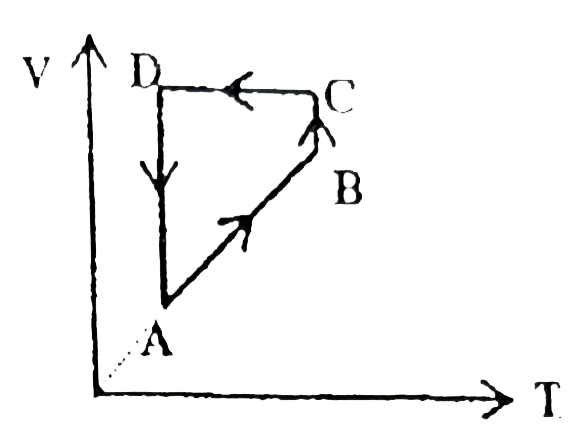
A cyclic process 1-2-3-4-1 is depicted on V-T diagram. The p-T and p-V diagrams for this cyclic process are given below. Select the correct choices (more than one options is/are correct)
None of these
The correct Answer is:C
Process 1-2 V = constant p ∝ T
T is increasing. Therefore pressure will be increase.
process 2-3 p = constant, V ∝ T
V and T both are increasing.
Process 3-4 T = constant p∝1V
V is increasing. Therefore p will decrease.
Process 4-1 Inverses of process 2-3
Topper's Solved these Questions
- BOOK - DC PANDEY ENGLISHCHAPTER - THERMOMETRY THERMAL EXPANSION AND KINETIC THEORY OF GASESEXERCISE - B medical entrance special format questions14videos
THERMOMETRY THERMAL EXPANSION AND KINETIC THEORY OF GASES
- BOOK - DC PANDEY ENGLISHCHAPTER - THERMOMETRY THERMAL EXPANSION AND KINETIC THEORY OF GASESEXERCISE - Match the columns5videos
THERMOMETRY THERMAL EXPANSION AND KINETIC THEORY OF GASES
- BOOK - DC PANDEY ENGLISHCHAPTER - THERMOMETRY THERMAL EXPANSION AND KINETIC THEORY OF GASESEXERCISE - Check point 14.425videos
THERMOMETRY THERMAL EXPANSION AND KINETIC THEORY OF GASES
- BOOK - DC PANDEY ENGLISHCHAPTER - SUPERPOSITION OF WAVESEXERCISE - Level 2 Subjective8videos
SUPERPOSITION OF WAVES
- BOOK - DC PANDEY ENGLISHCHAPTER - THERMOMETRY,THERMAL EXPANSION & KINETIC THEORY OF GASESEXERCISE - Level 2 Subjective9videos
THERMOMETRY,THERMAL EXPANSION & KINETIC THEORY OF GASES
Similar Questions
Knowledge Check
- Question 1 - Select One
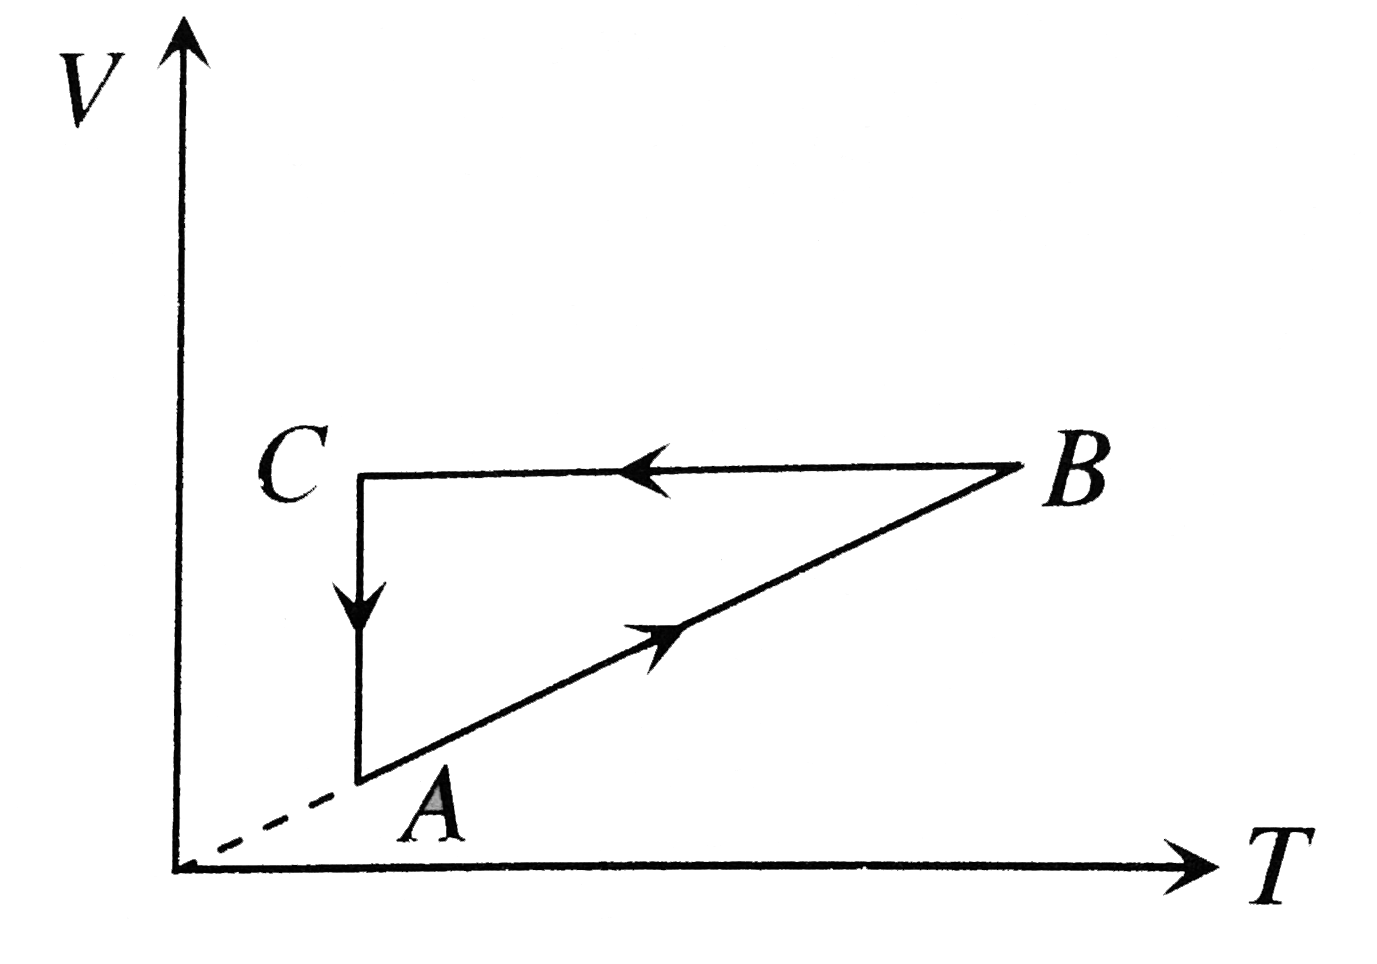
A cyclic process ABCA is shown in the V−T diagram process on the P−V
 A
A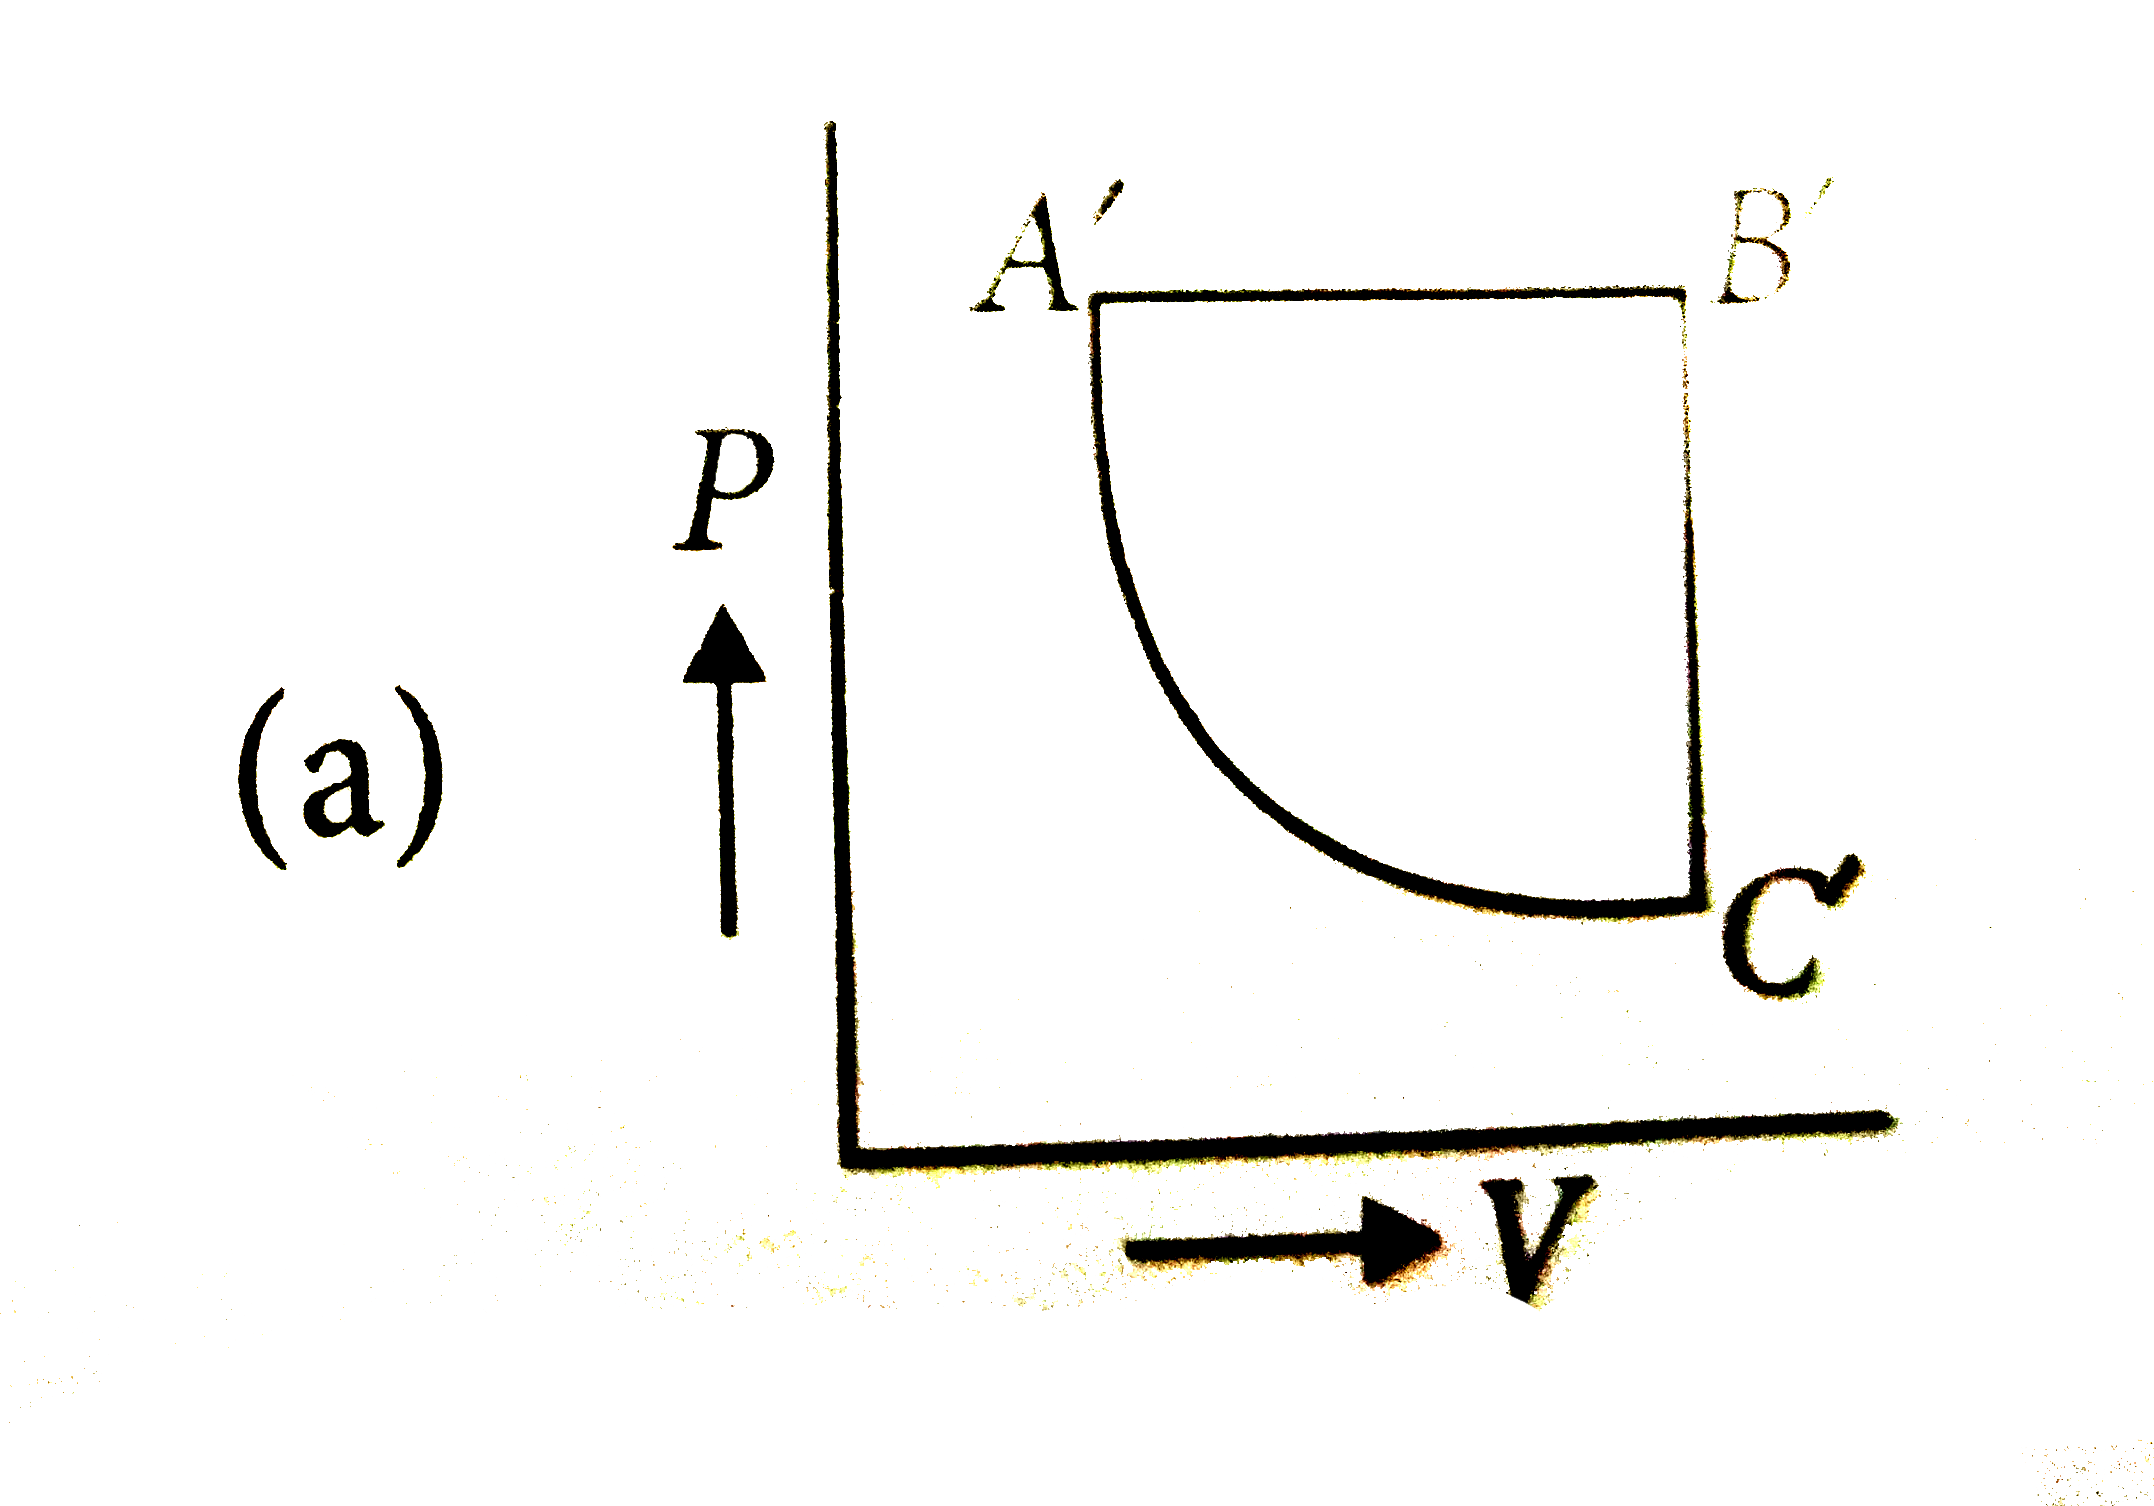 B
B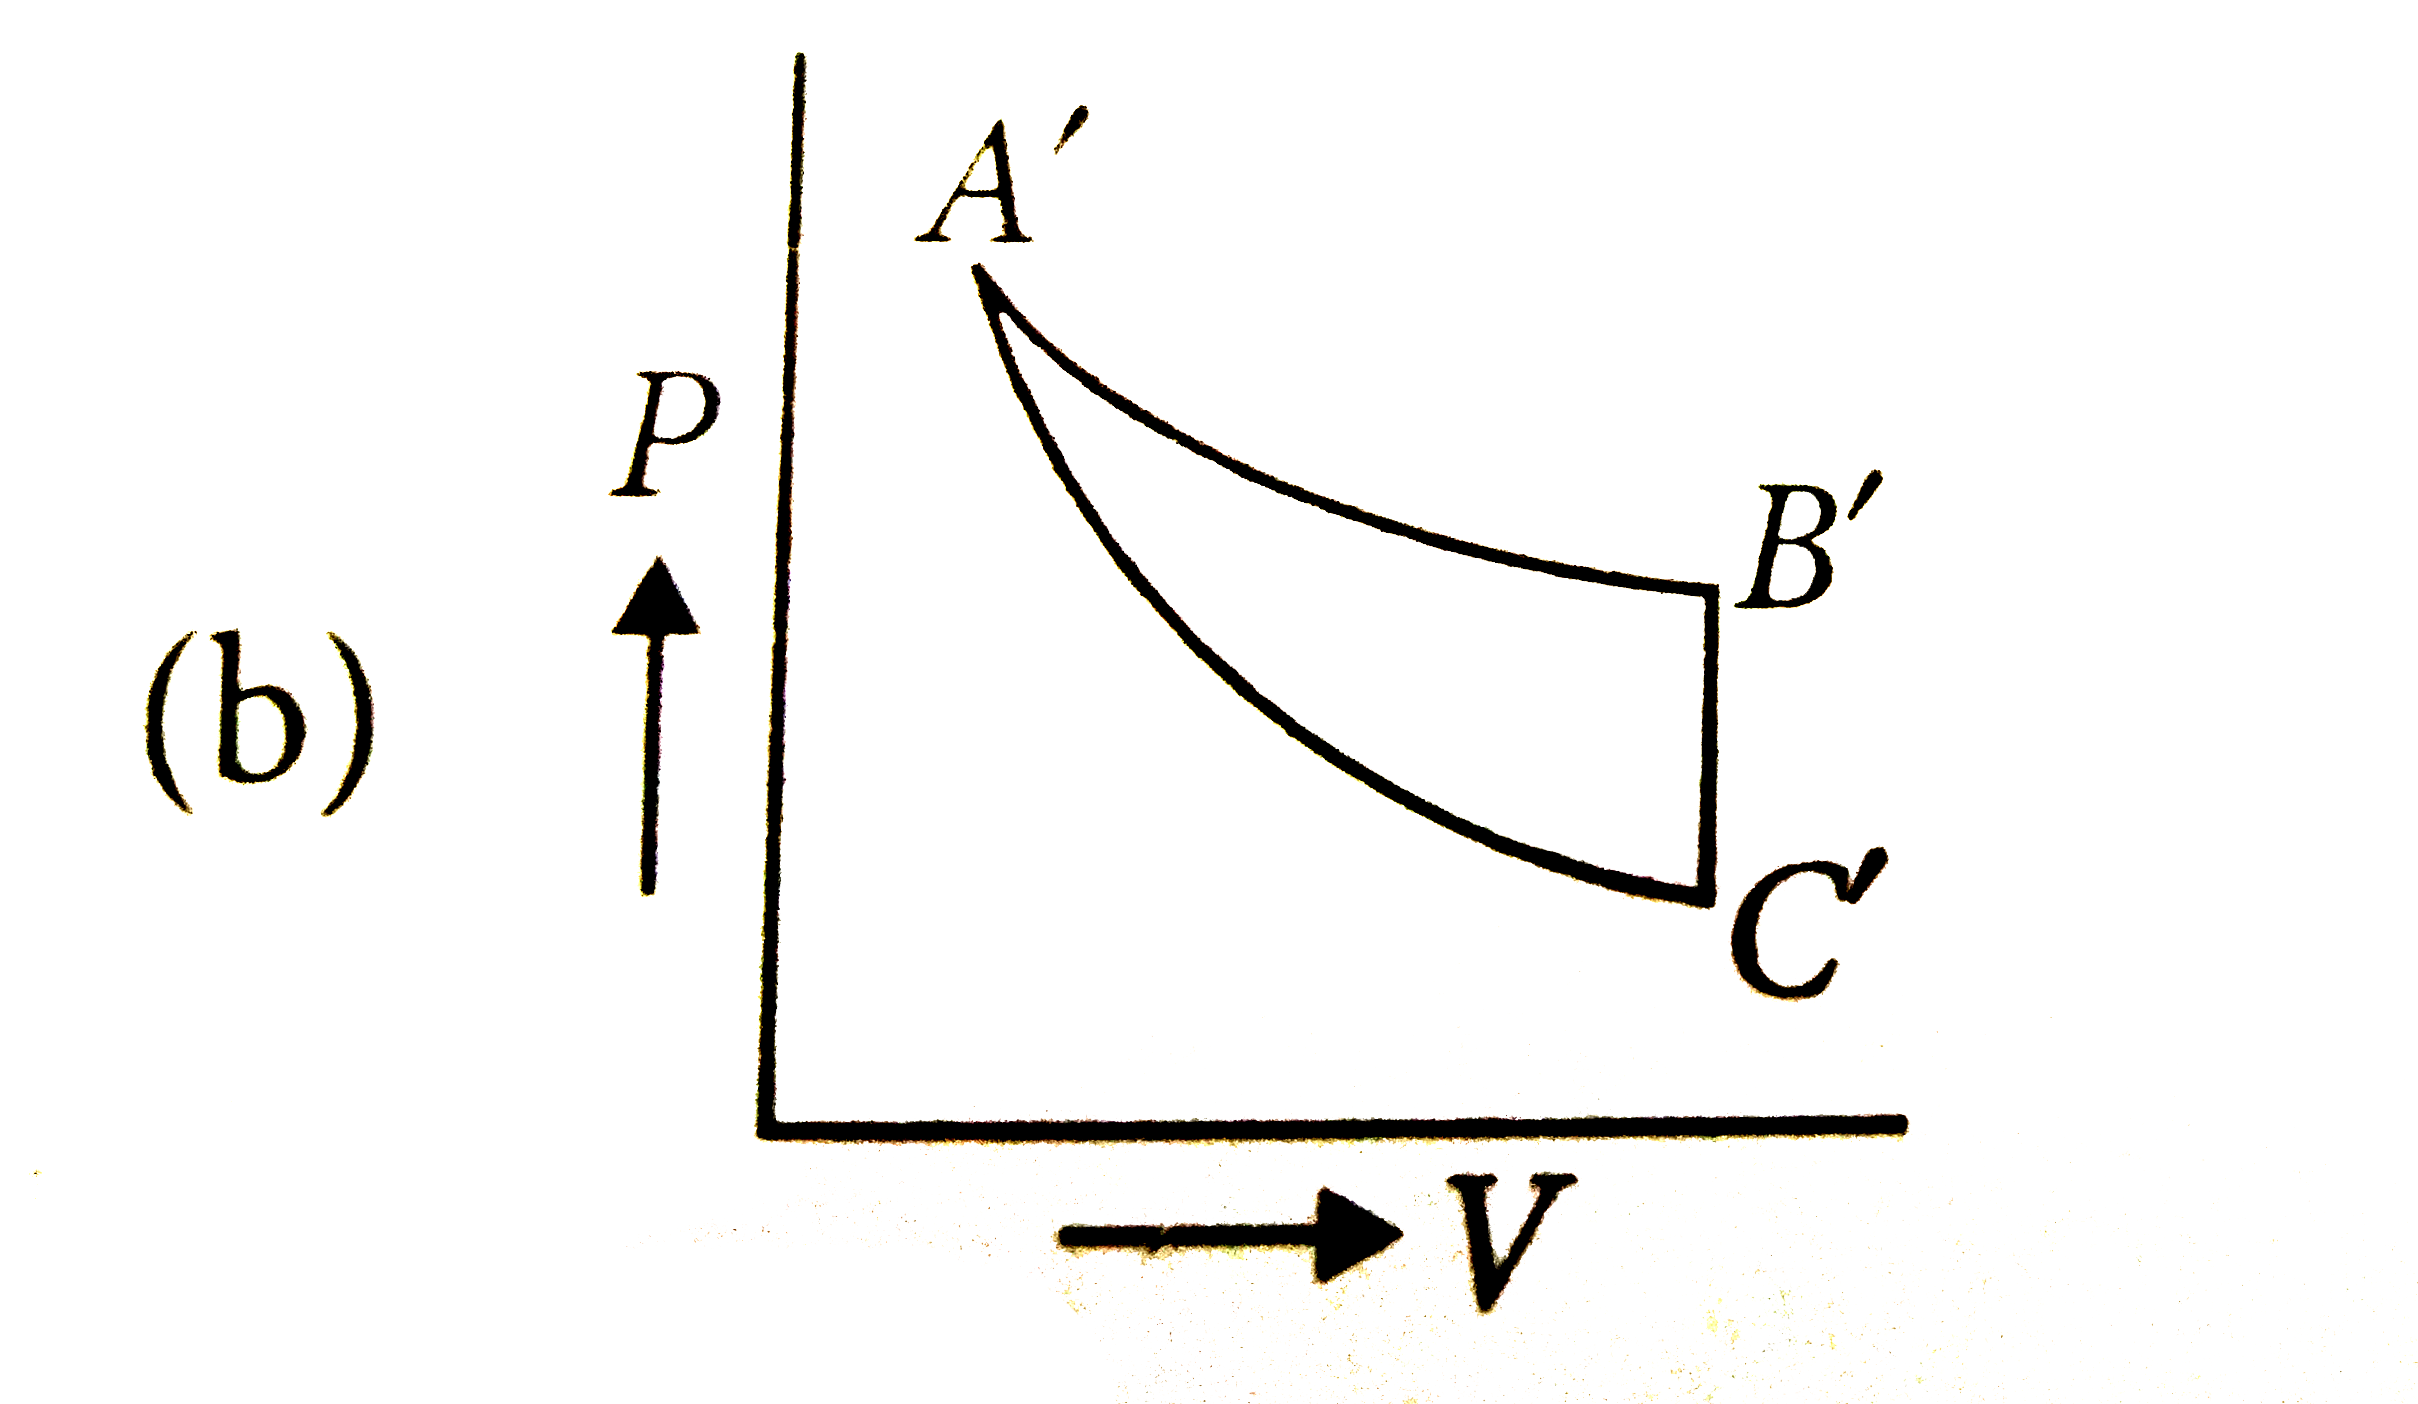 C
C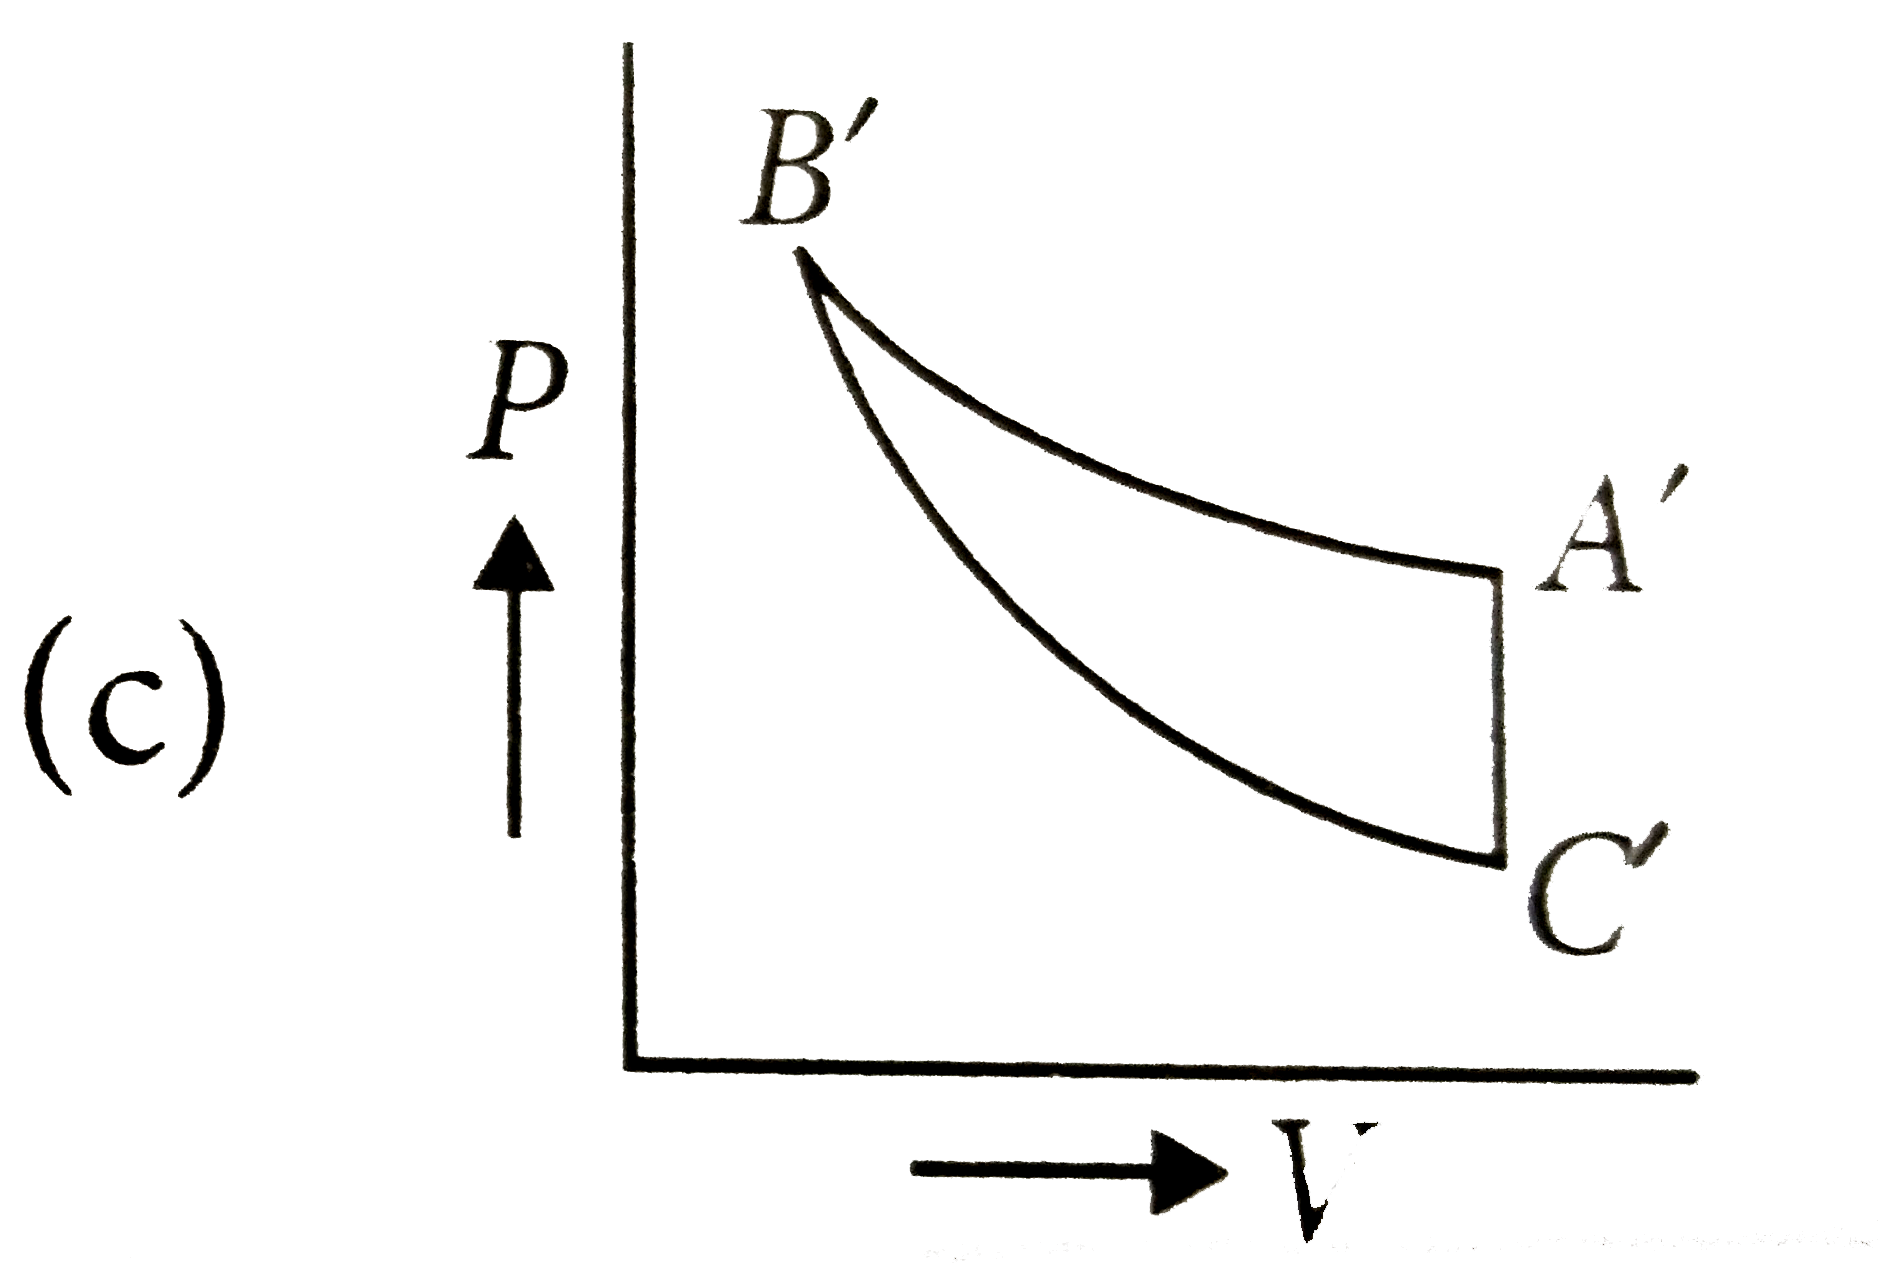 D
D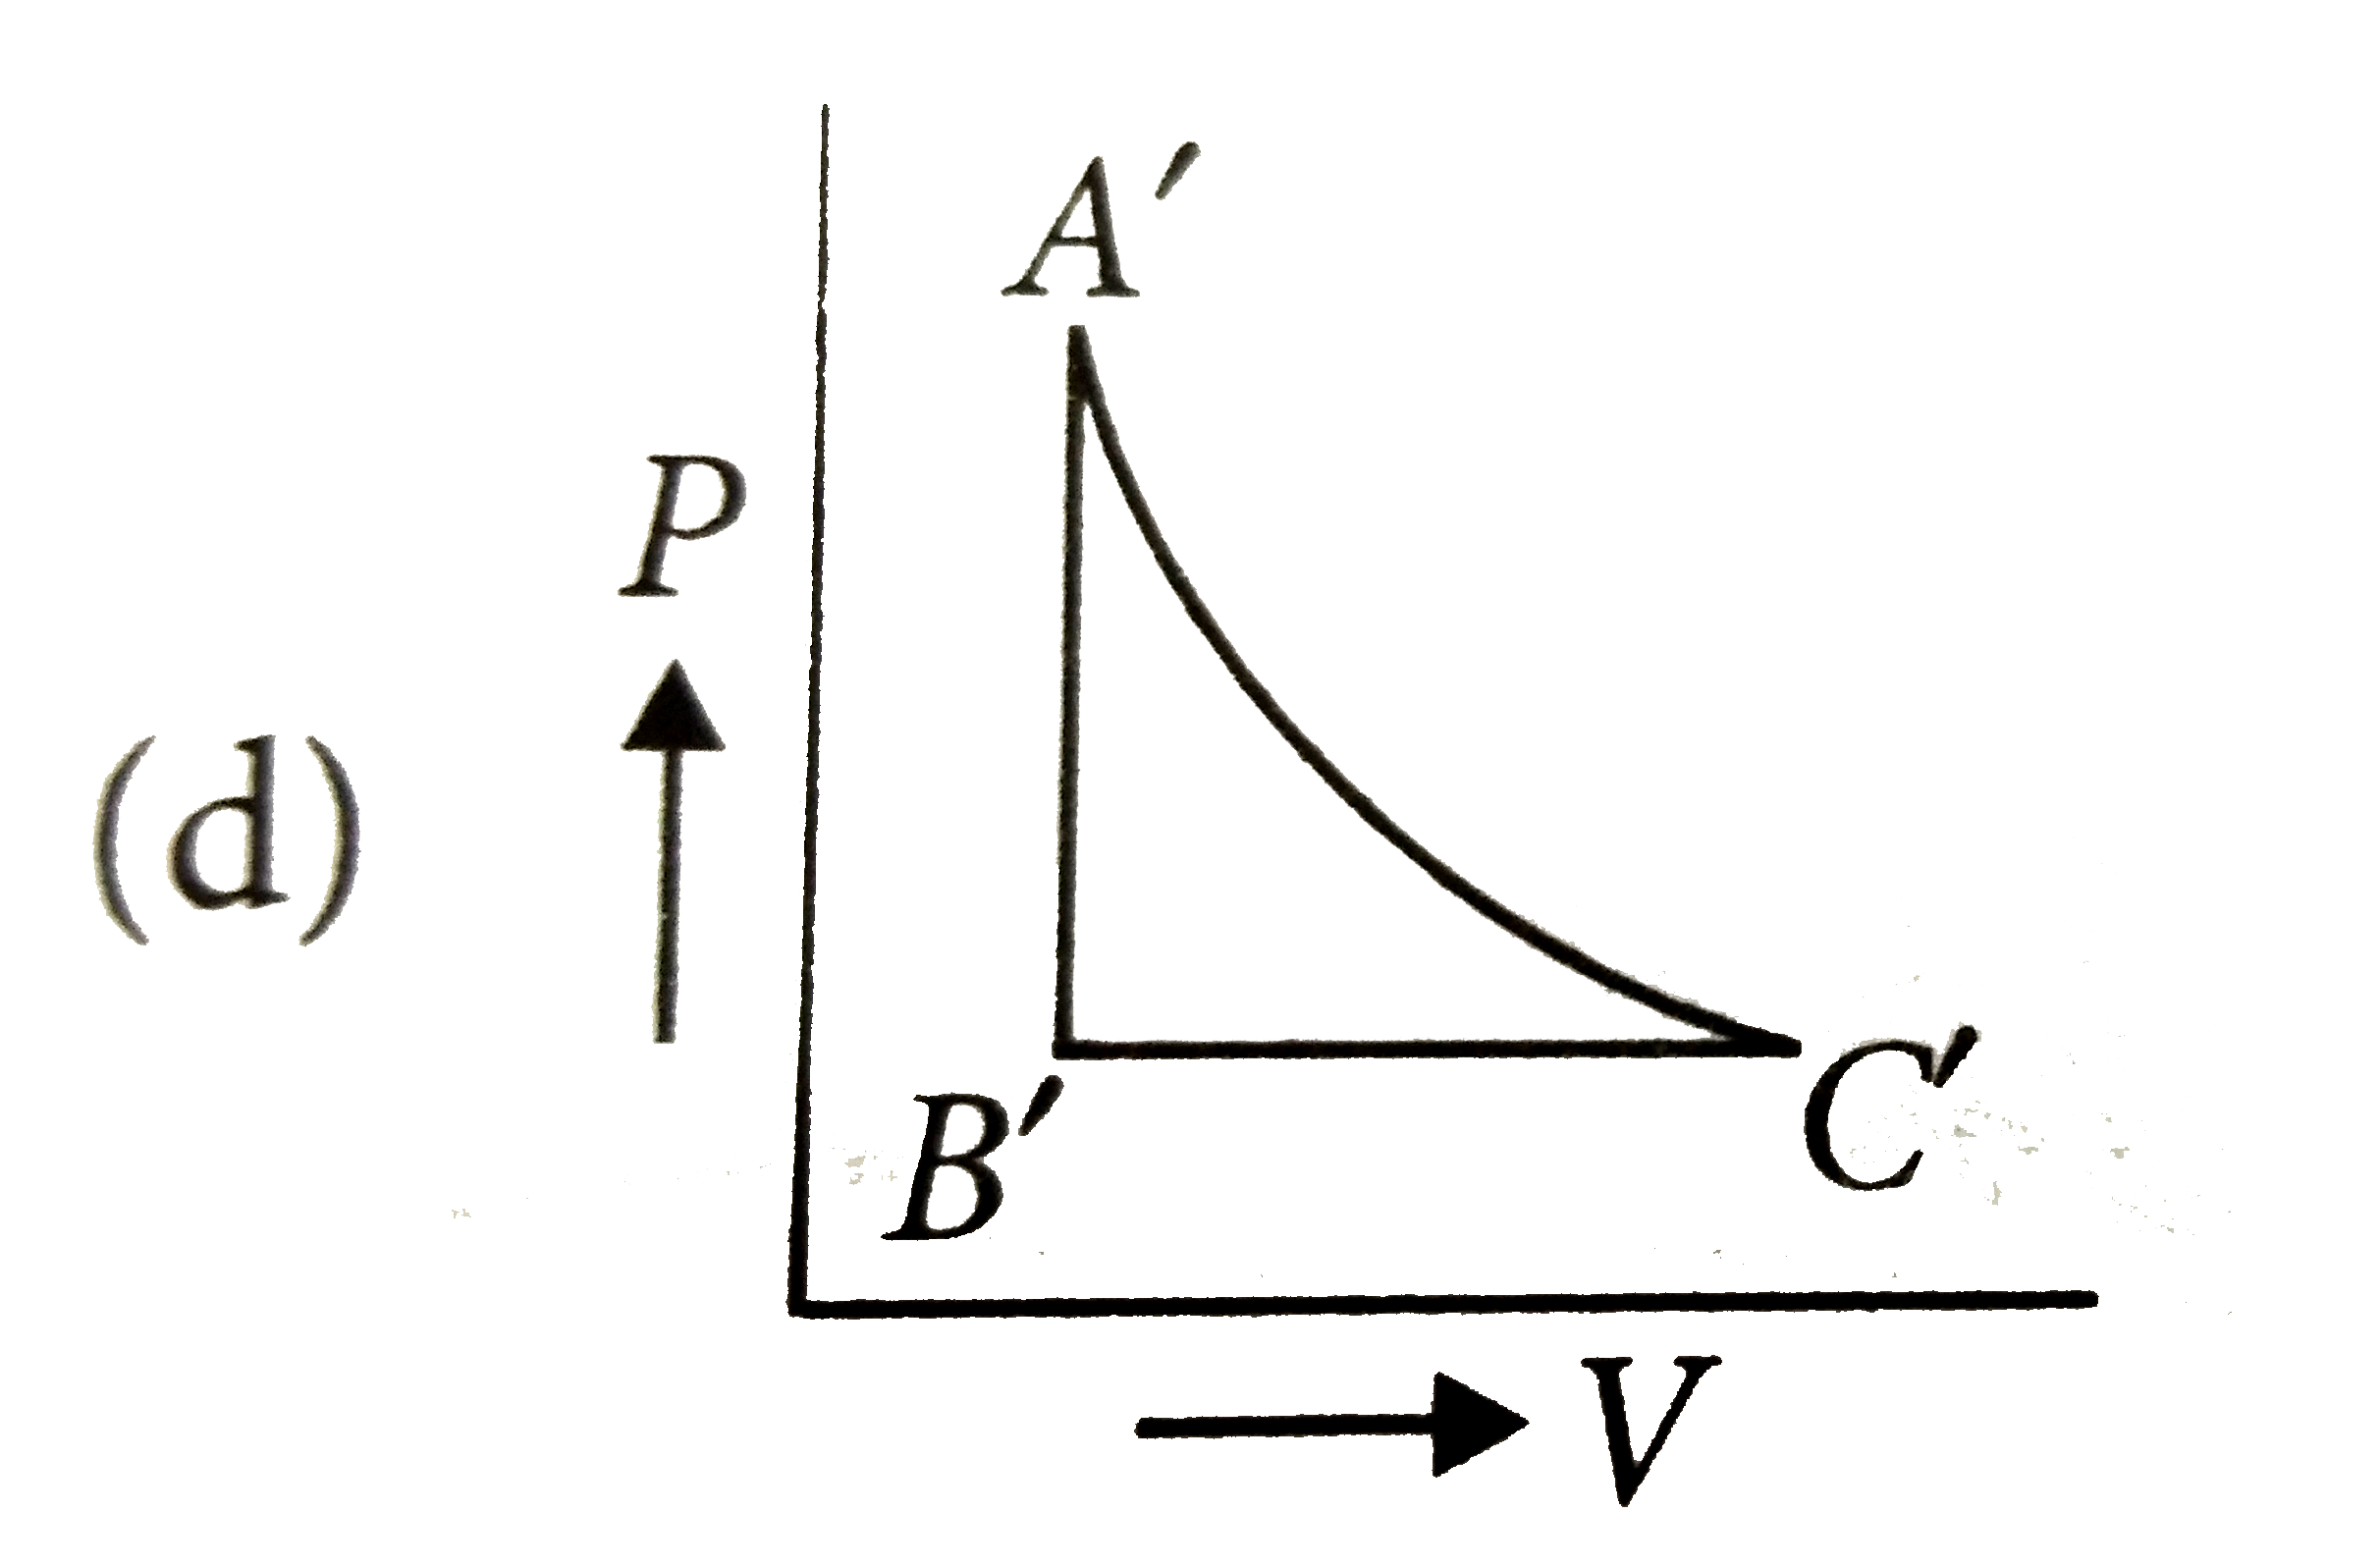
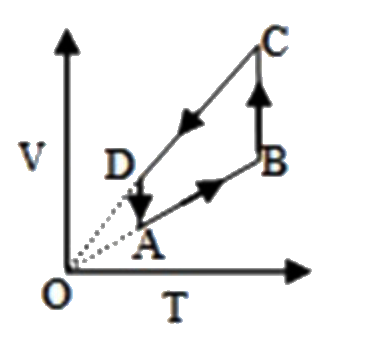
A cyclic process is shown on the V - T diagram . The same process on a P - T diagram is shown by
 View Solution
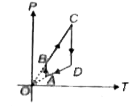
A. P . T graph is shown for a cyclic process . Select correct statement regarding the
 View Solution
An ideal gas has pressure P, volume V and temperature T. Select the correct option.
View SolutionA cyclic process ABCD is shown in the V−T diagram. Which of the following curves represent the same process ?
 View Solution
Identify P-V in the given figure and select the correct option.
 View Solution
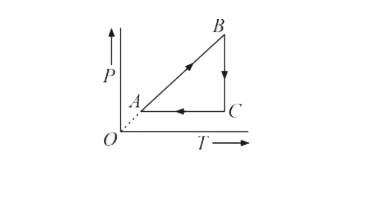
A cyclic process is shown in theP–T diagram. Which of the curves show the same process on a V–T diagram?
 View Solution
A cyclic process is shown in theP–T diagram. Which of the curves show the same process on a V–T diagram?
 View Solution


