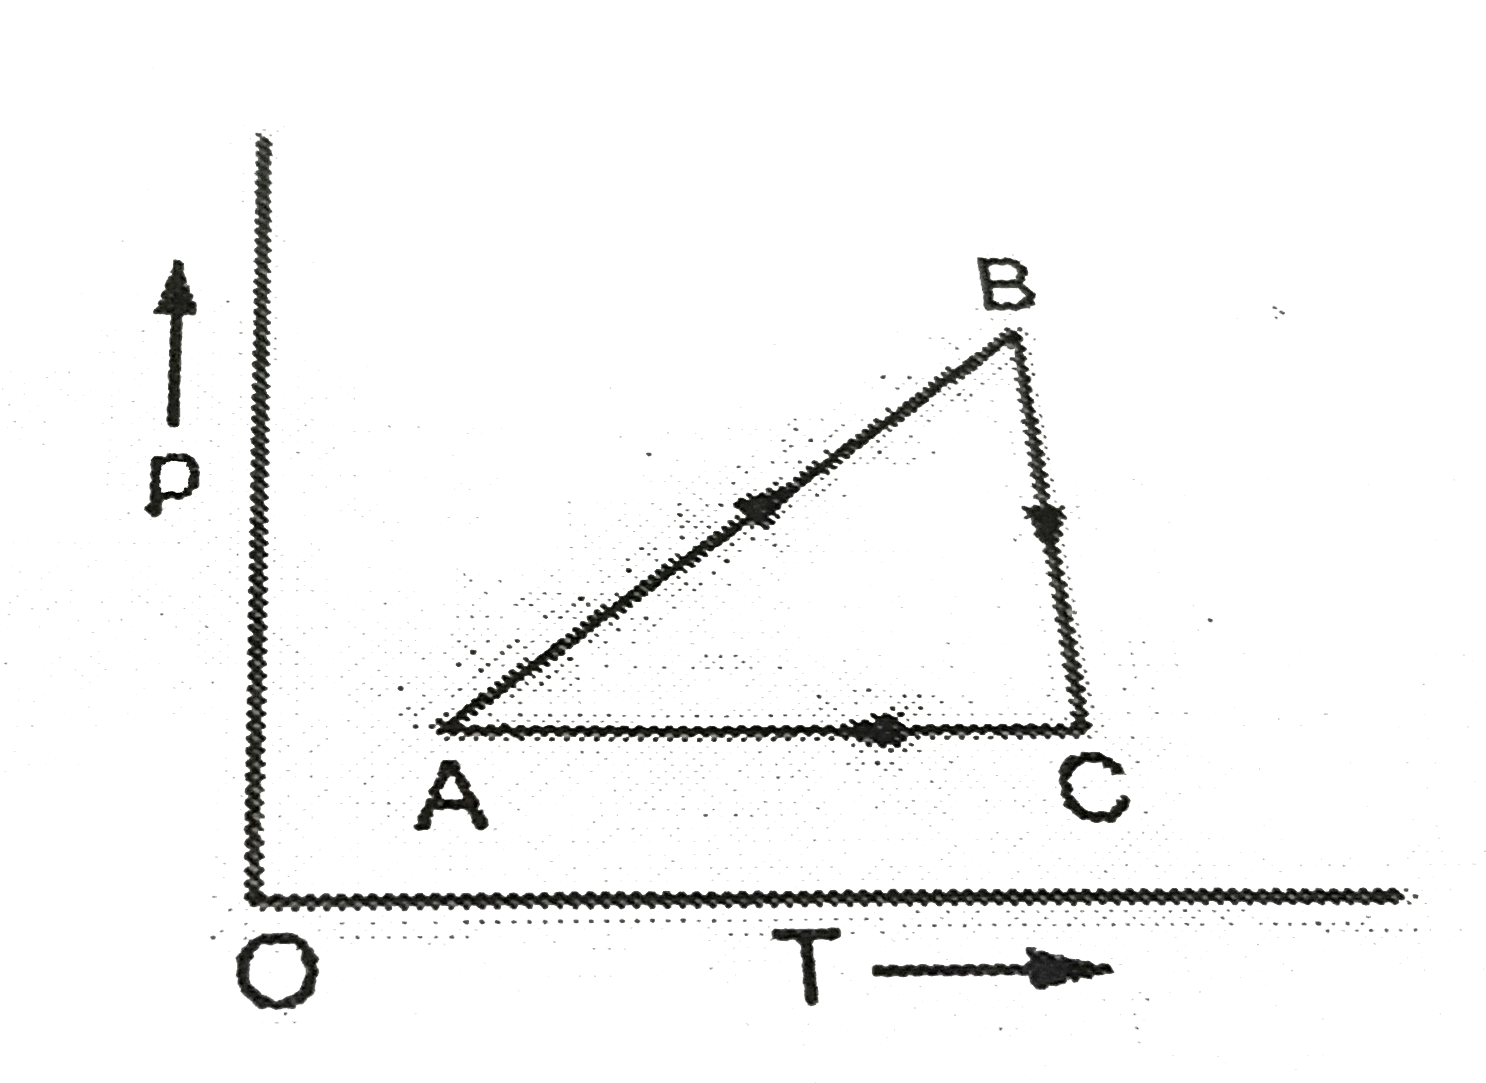
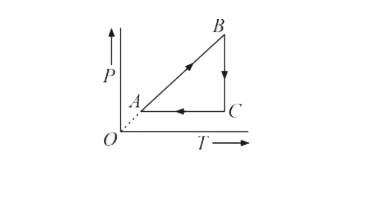
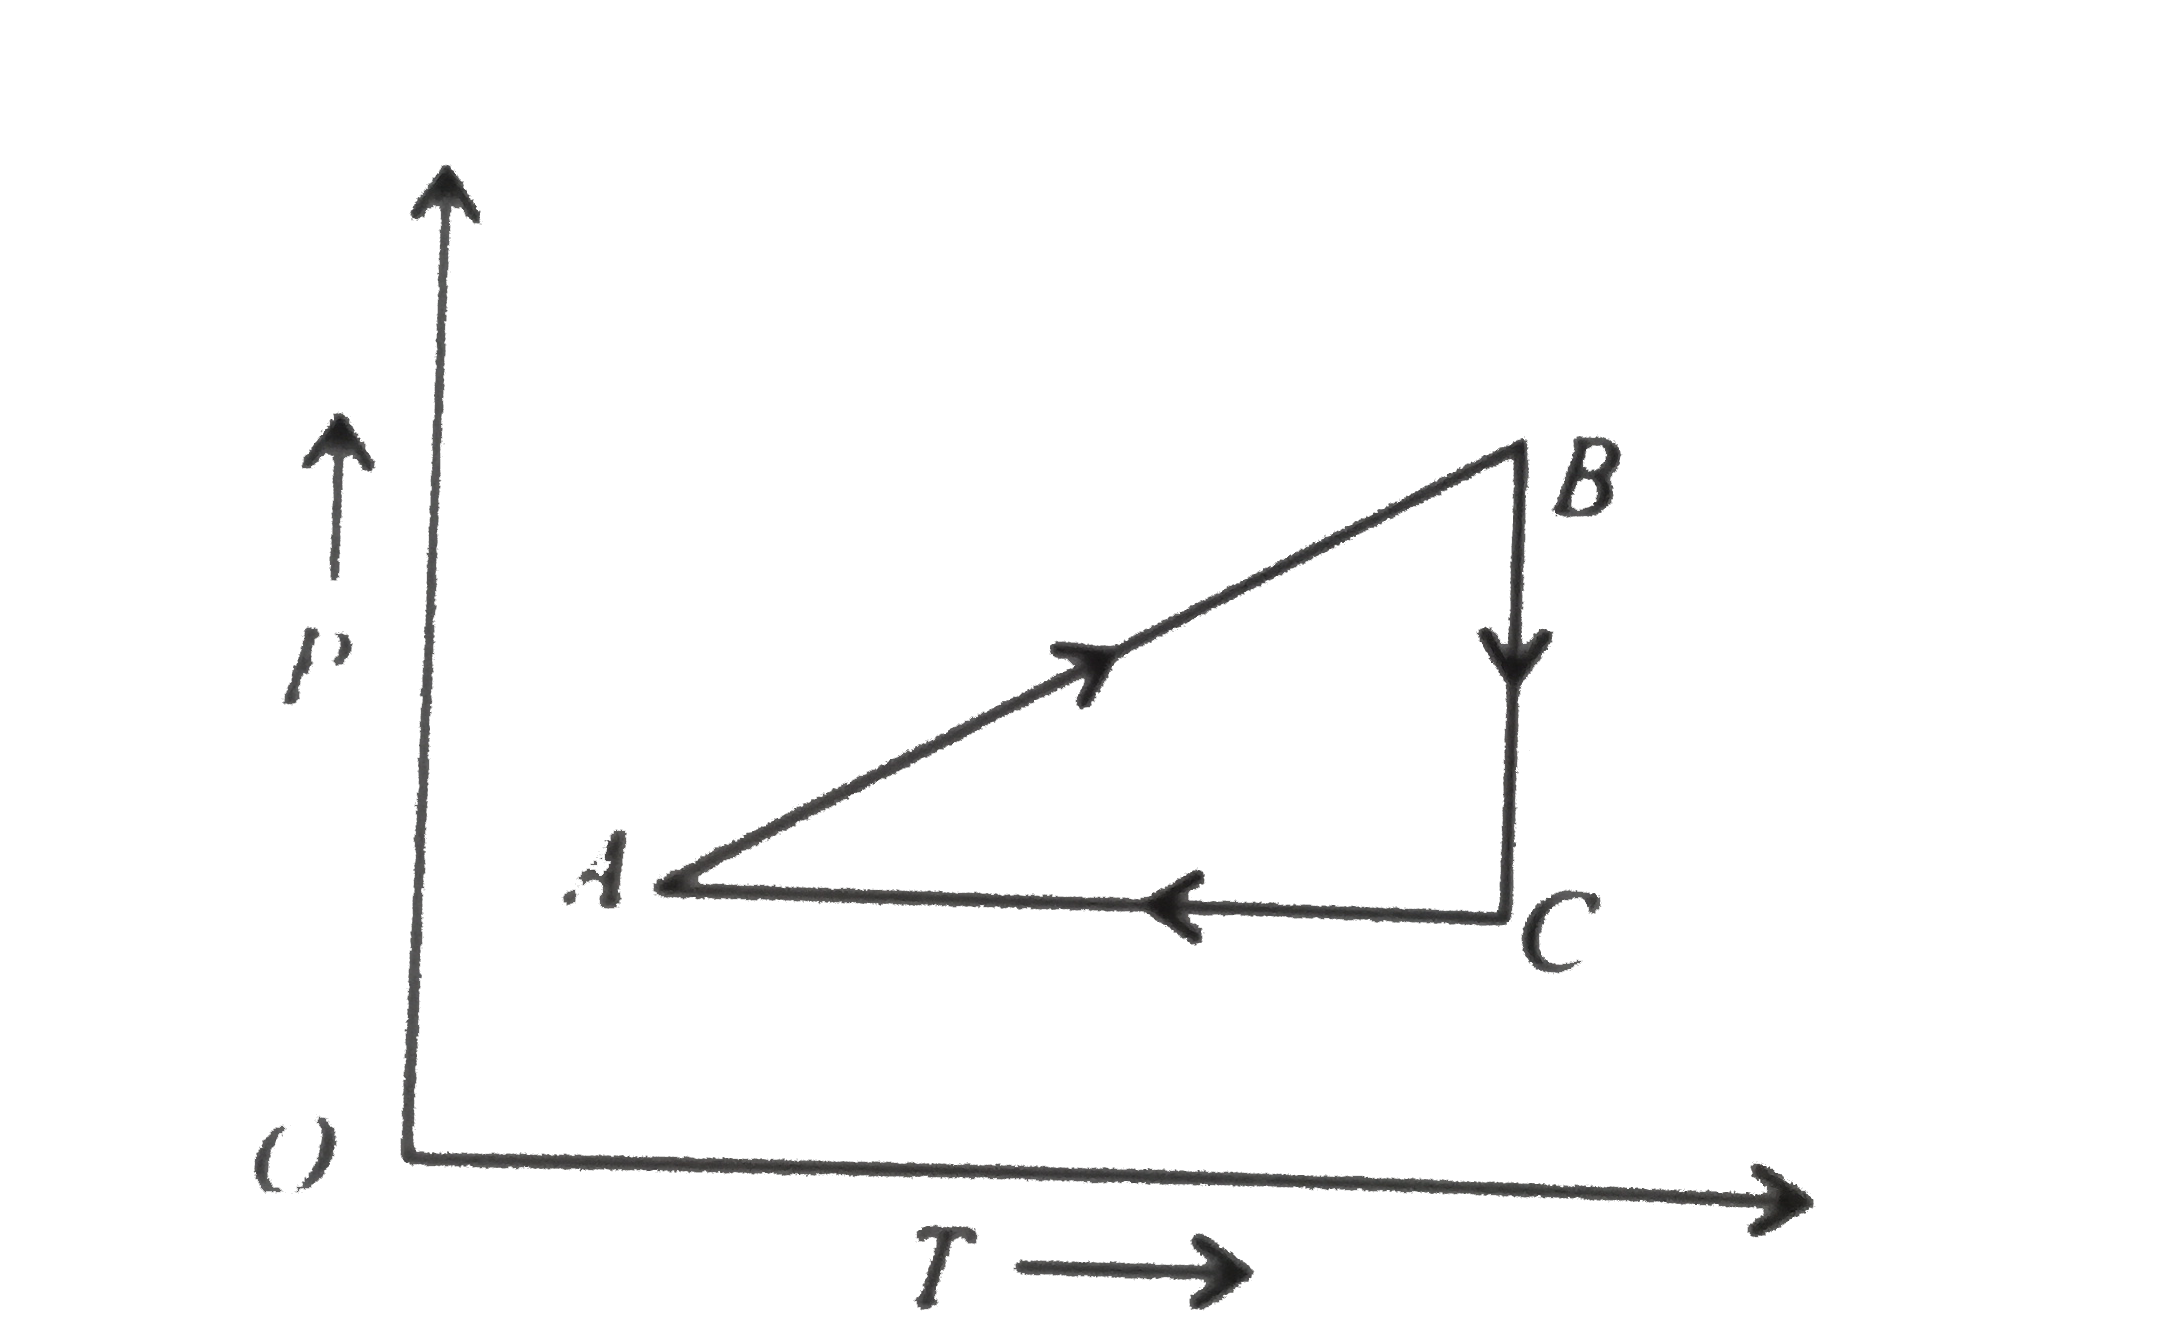
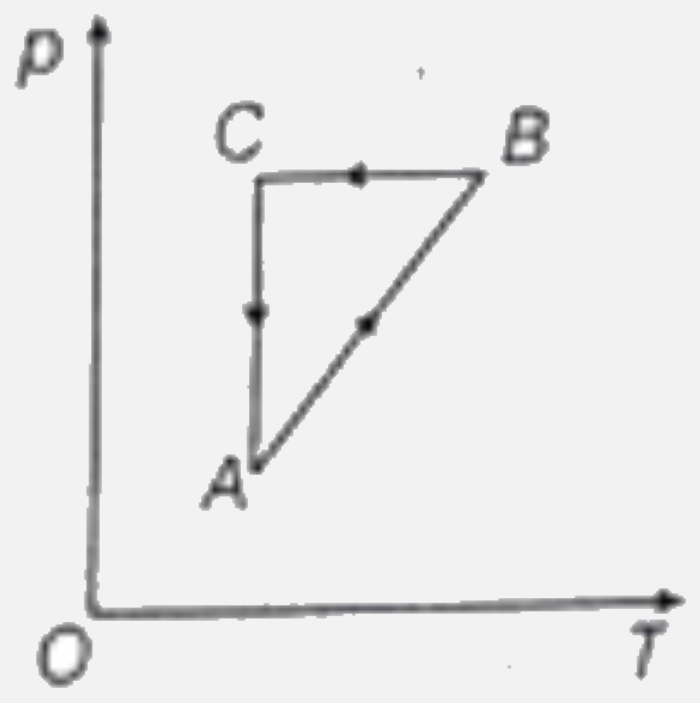
A cyclic process is shown in the P−T siagram. Whech of the curves show the same process on a P−V diagram ?
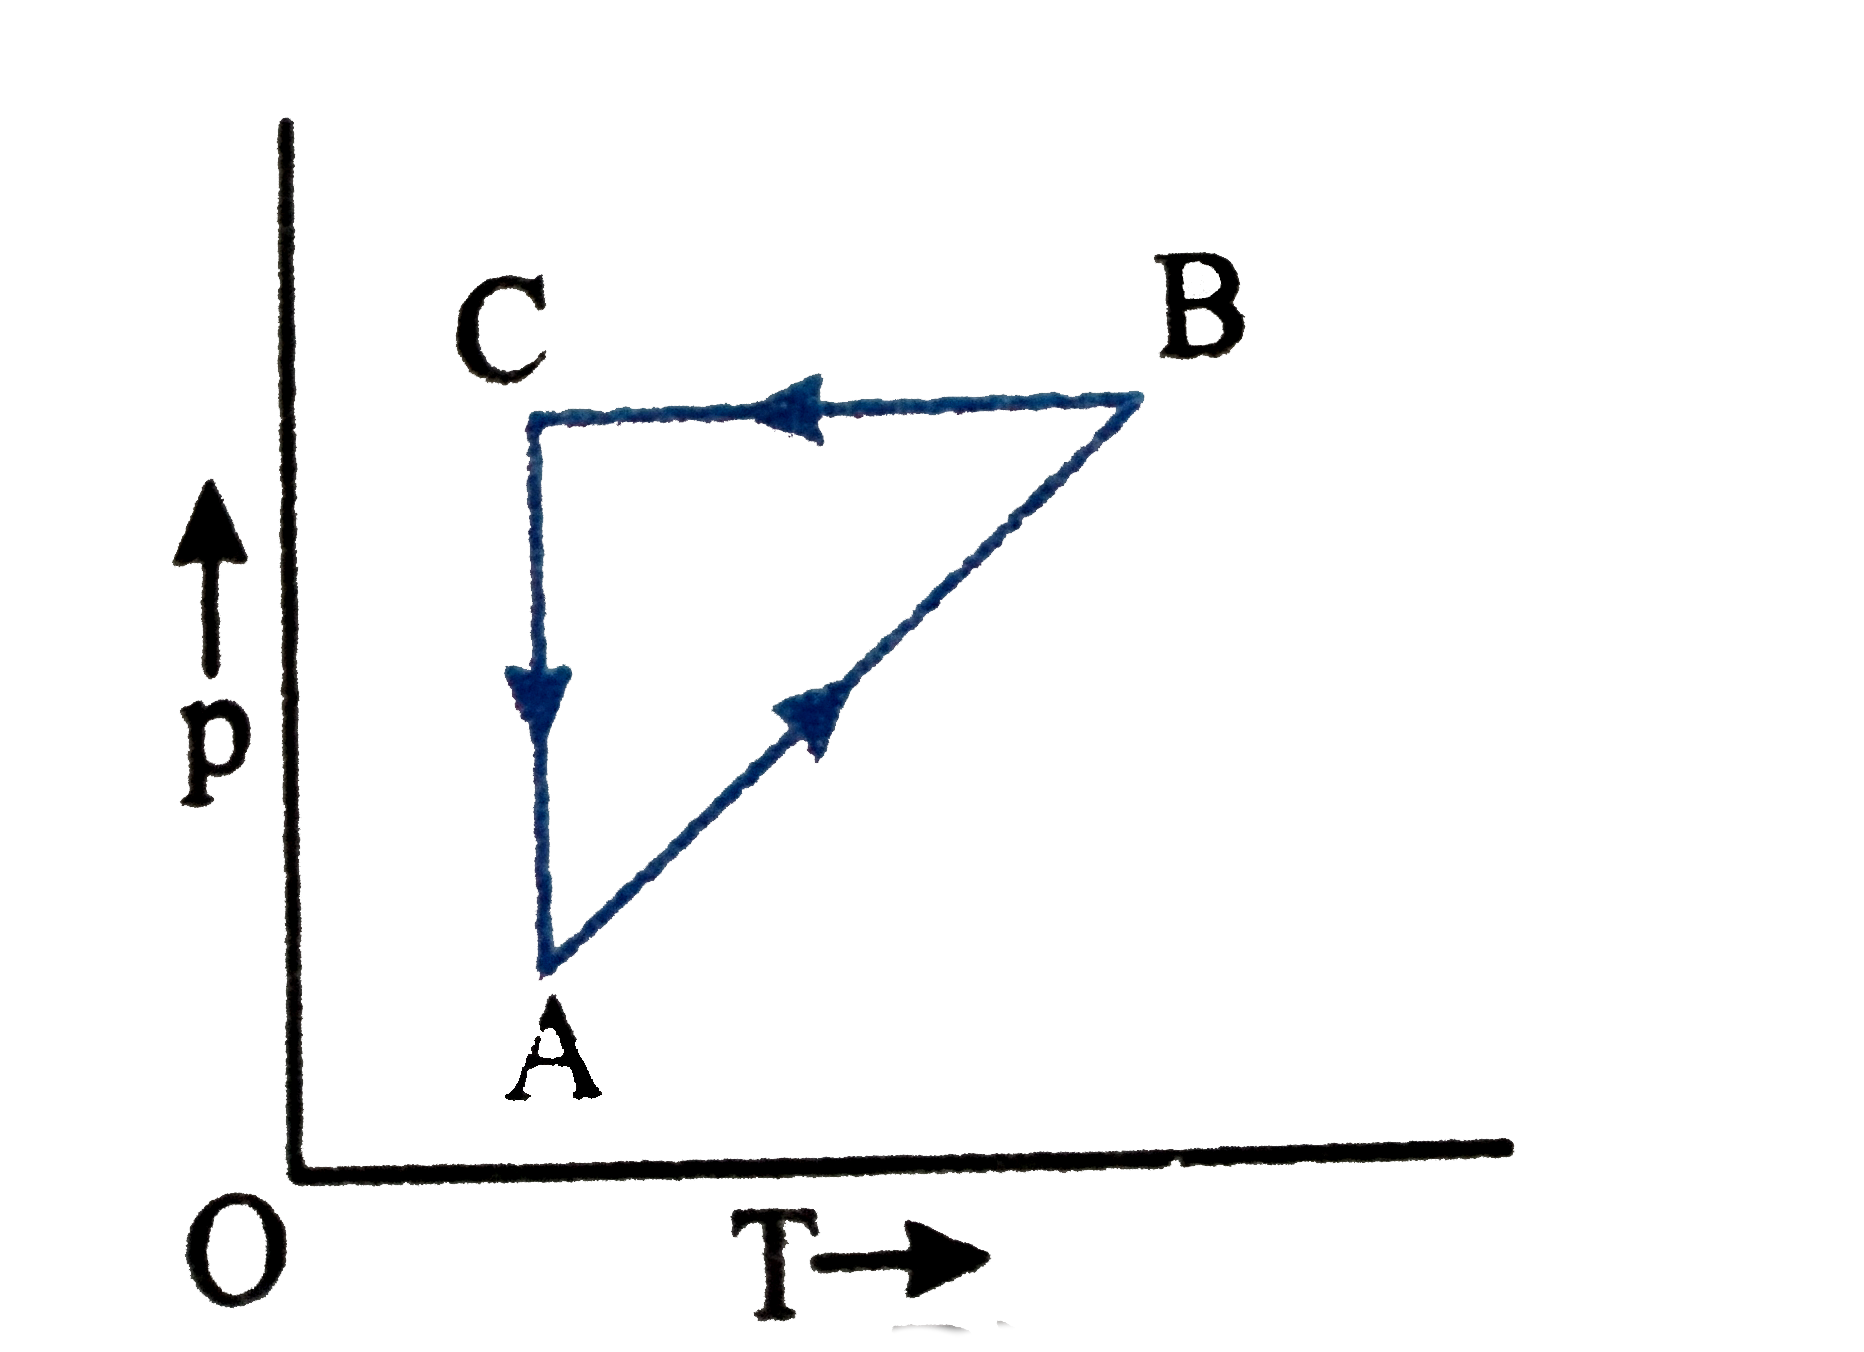
A
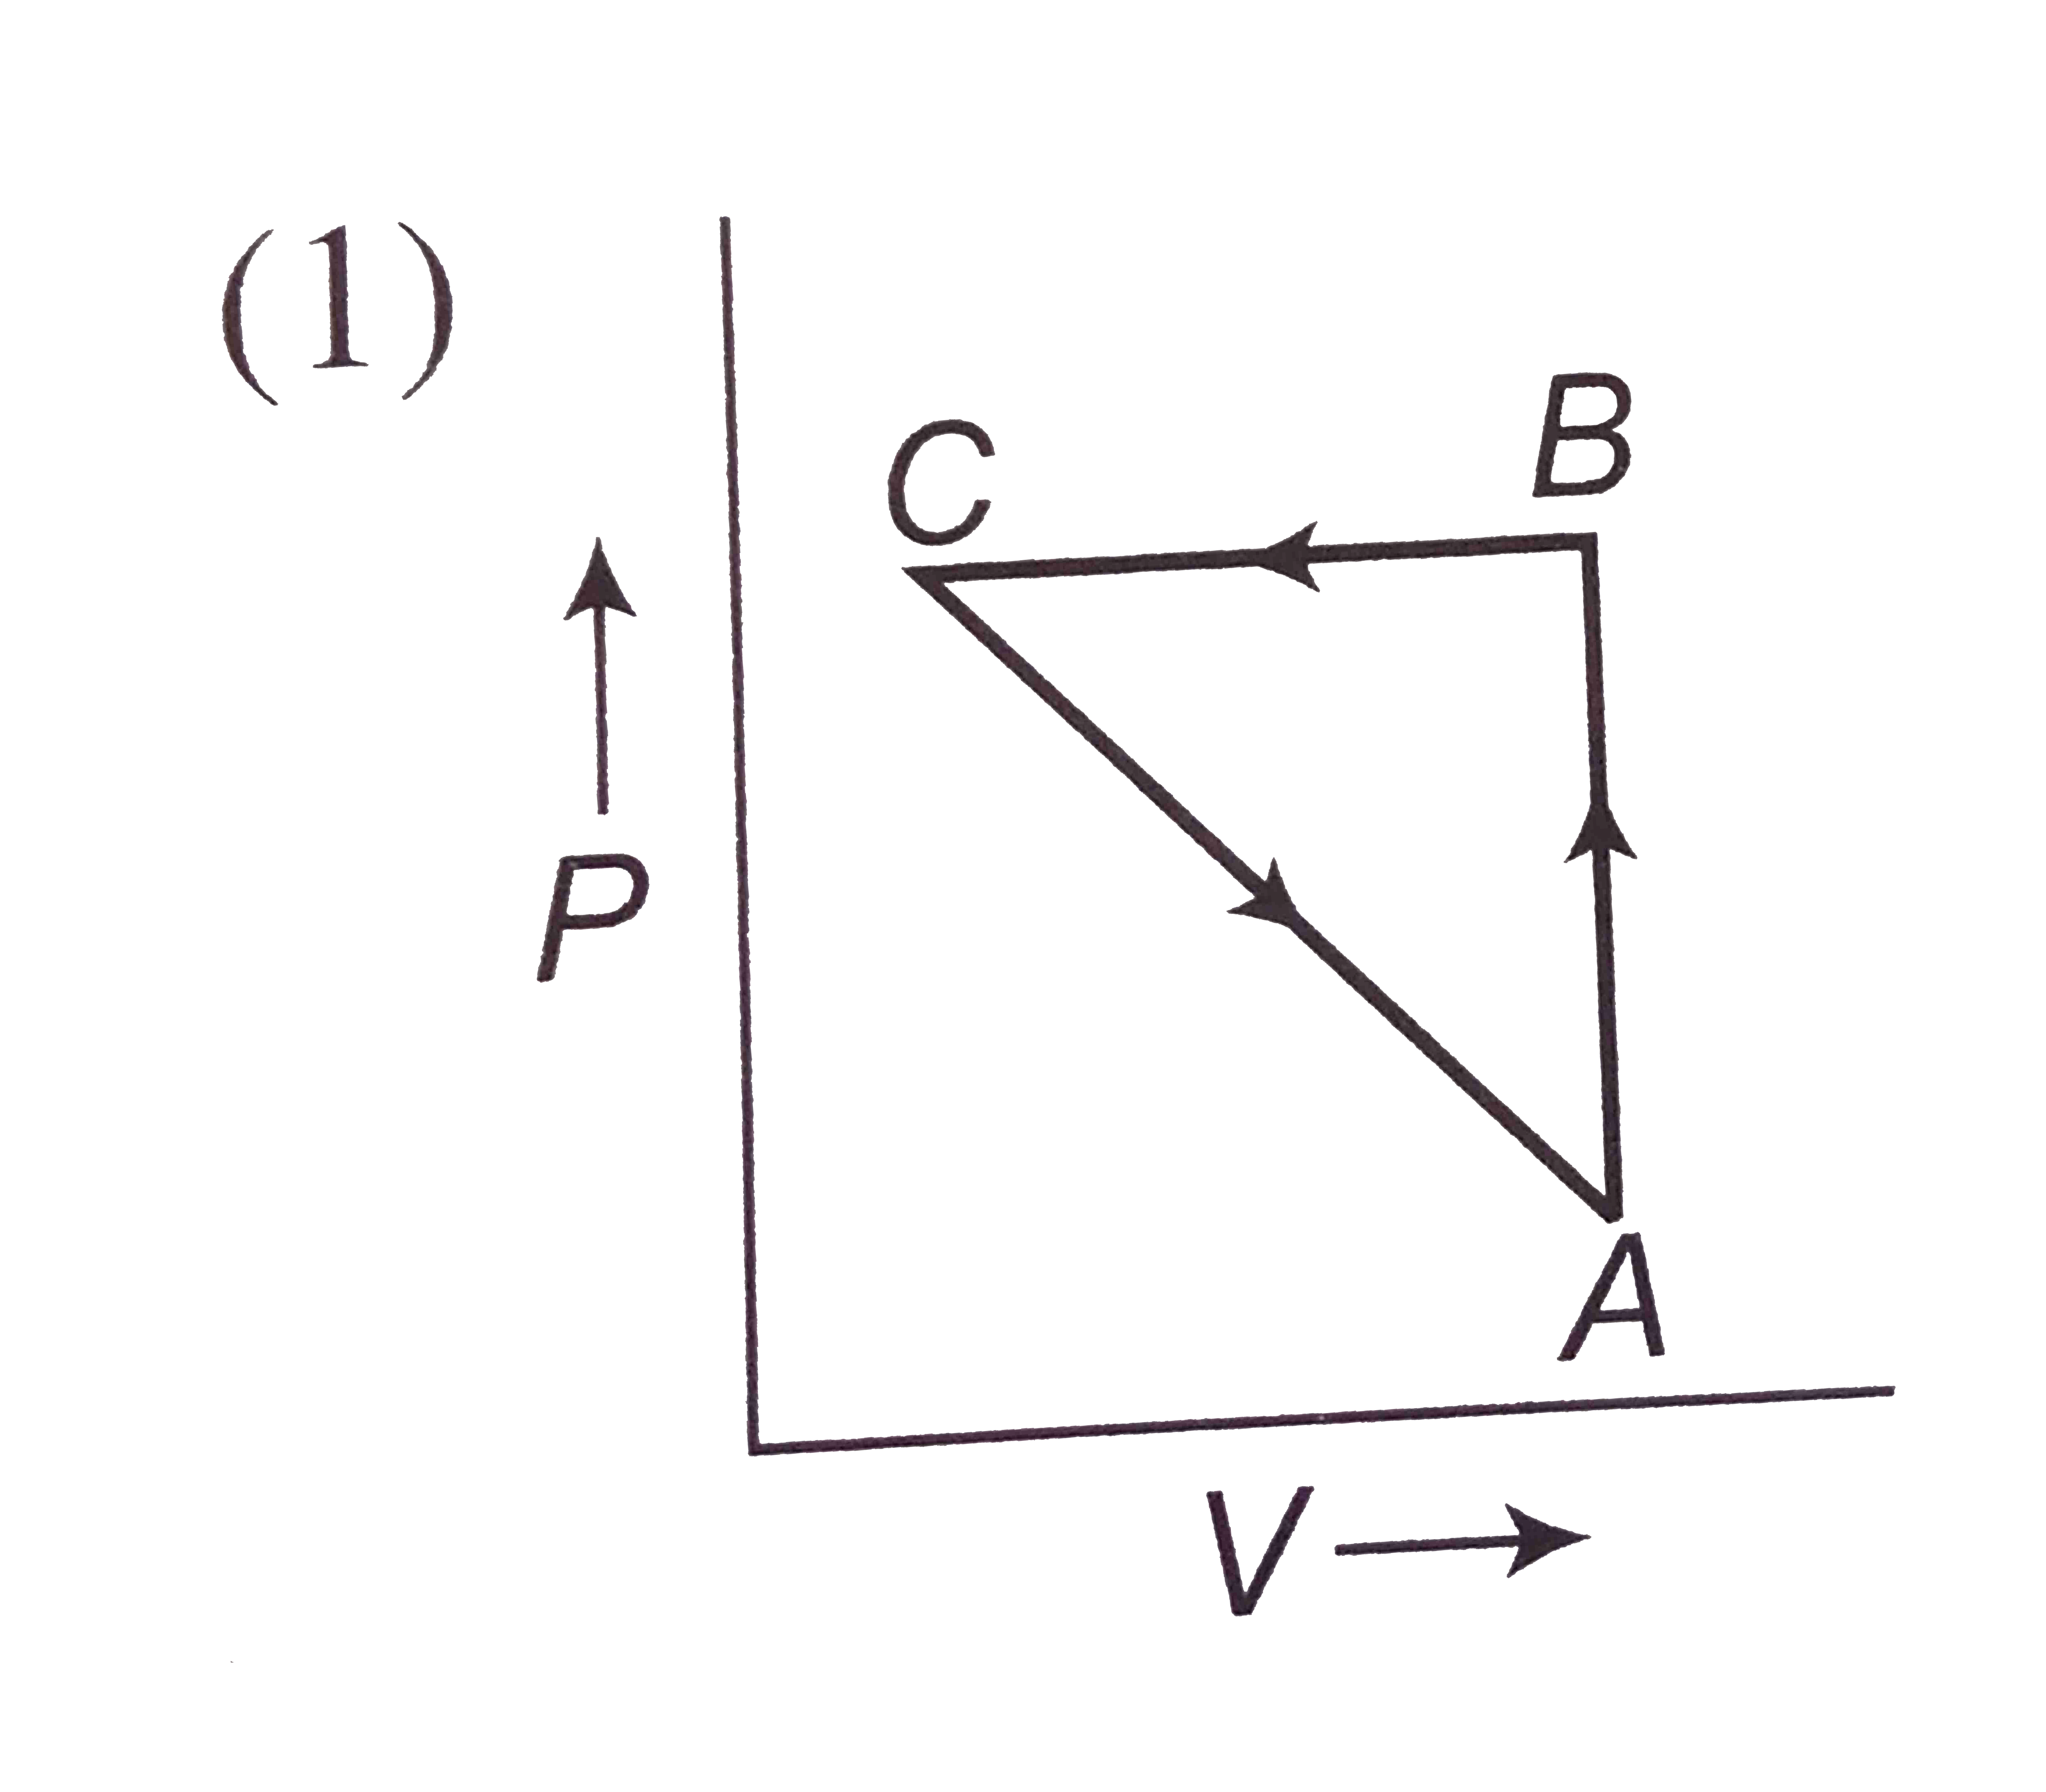
B
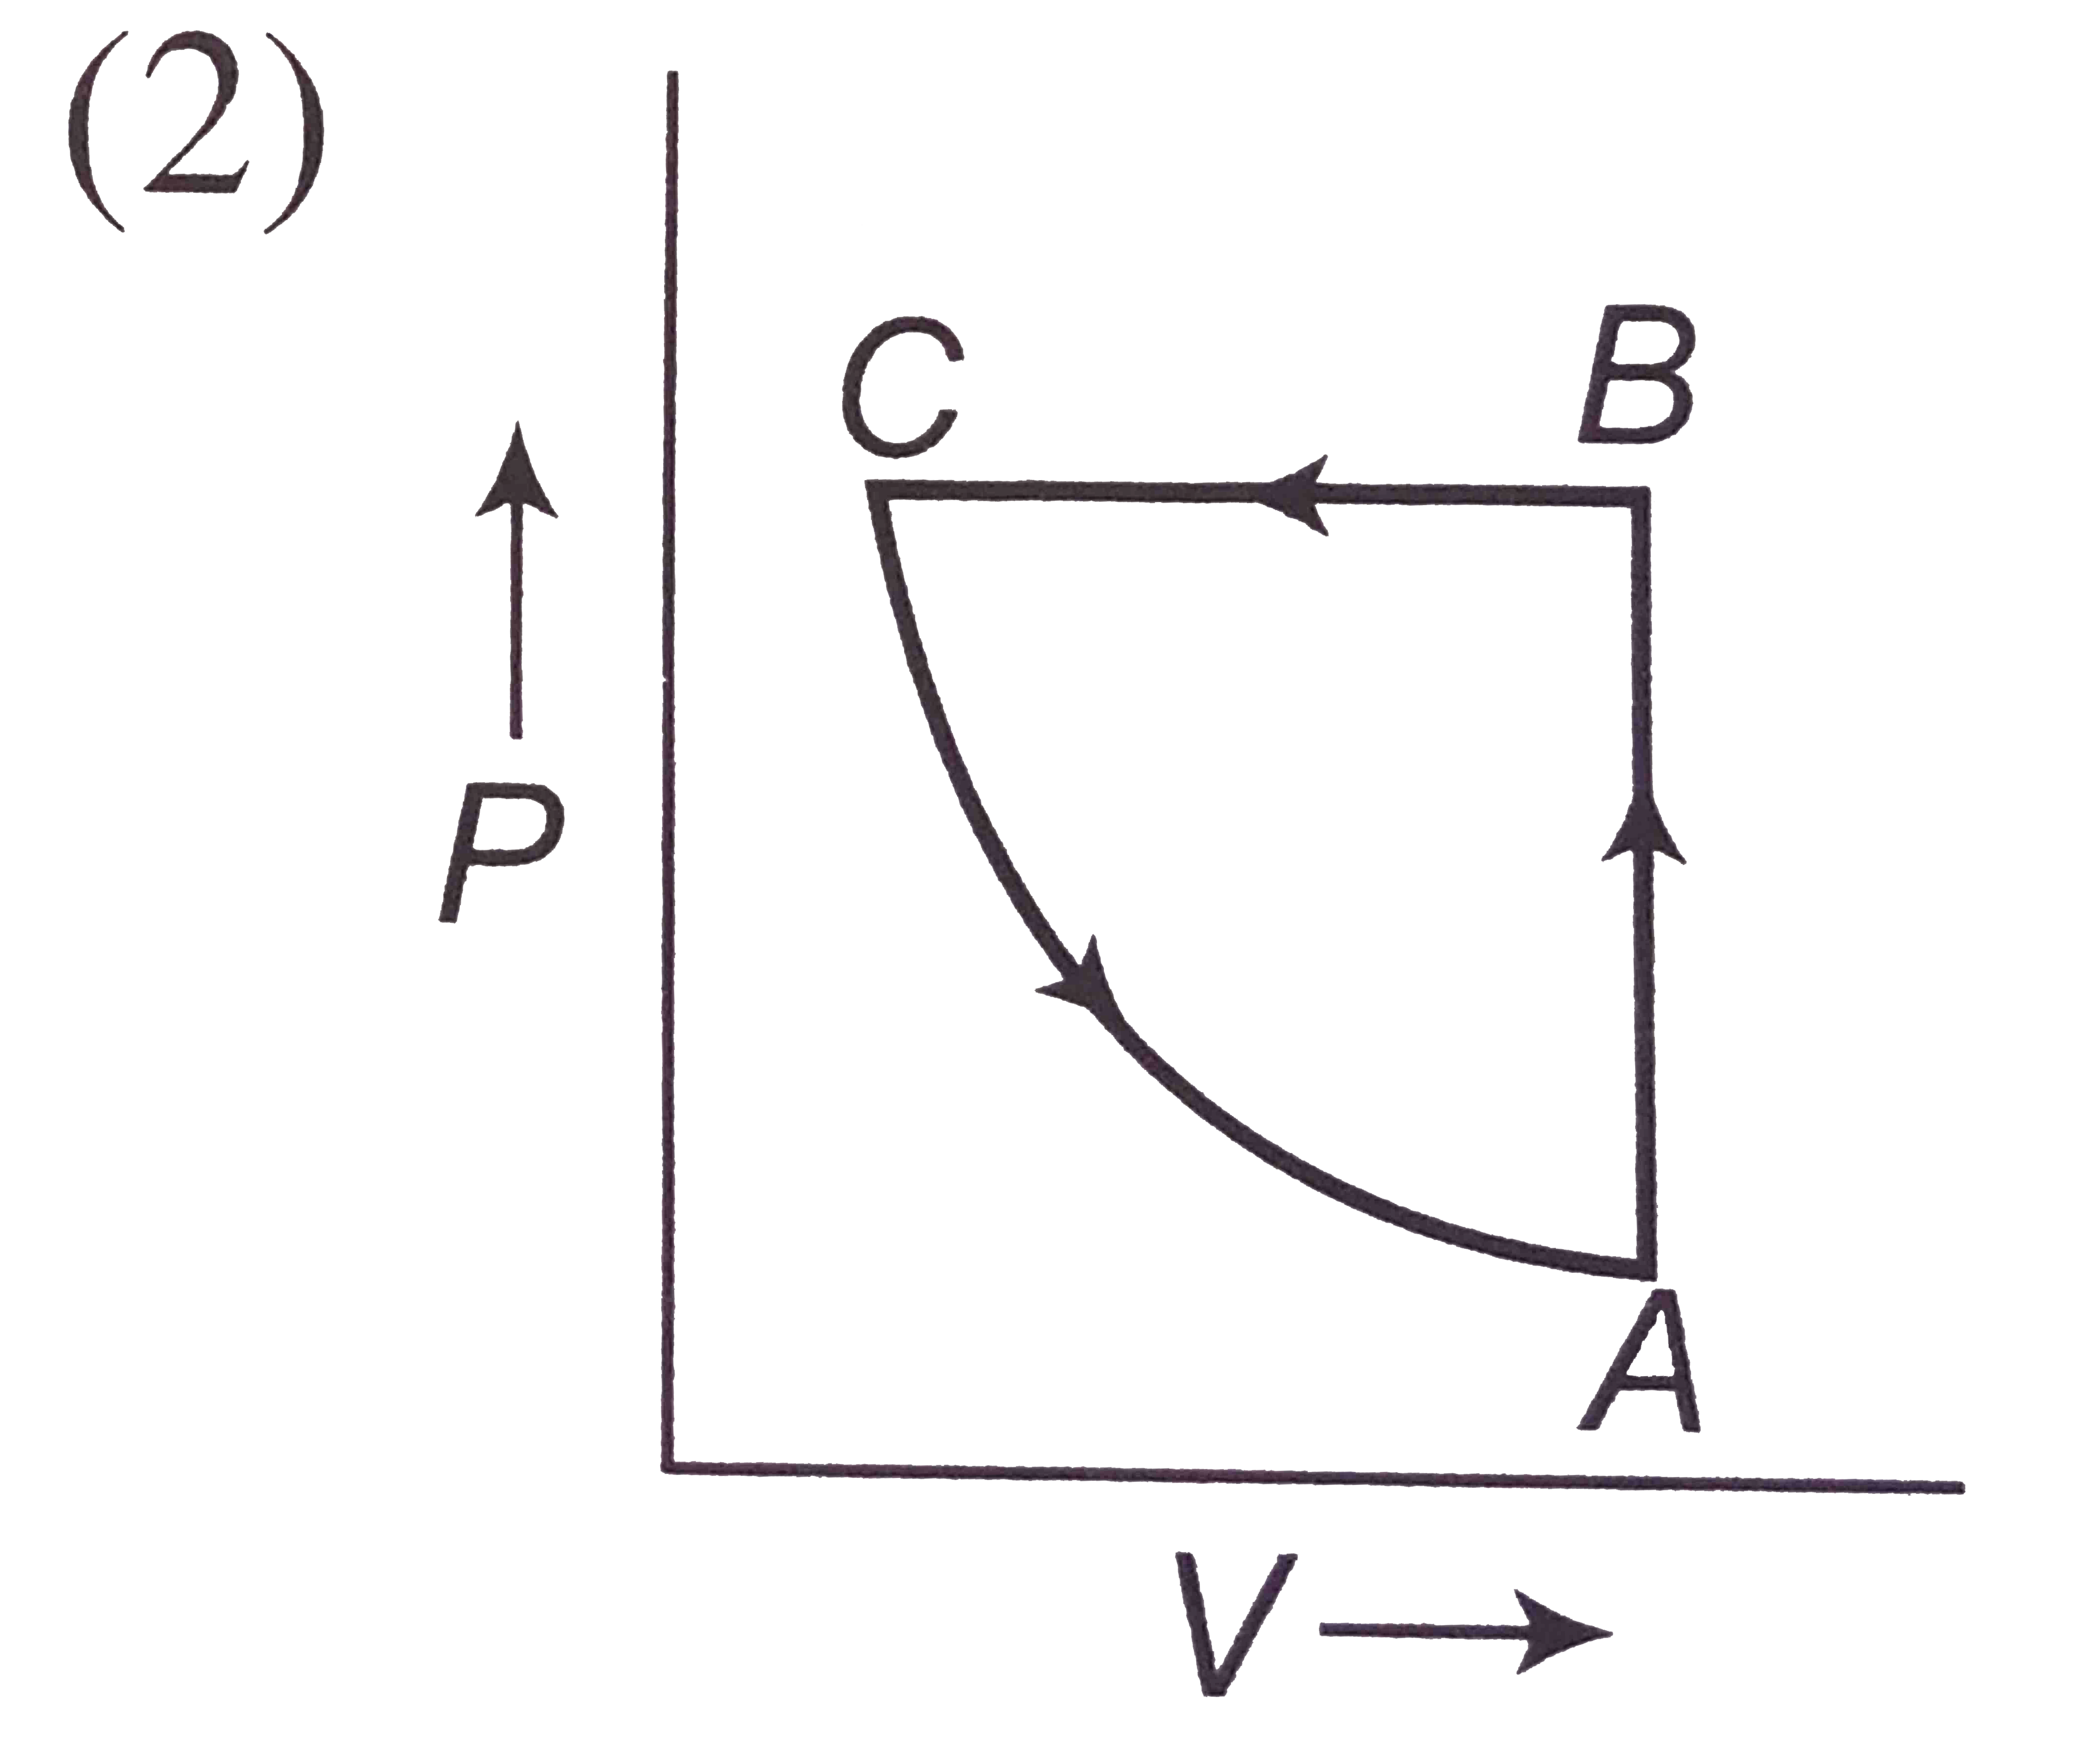
C
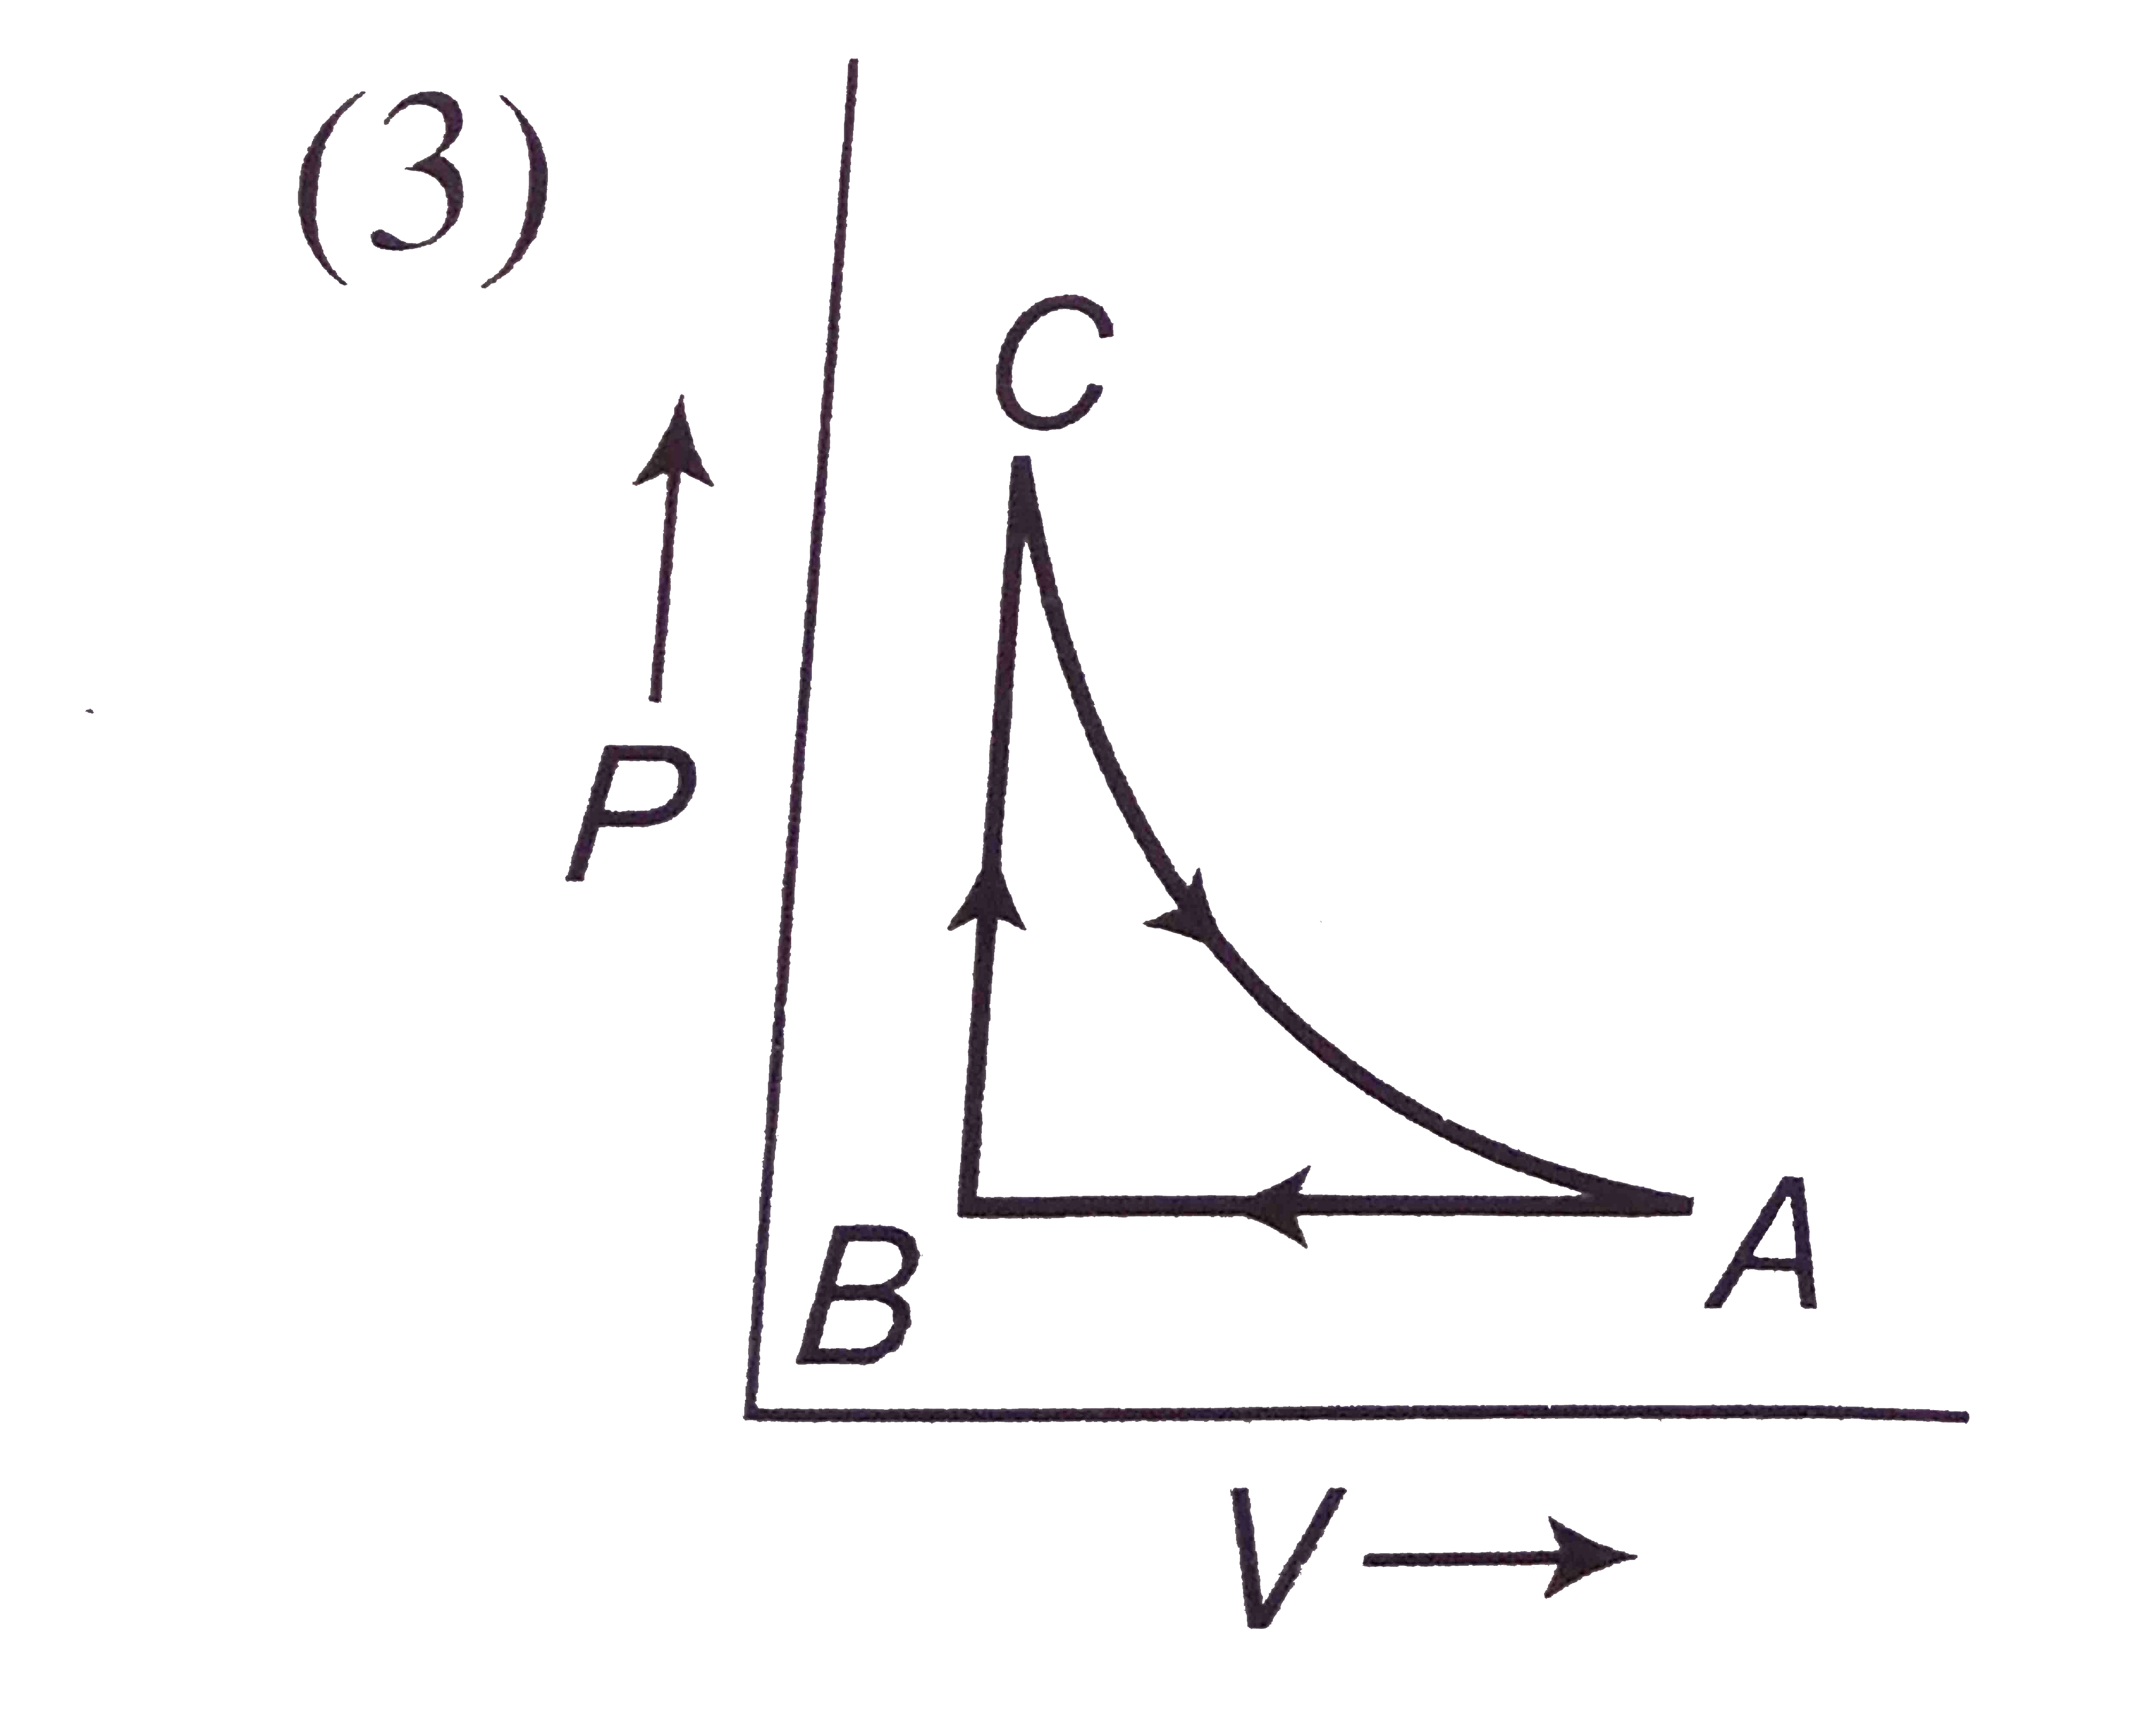
D
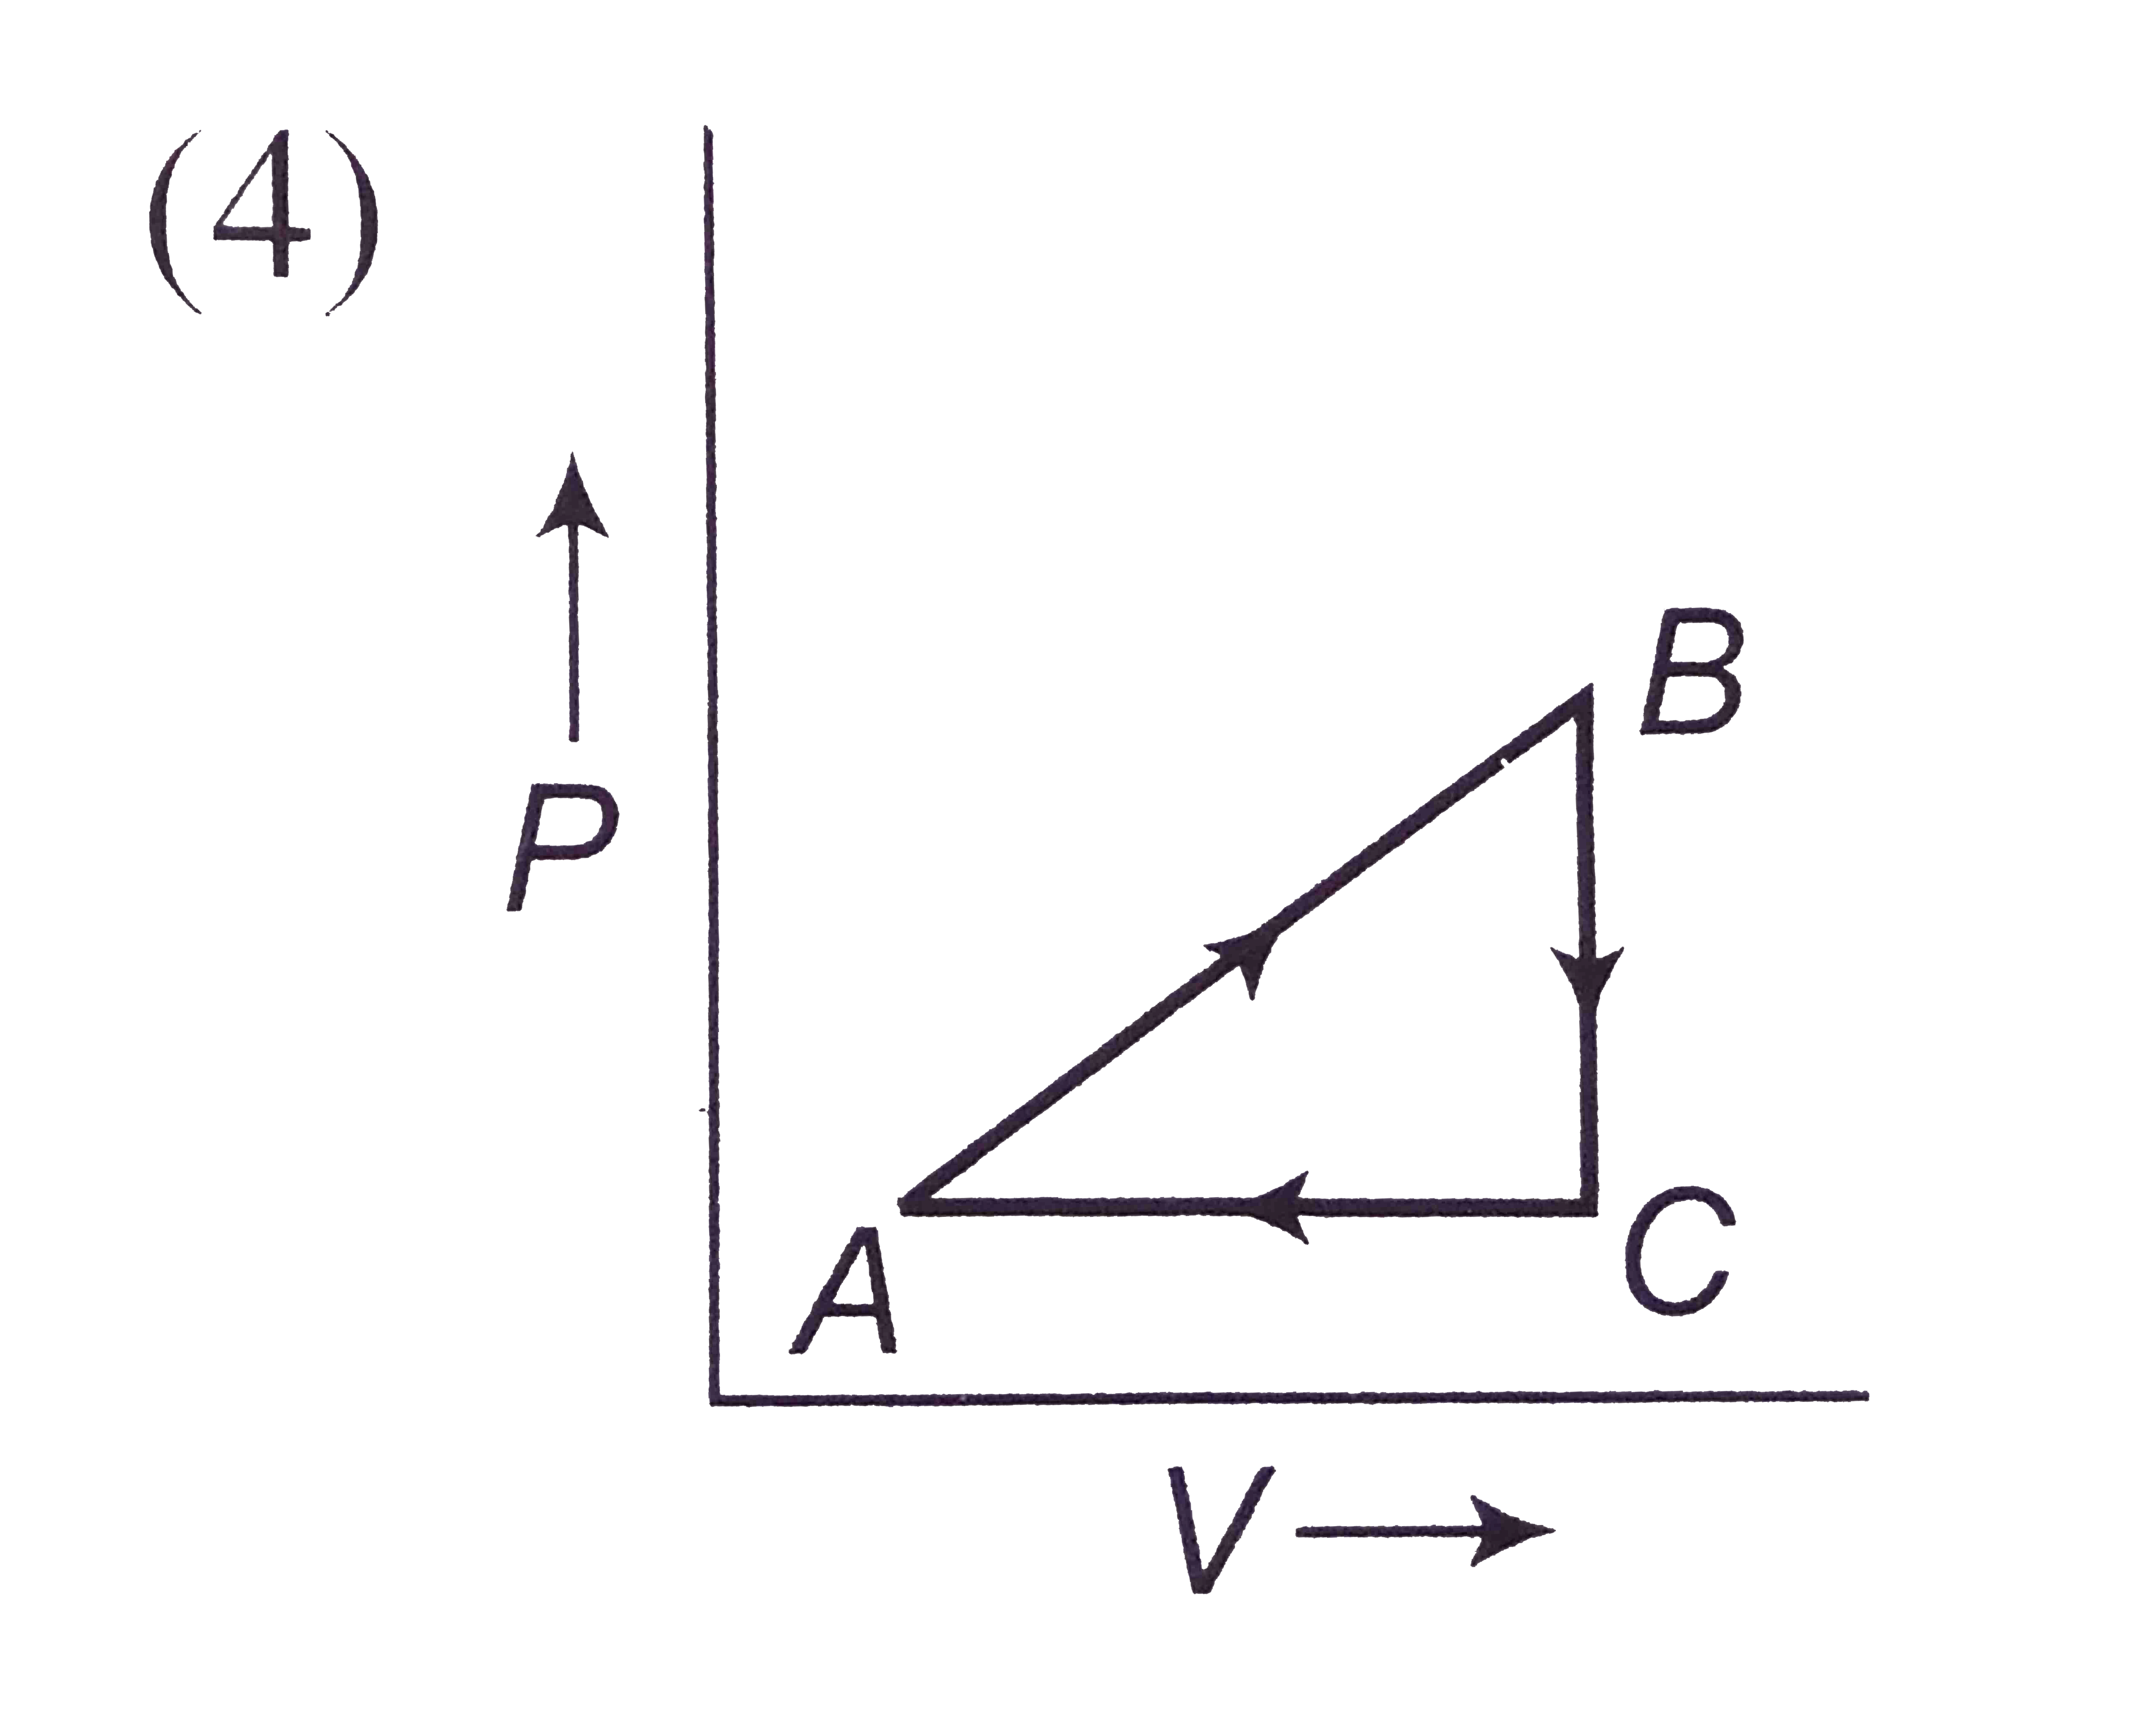
Video Solution
Text Solution
The correct Answer is:B
PVT= constant (for given mass of ideal gas)
AB: isochoric process, V: constant T is increasing hence, P is increasing
BC: isobaric process, P: constant, T is decreasing hence, V is decreasing.
CA: isothermal process, P is decreasing hence, V is increasing, P−V diagram, P is decreasing hence, V is increasing, P−V diagram is rectangular hyperbola.
|
Topper's Solved these Questions
Similar Questions
Knowledge Check
A cyclic process is shown in the P−T diagram. Which of the curves show the same process on a P−V diagram ?
 A
A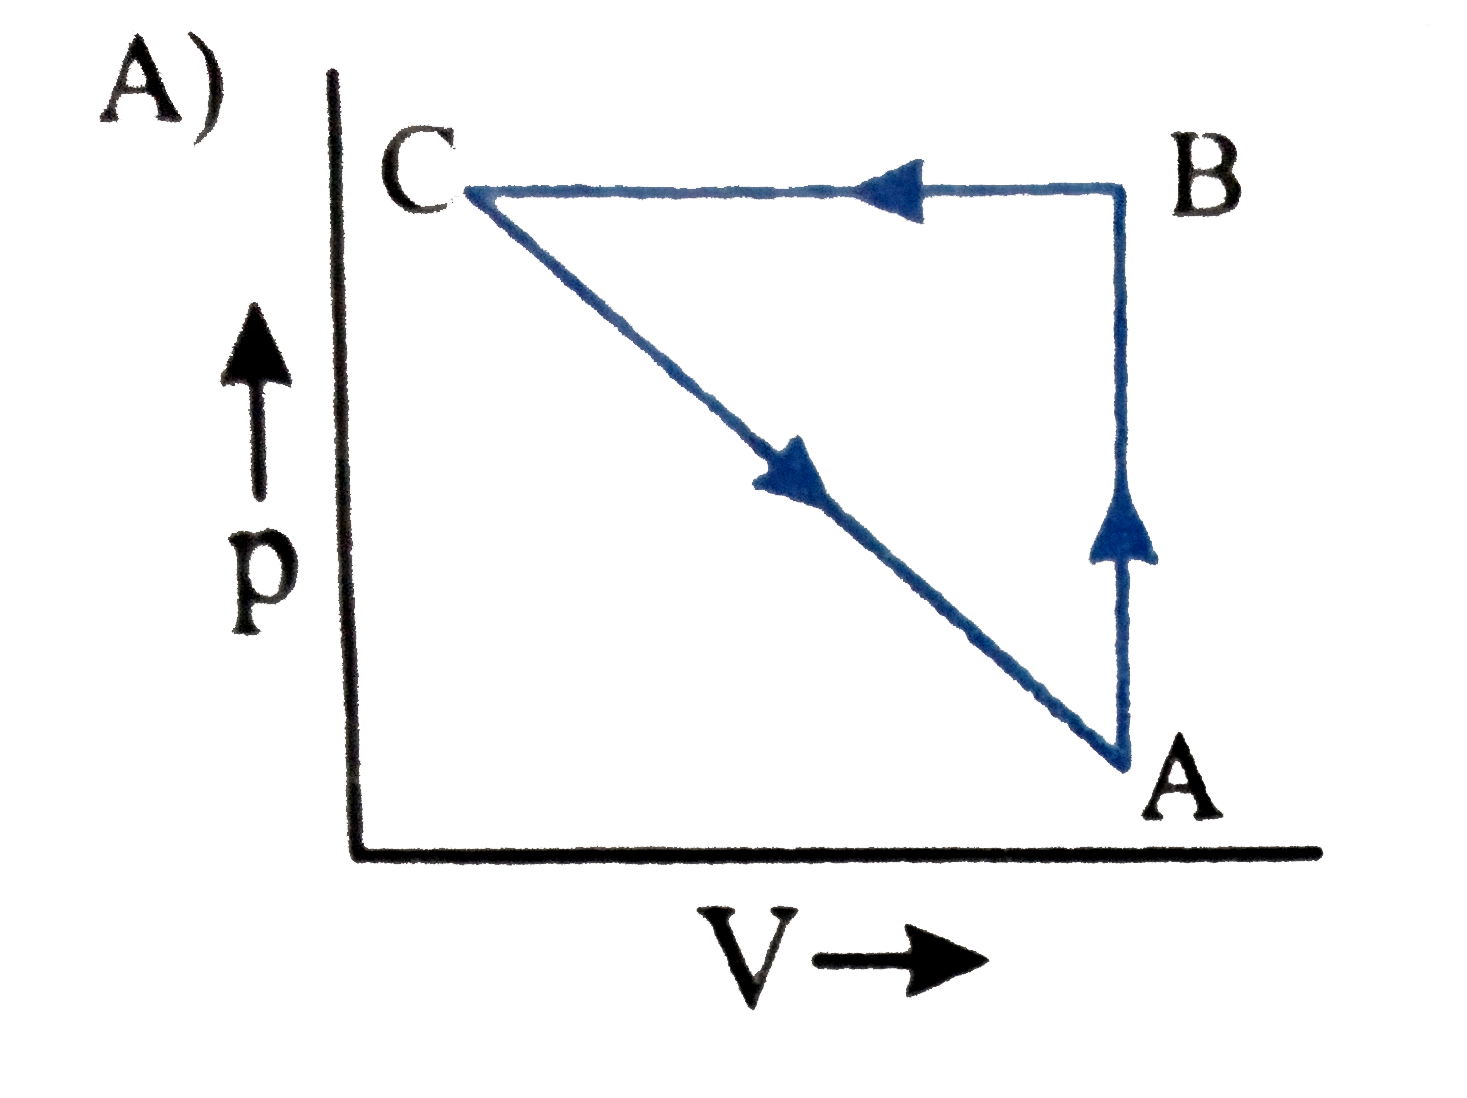 B
B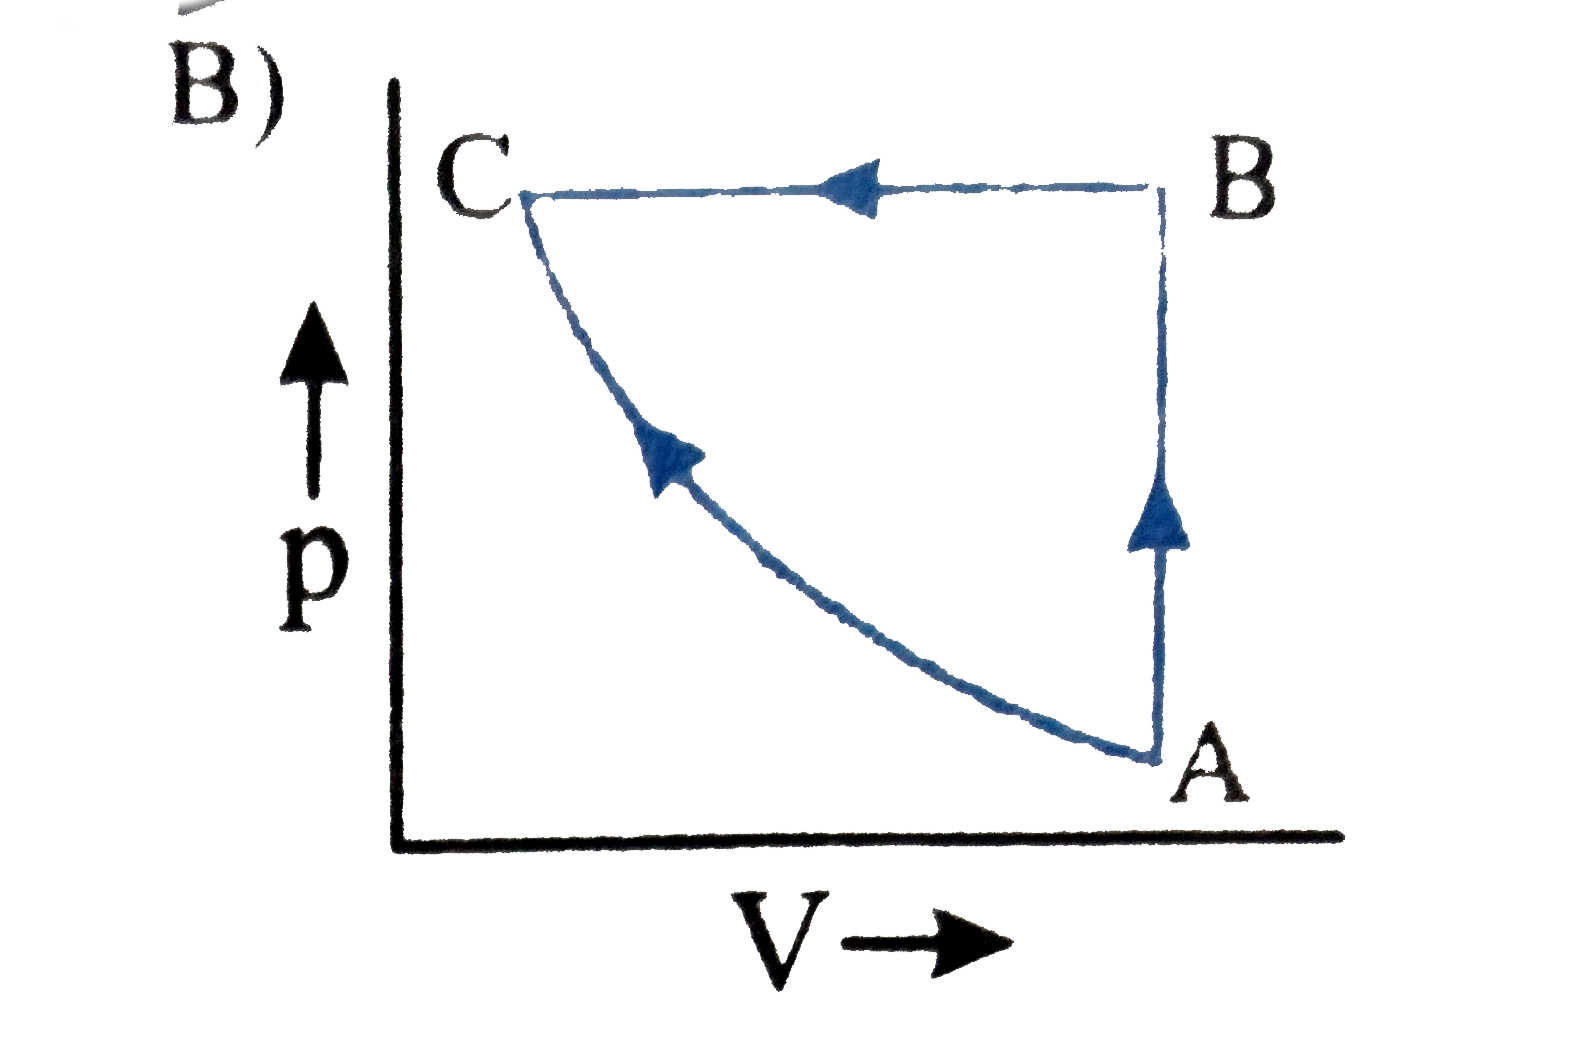 C
C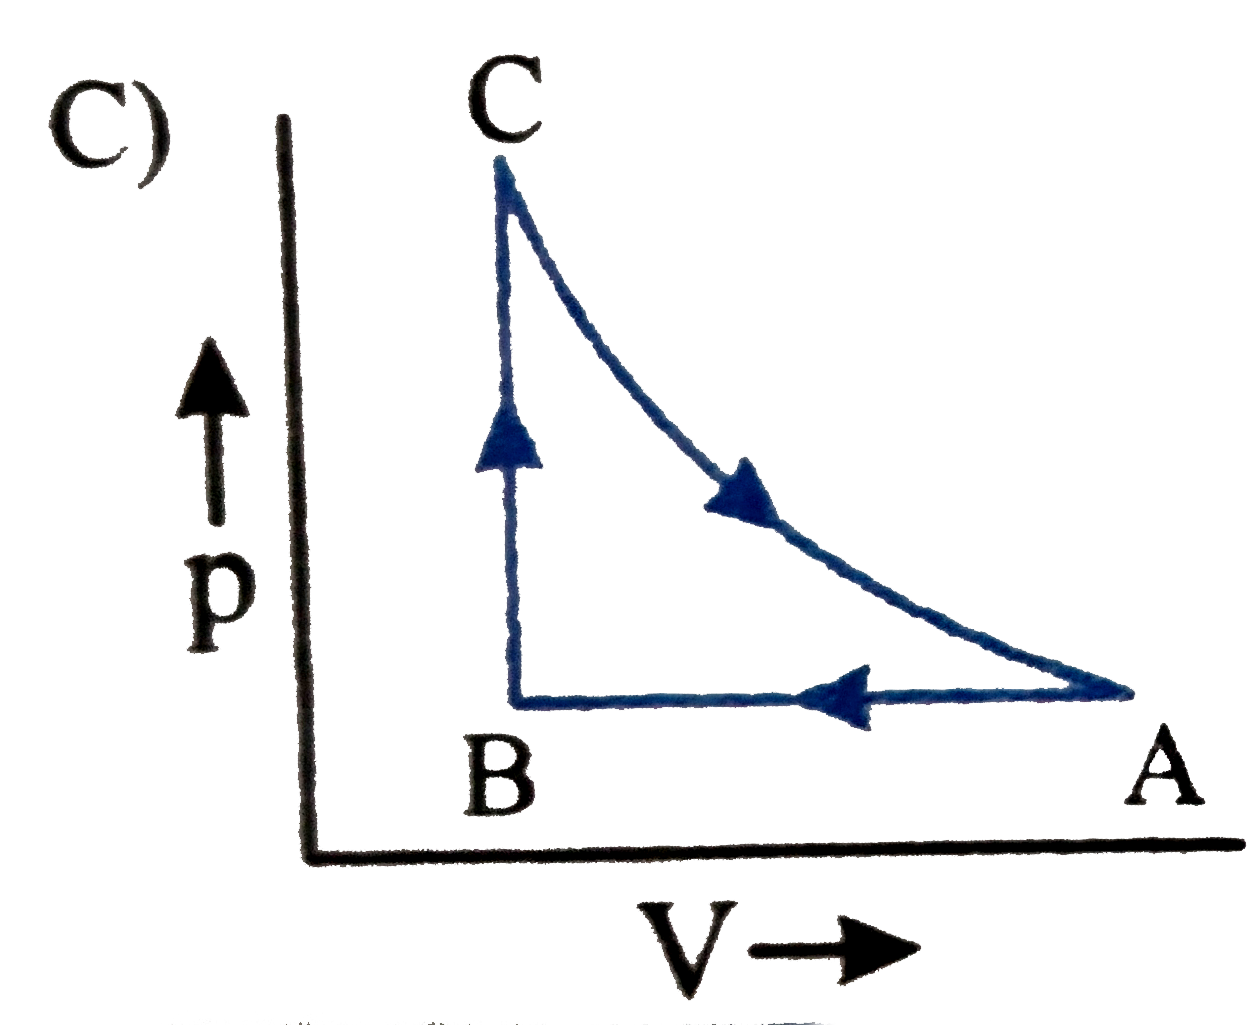 D
D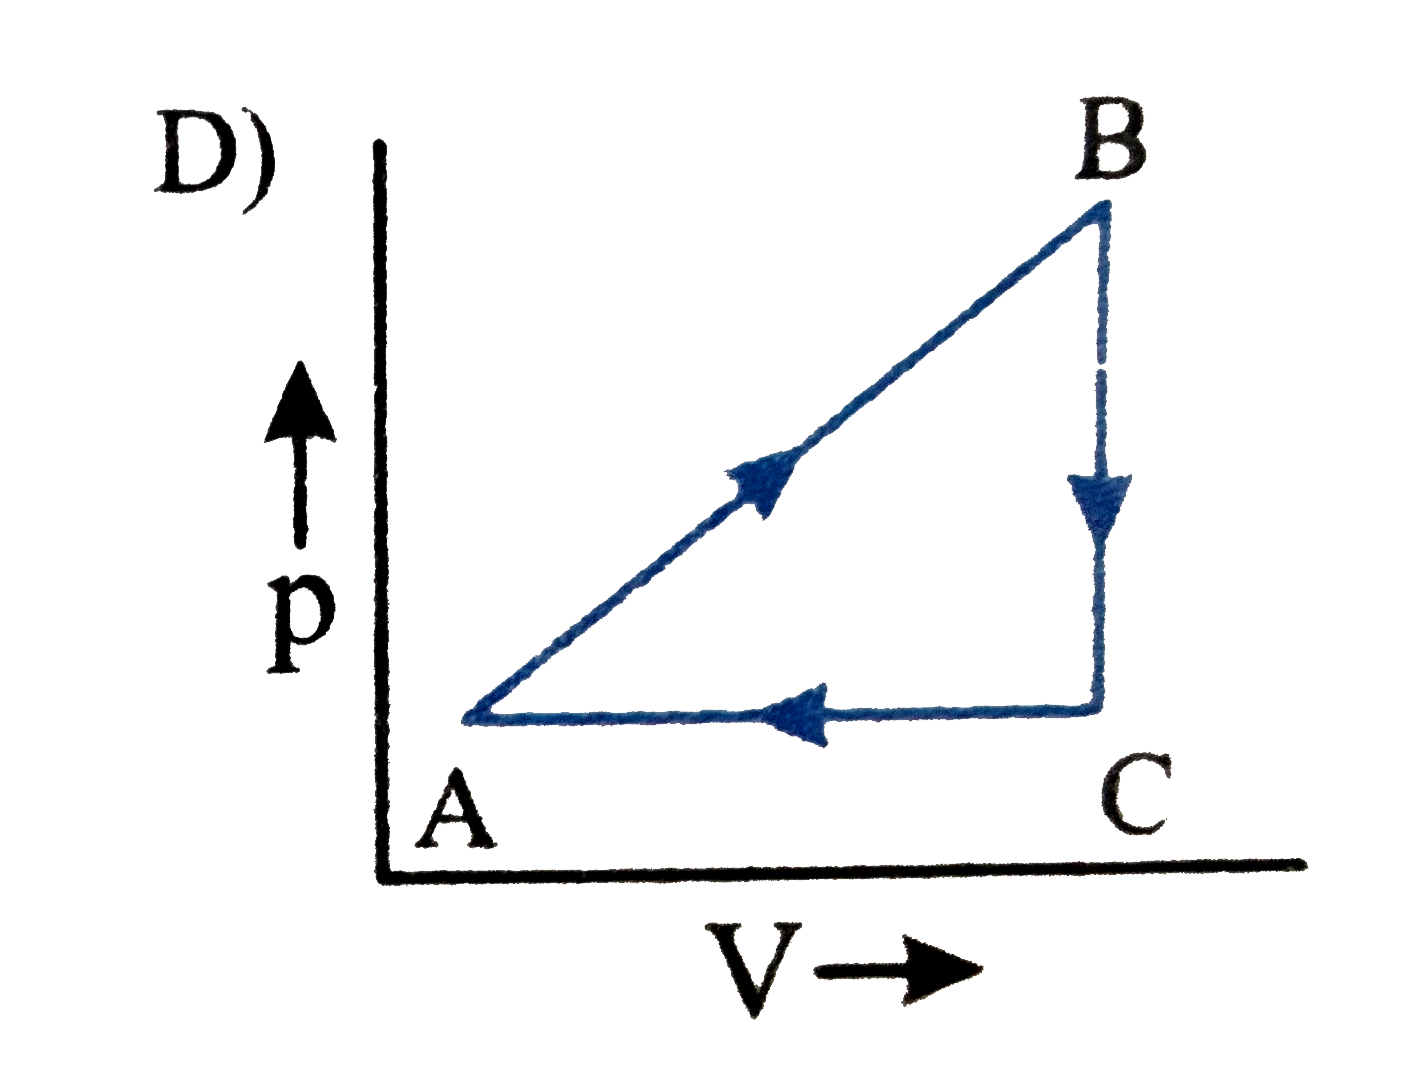
A cyclic process is shown in the P−T diagram.
Which of the curve shows the same process on a V−T diagram?A B
B C
C D
D
A cyclic process is shown on the P-T diagram. Which of the curve shown the same process on a V-T diagram?
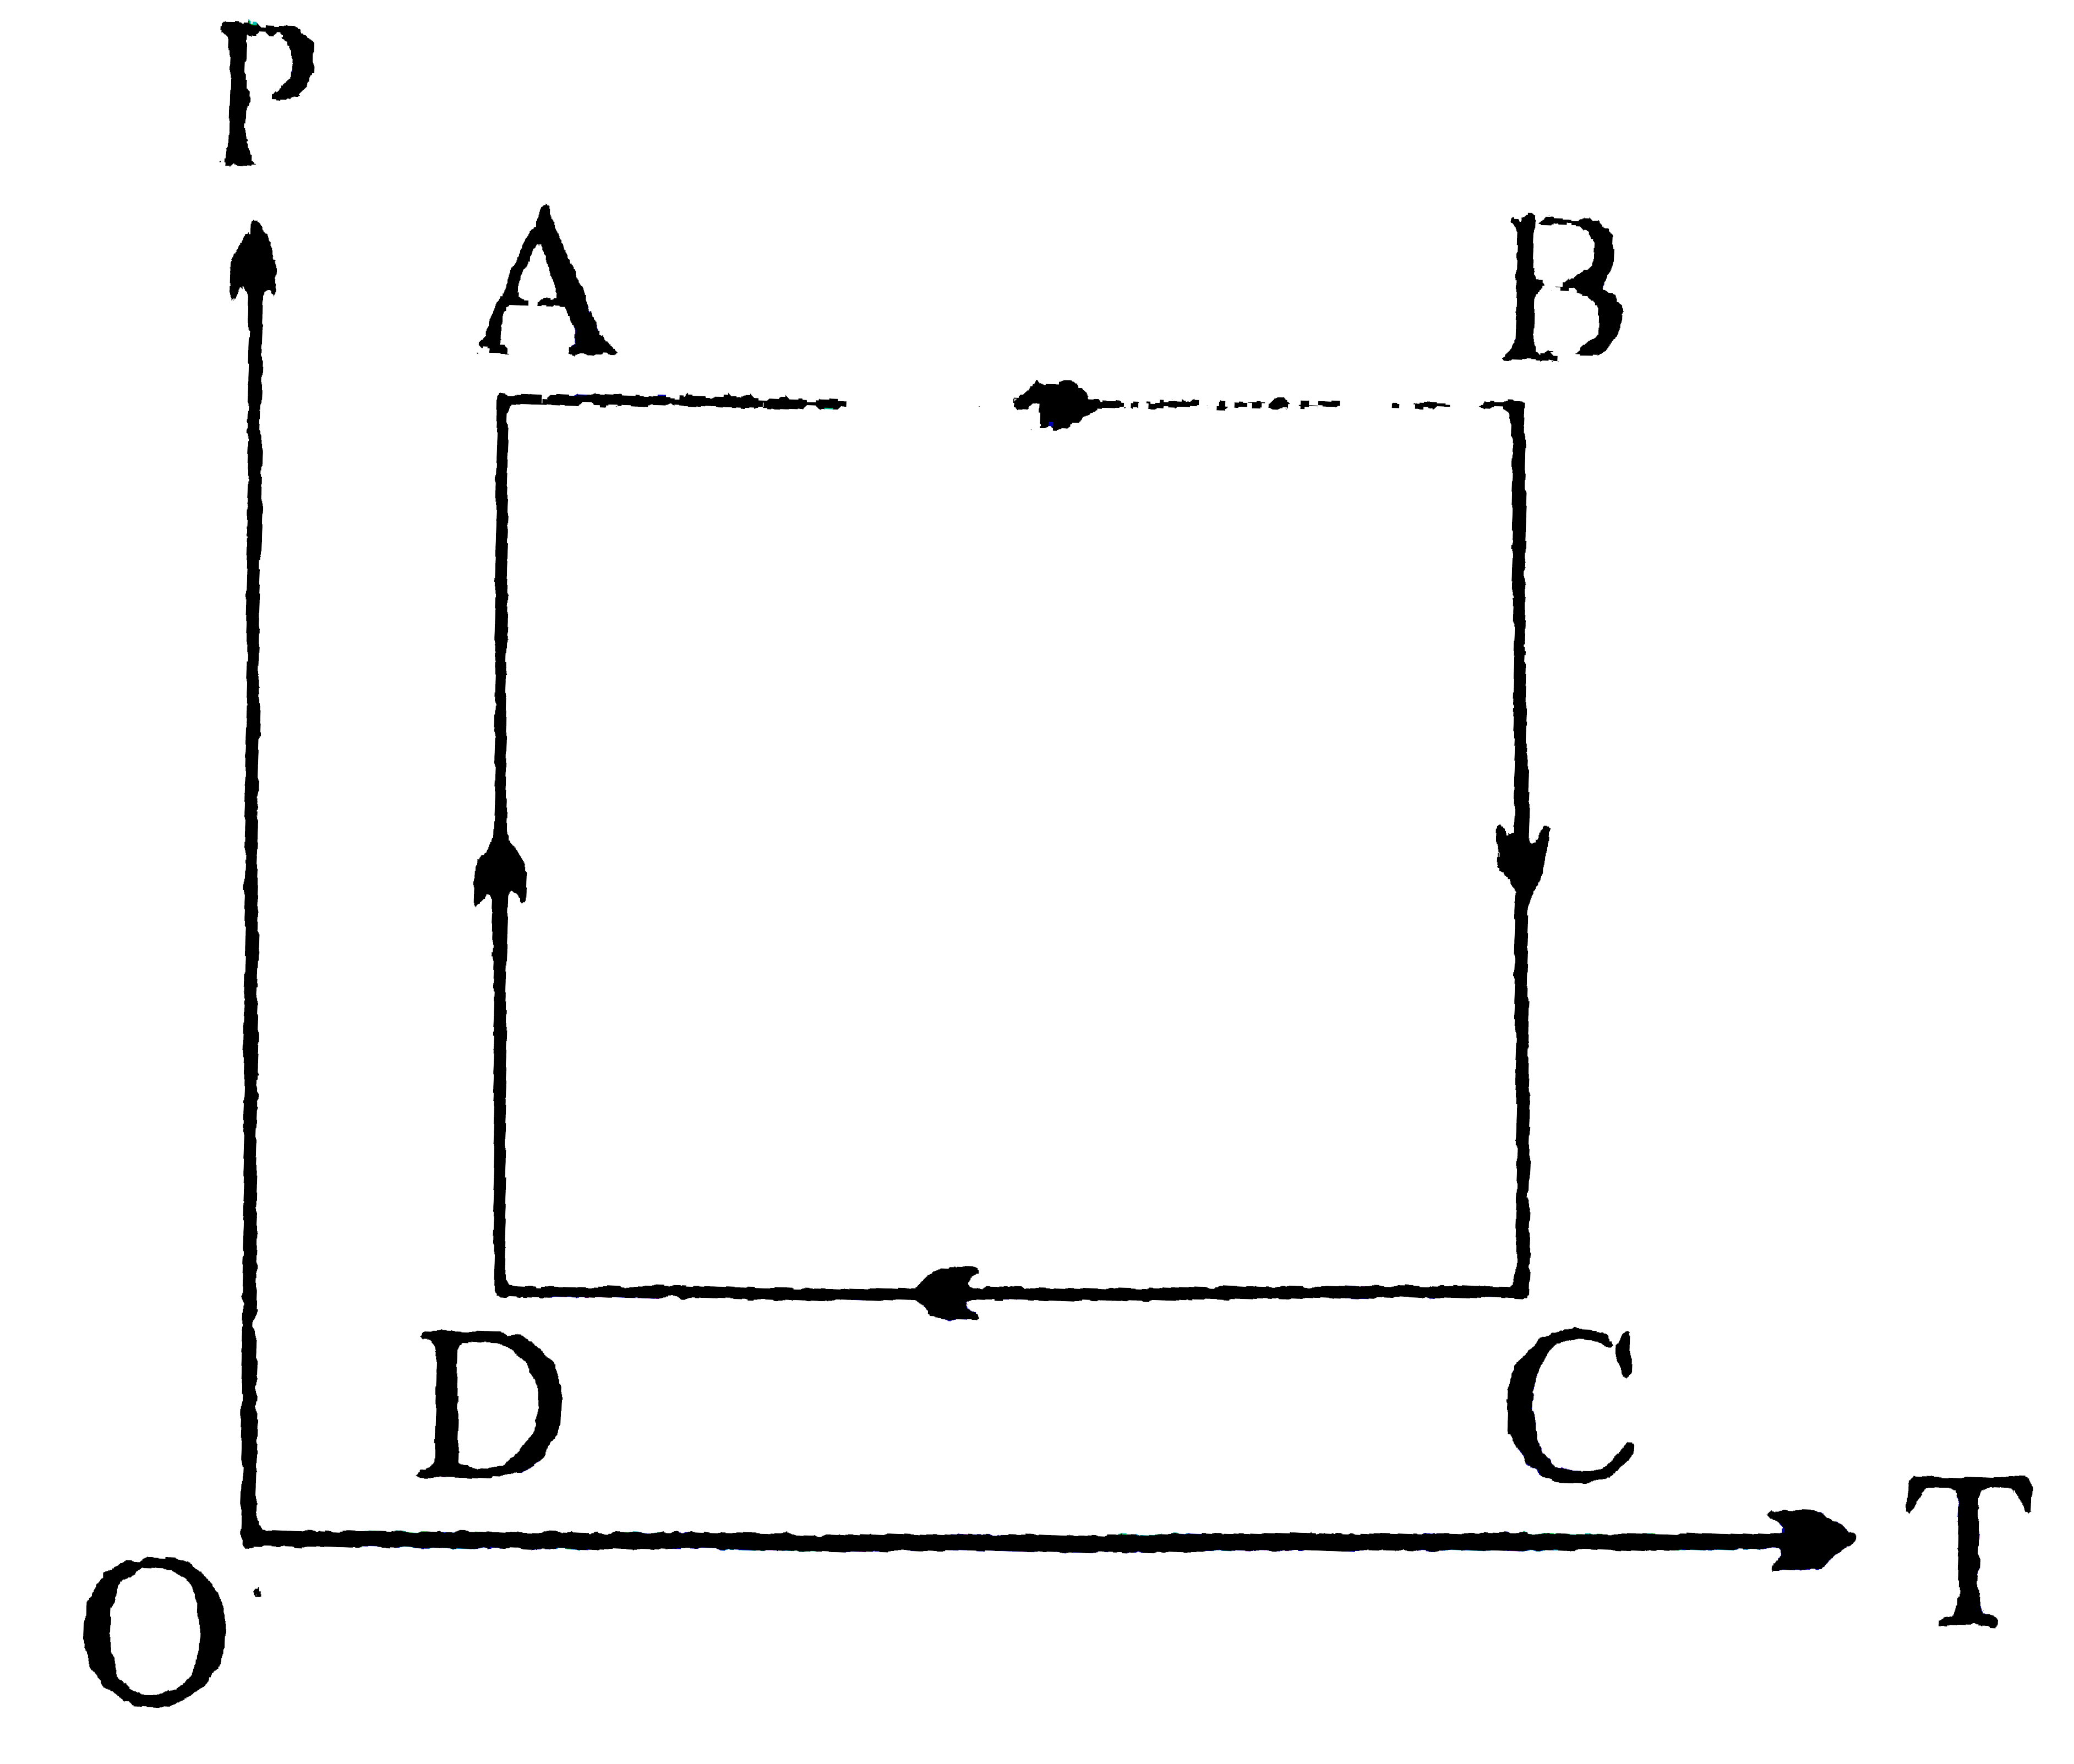 A
A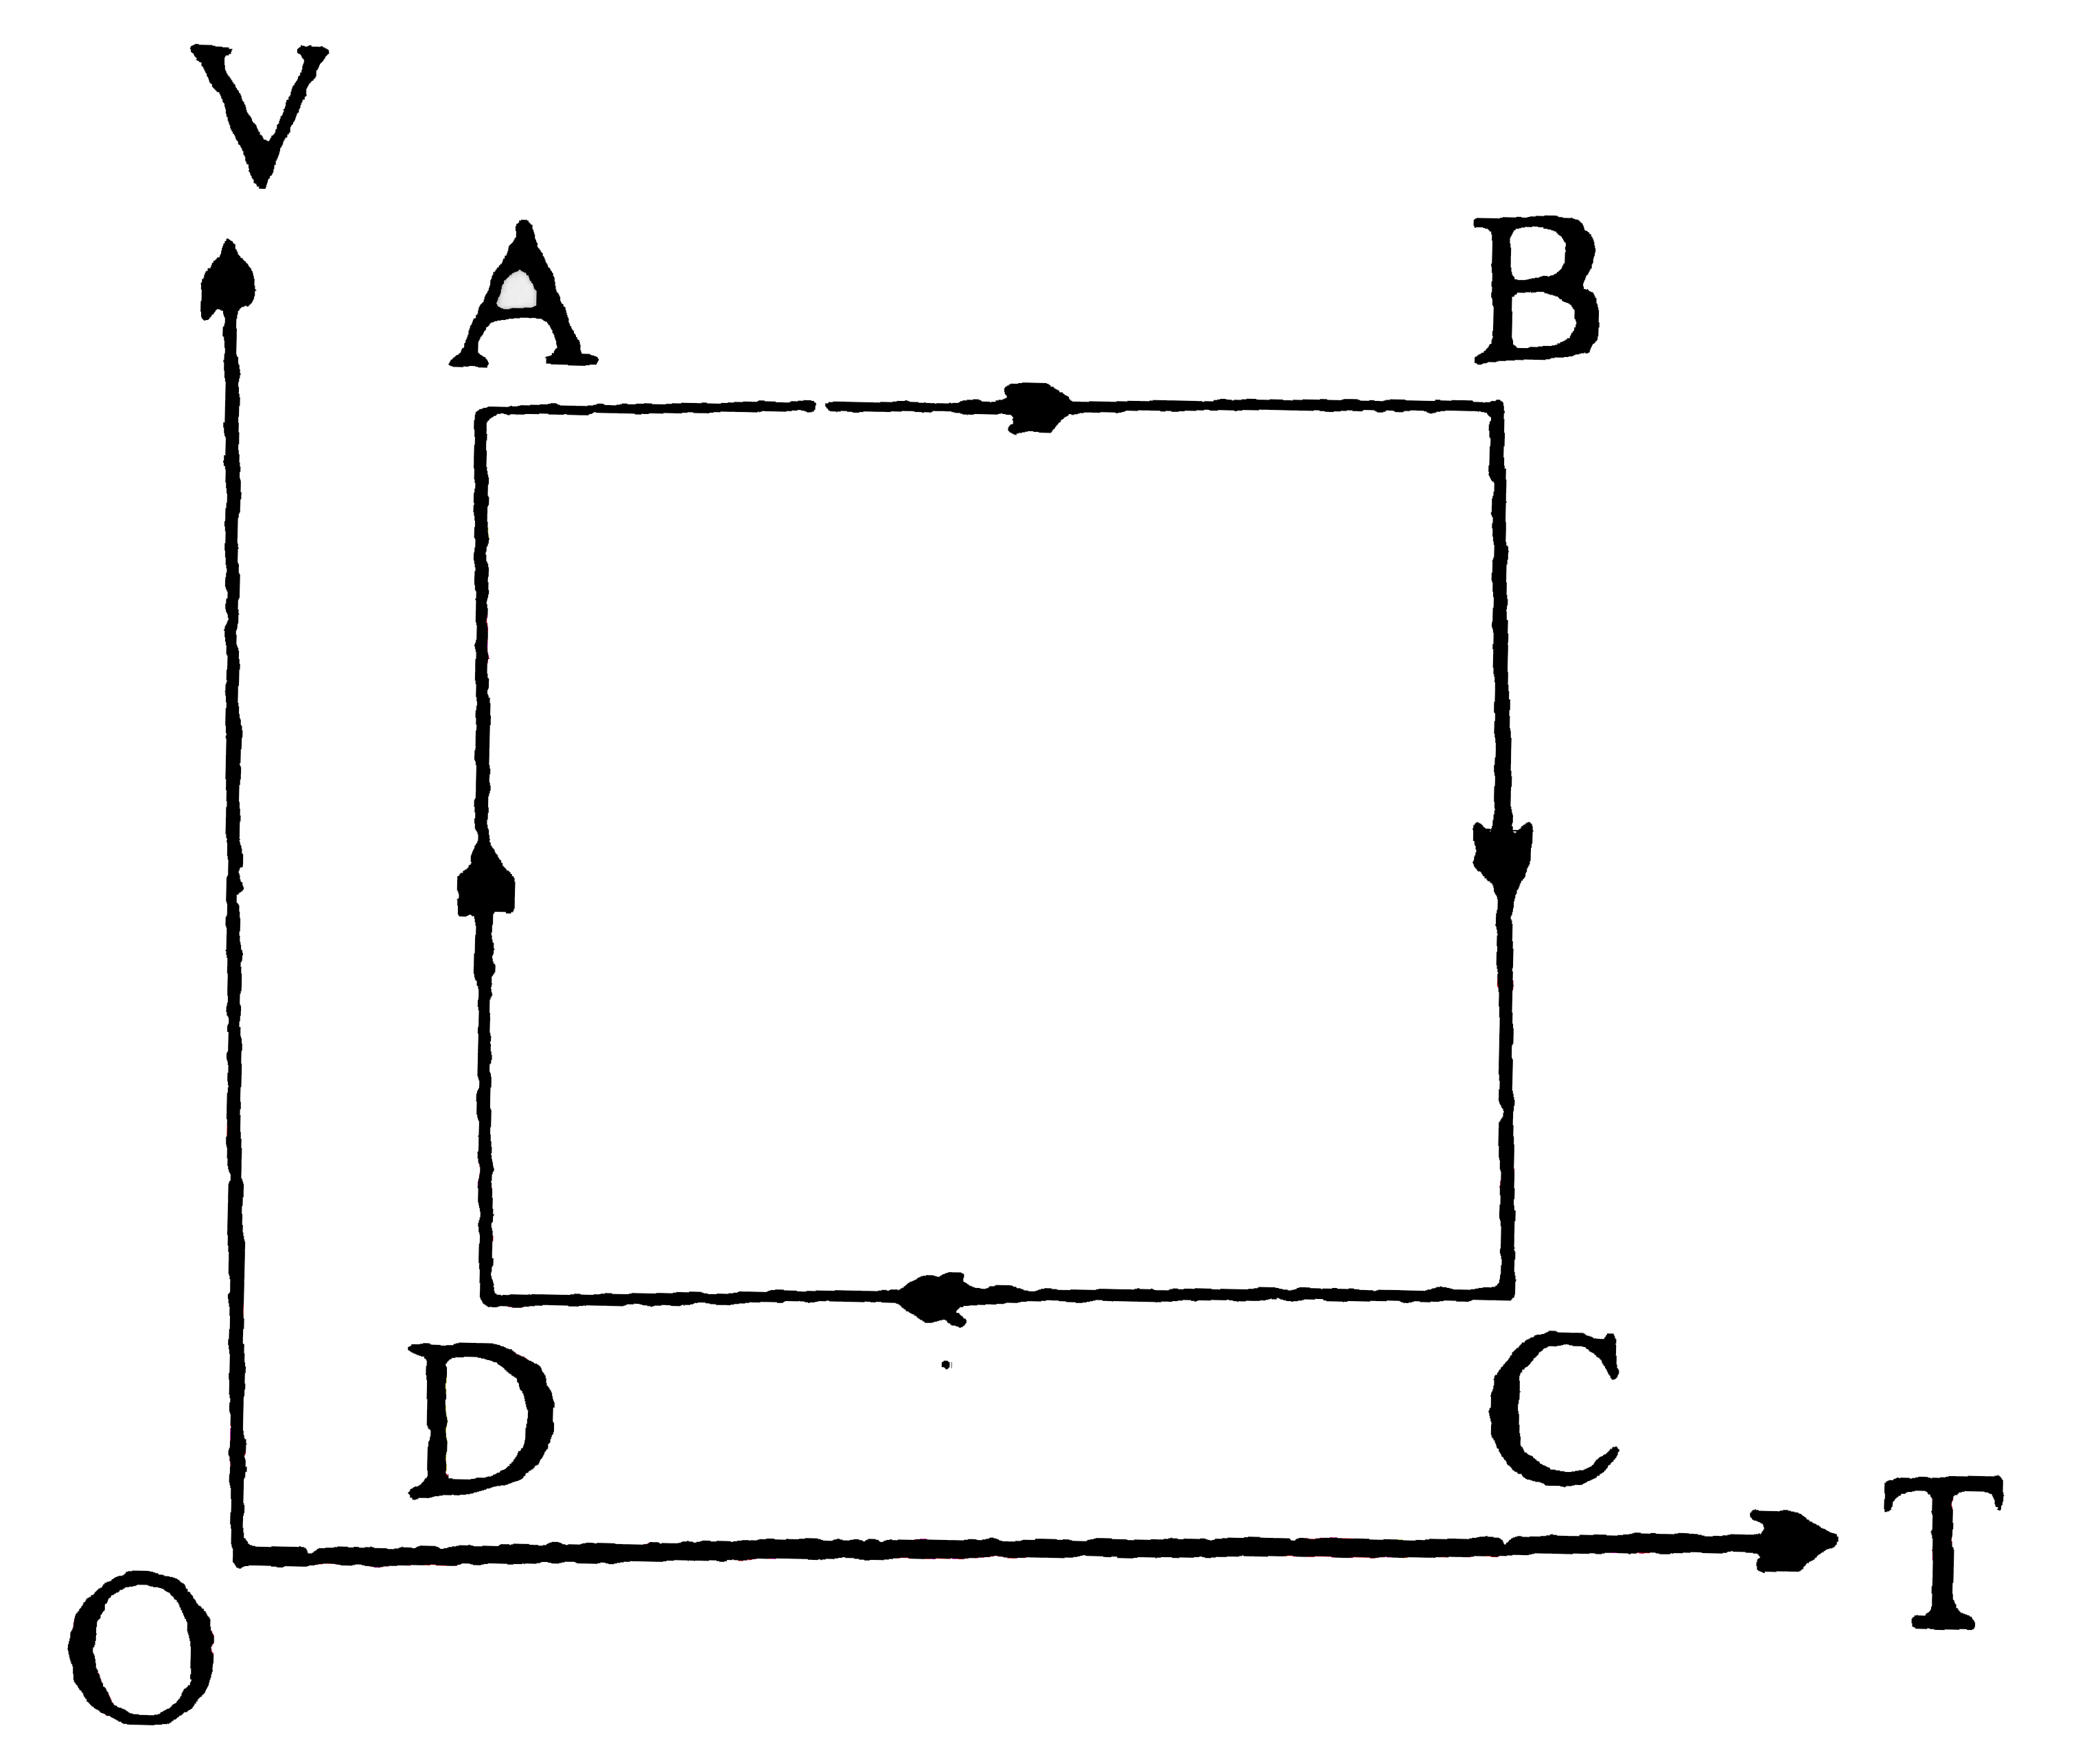 B
B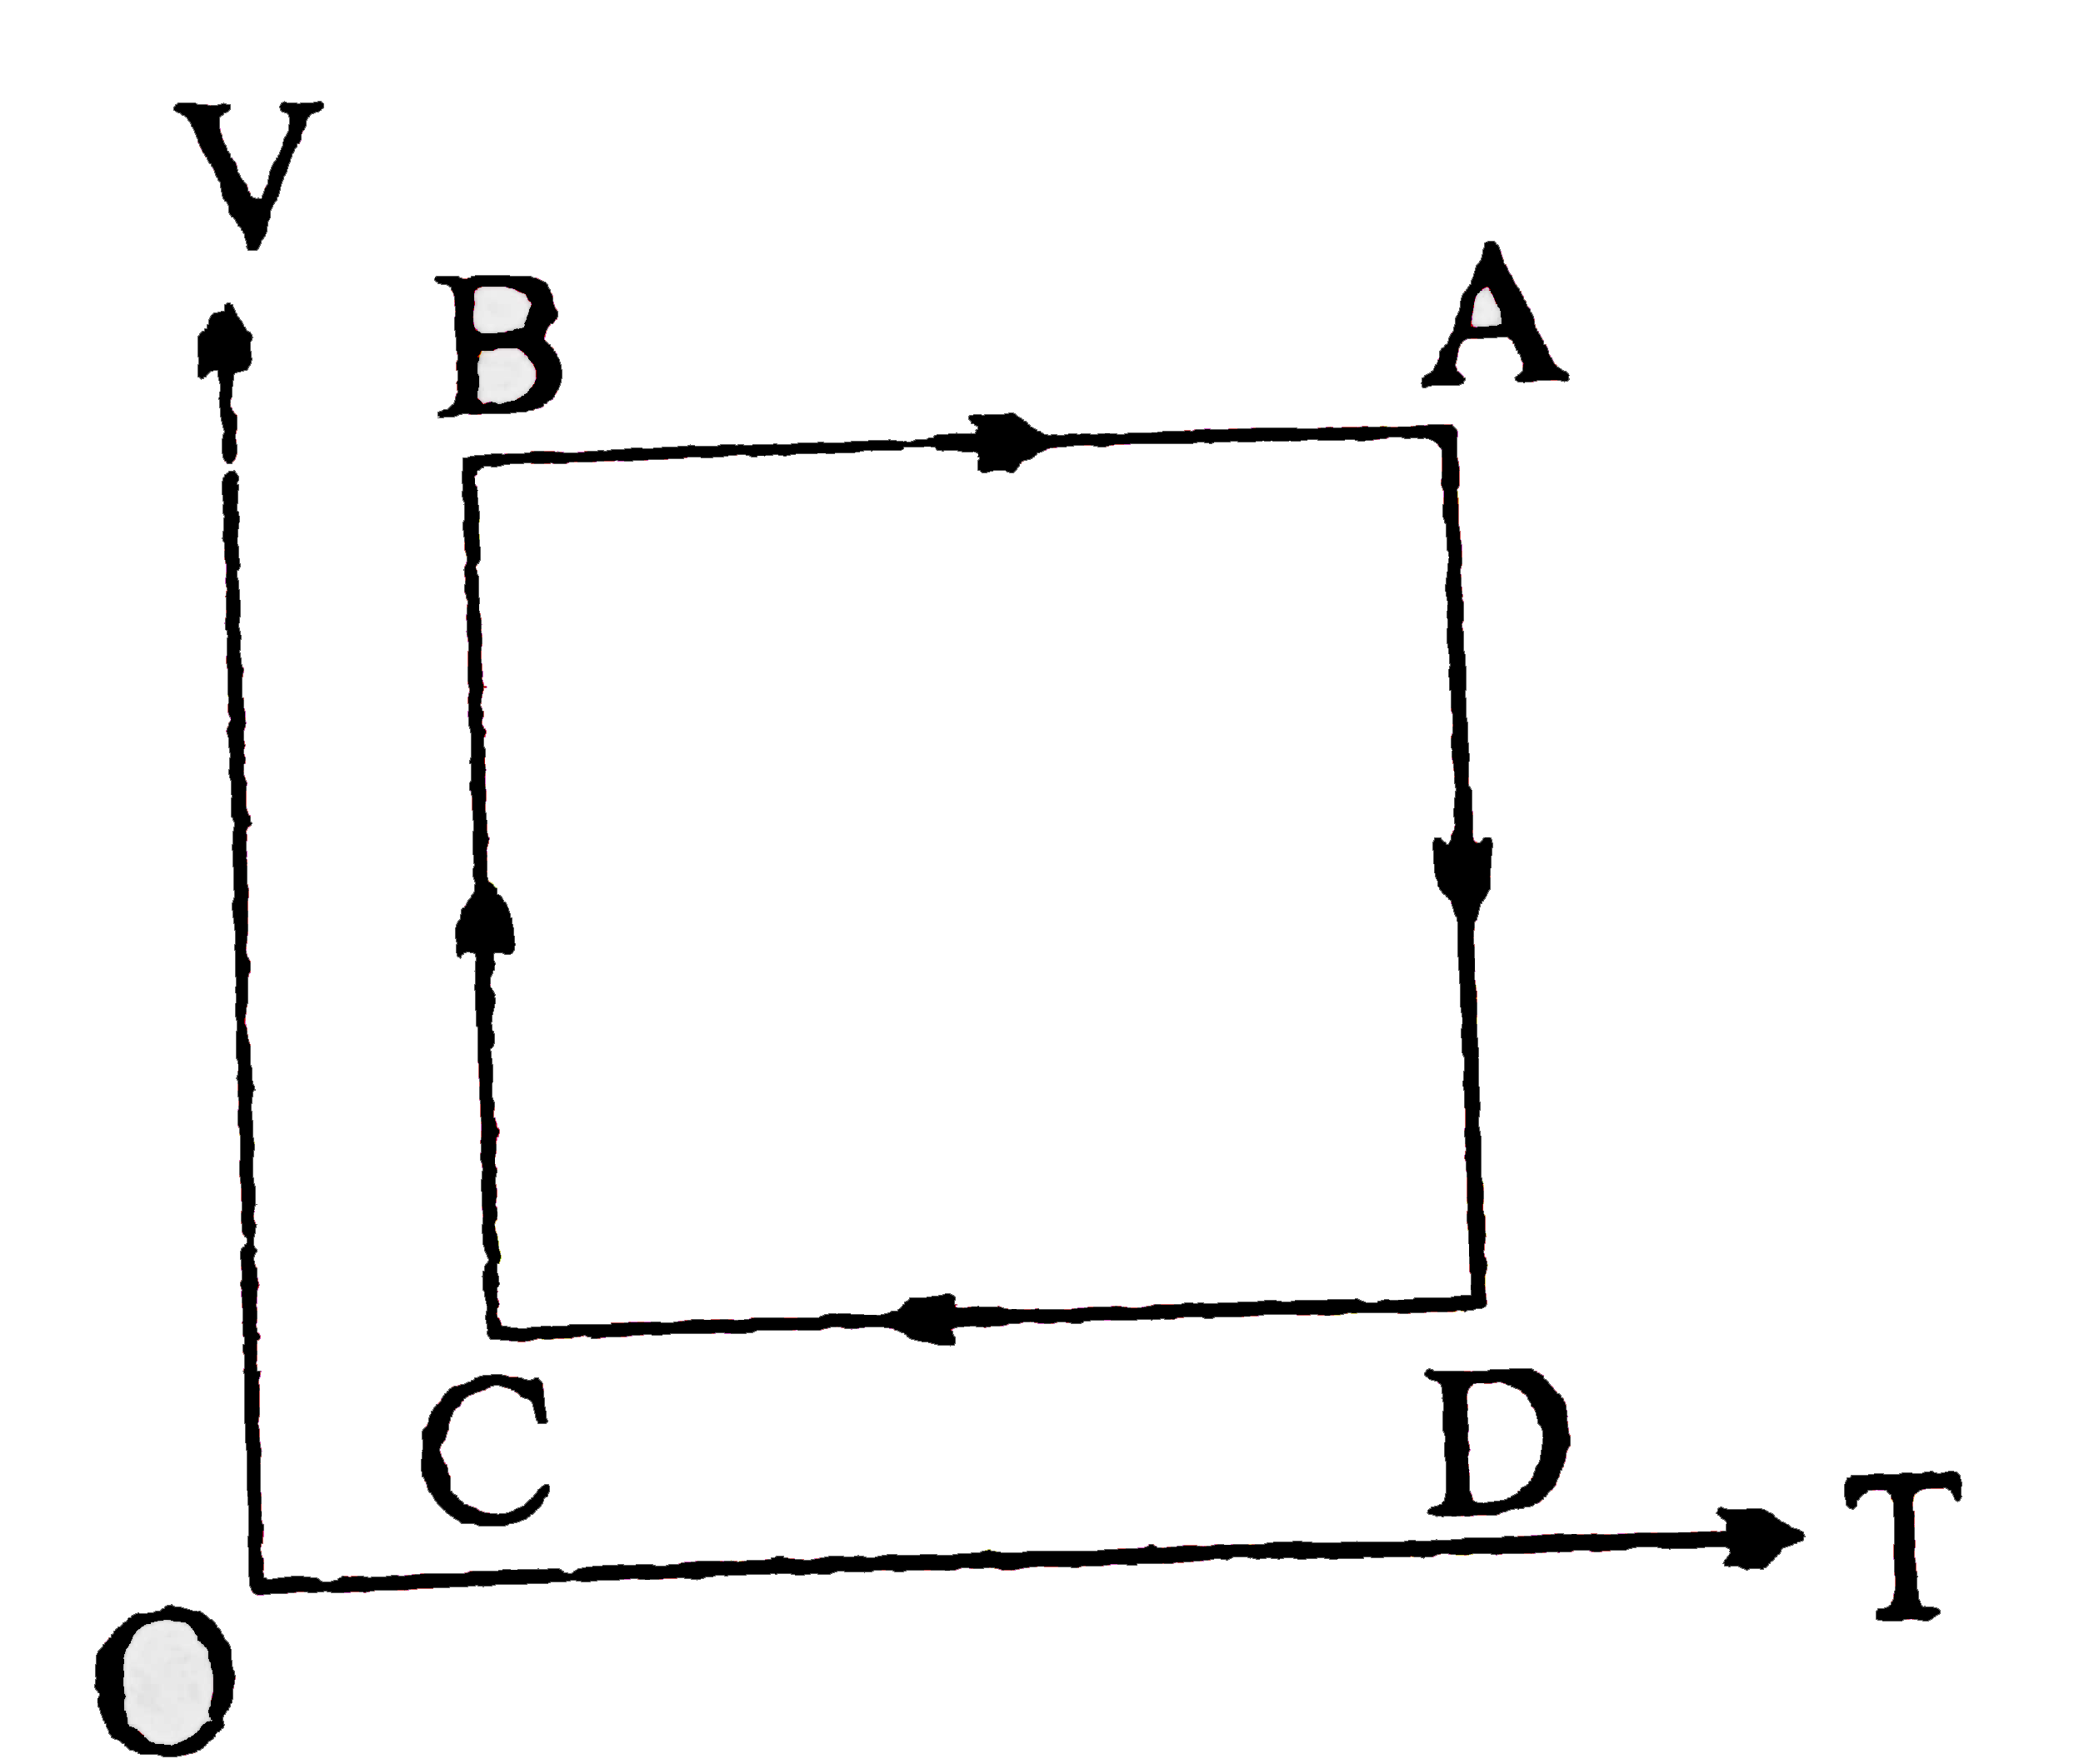 C
C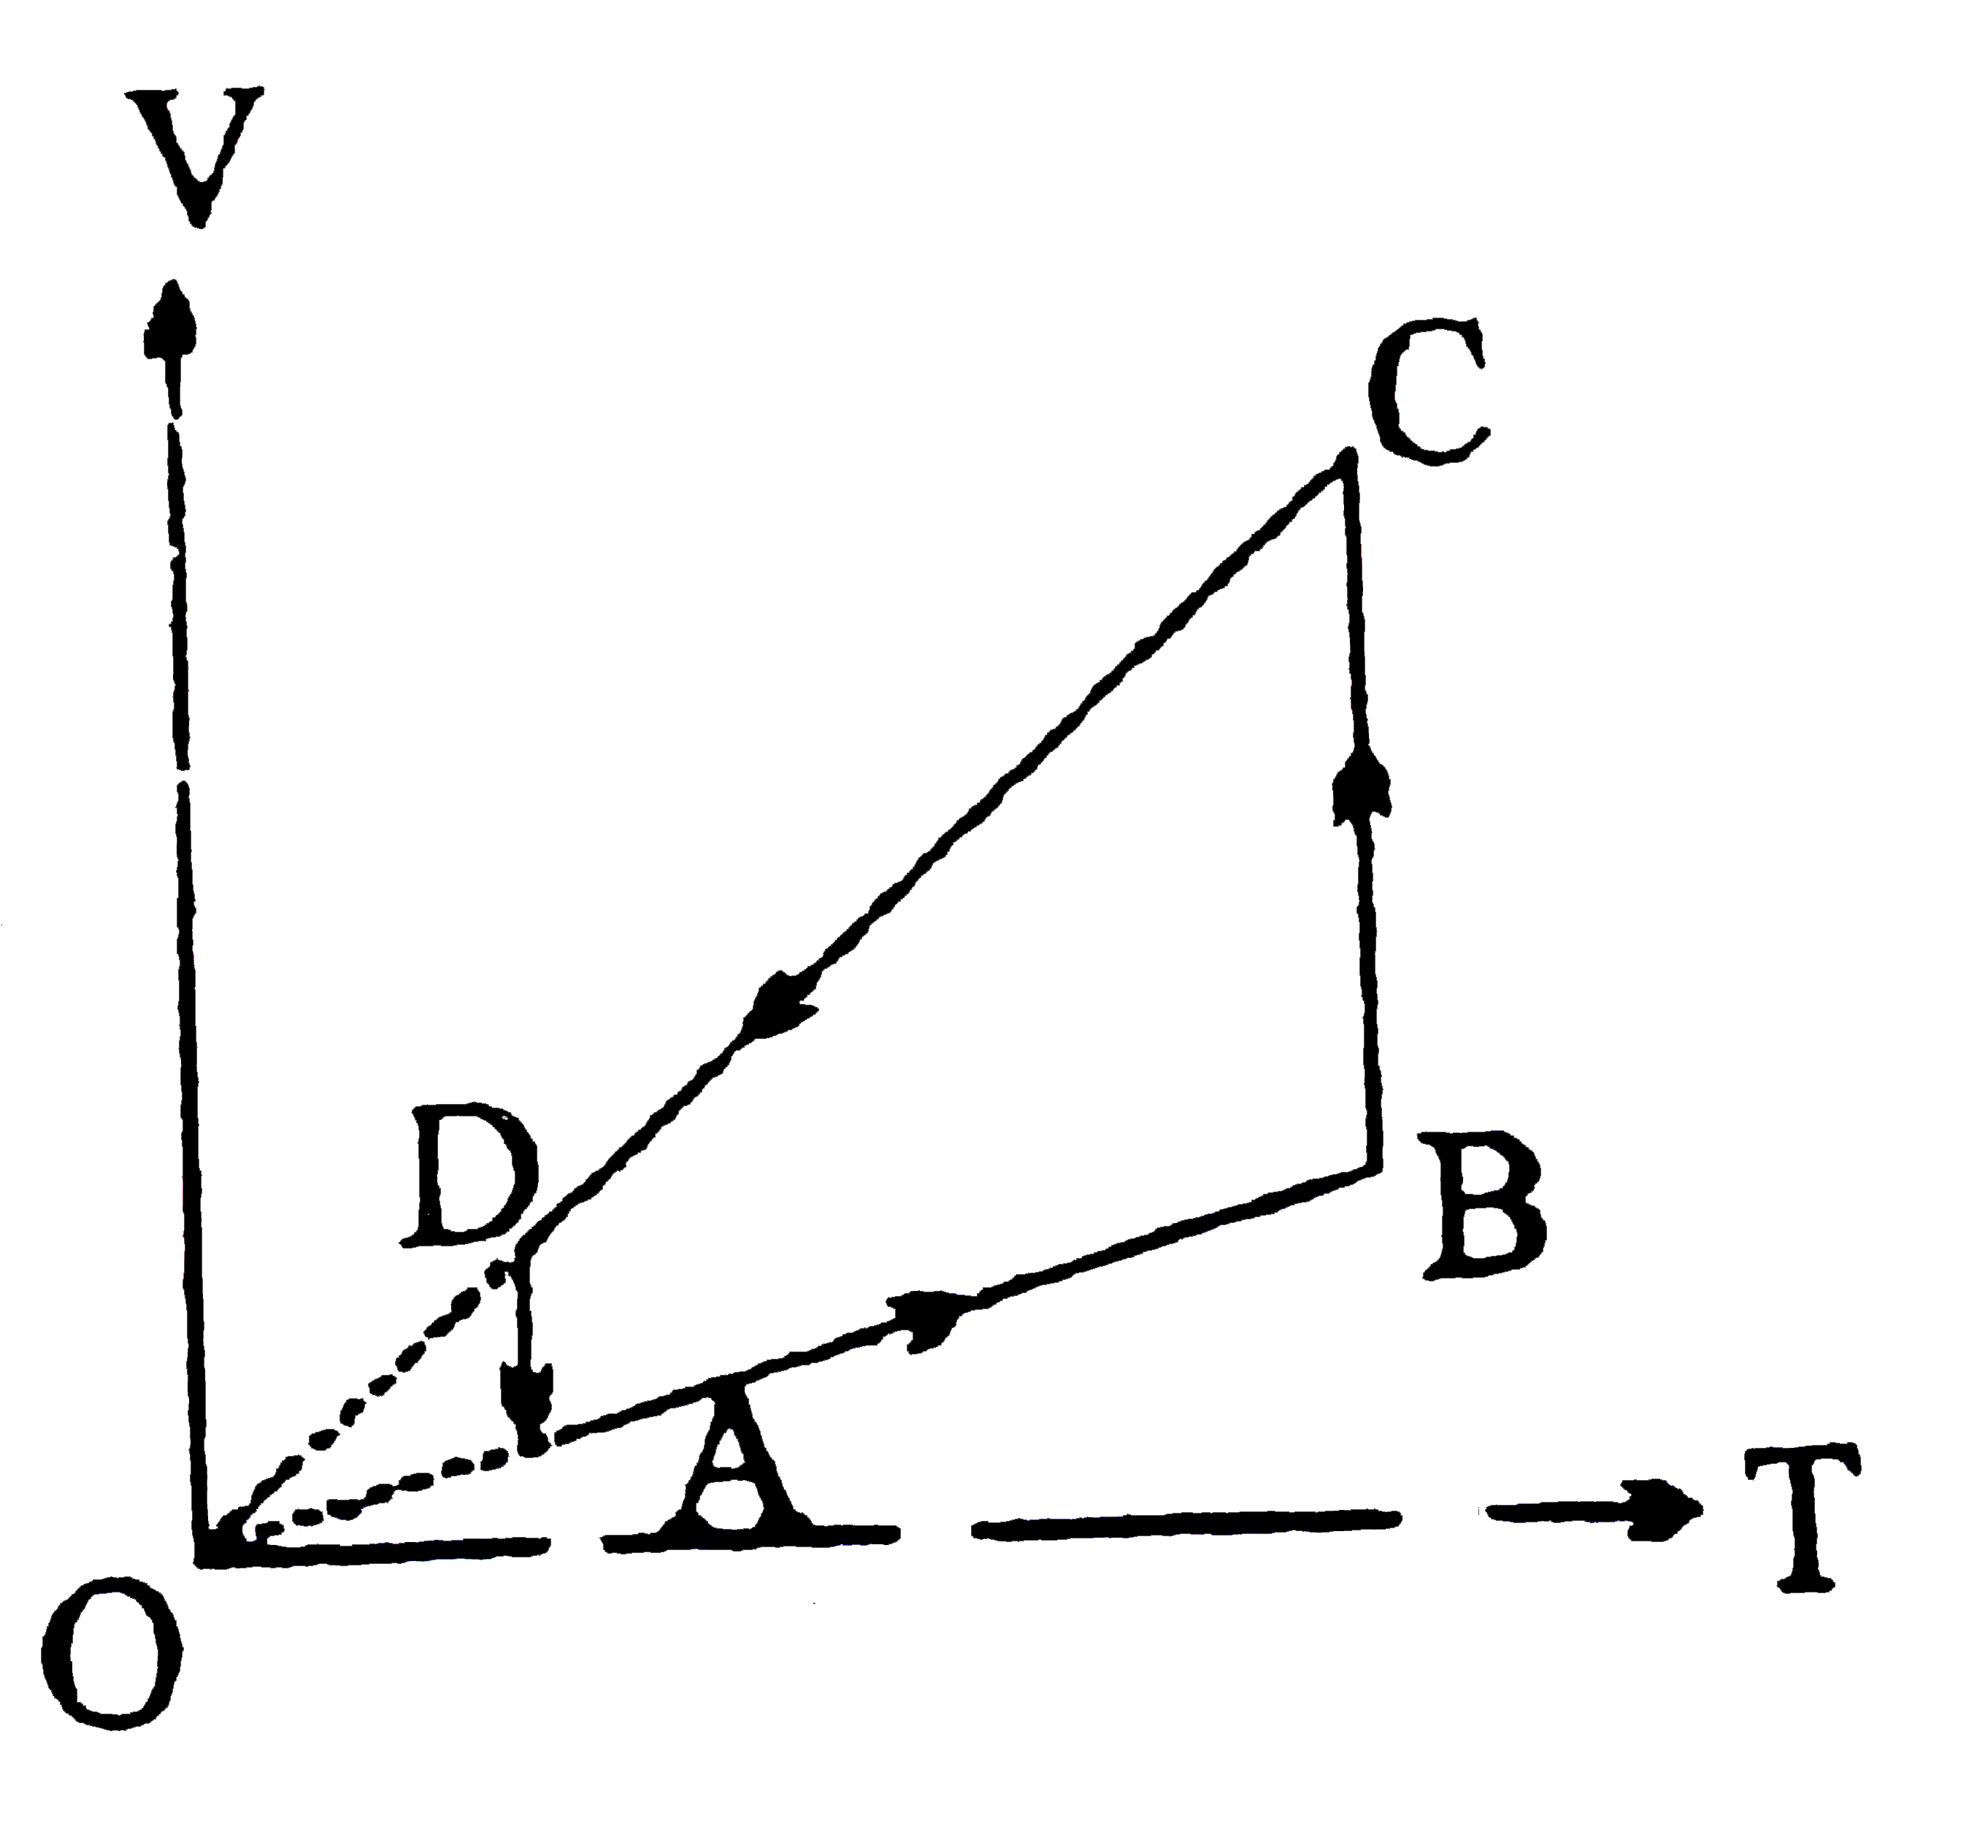 D
D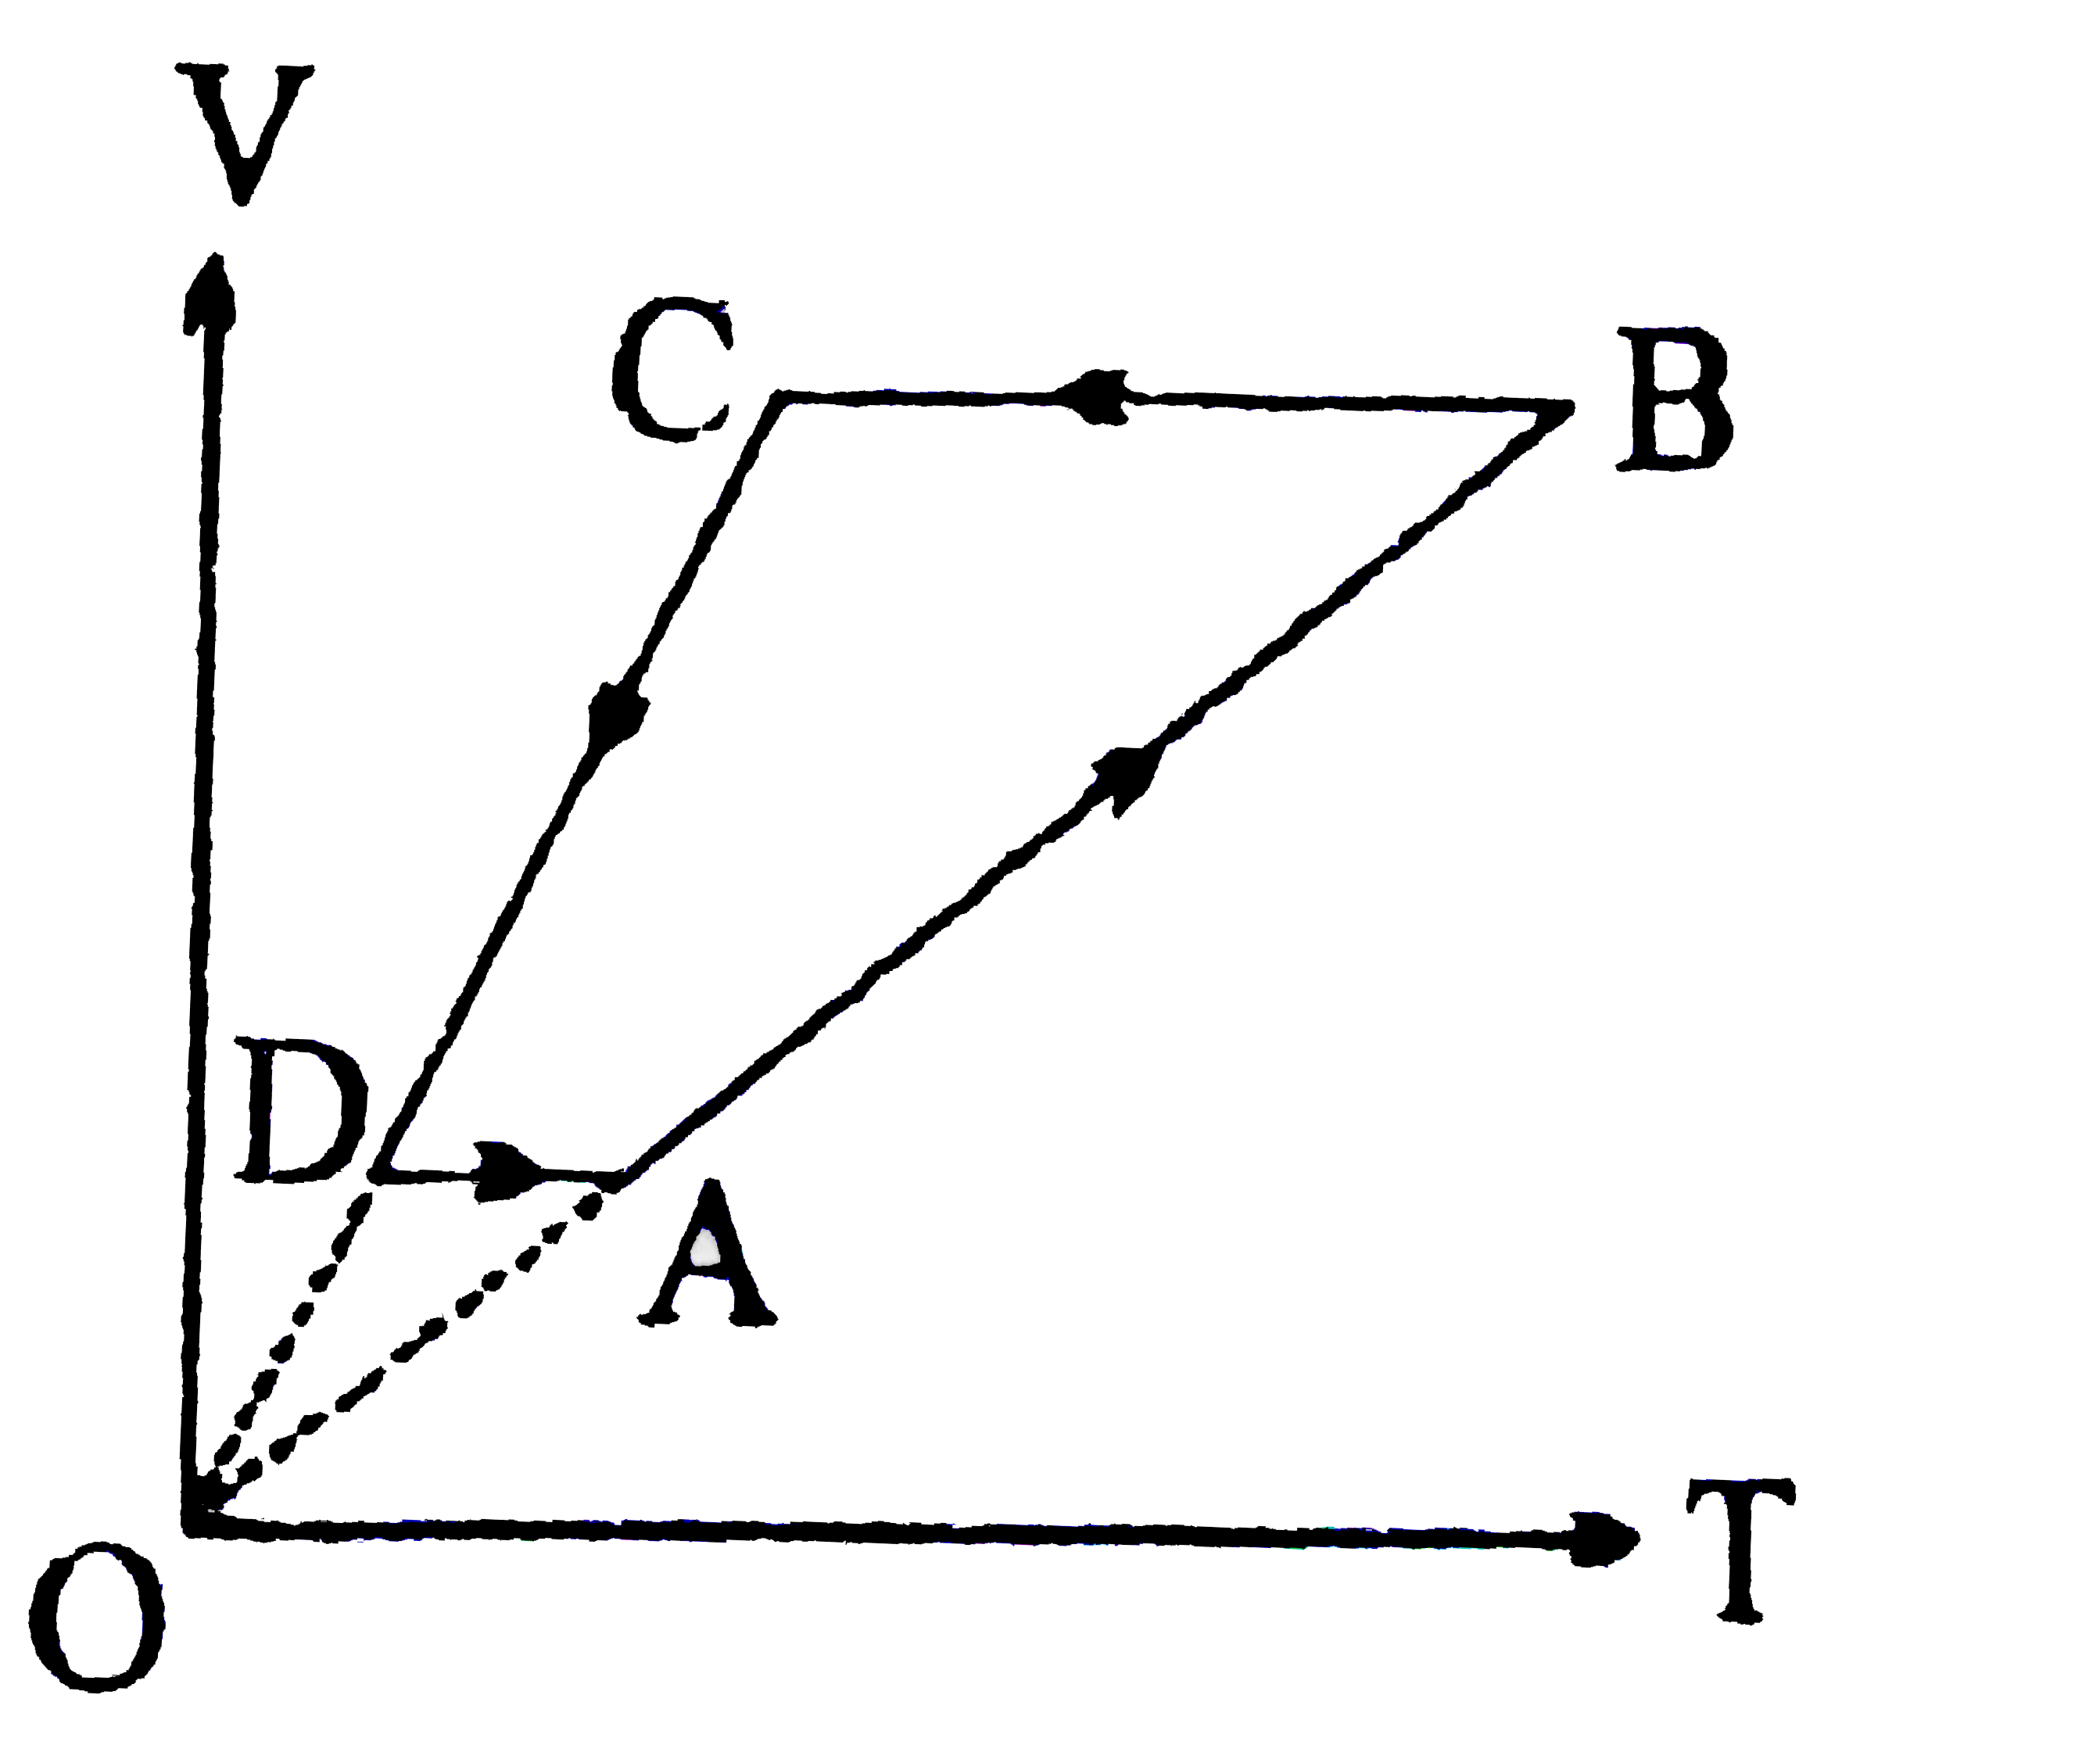
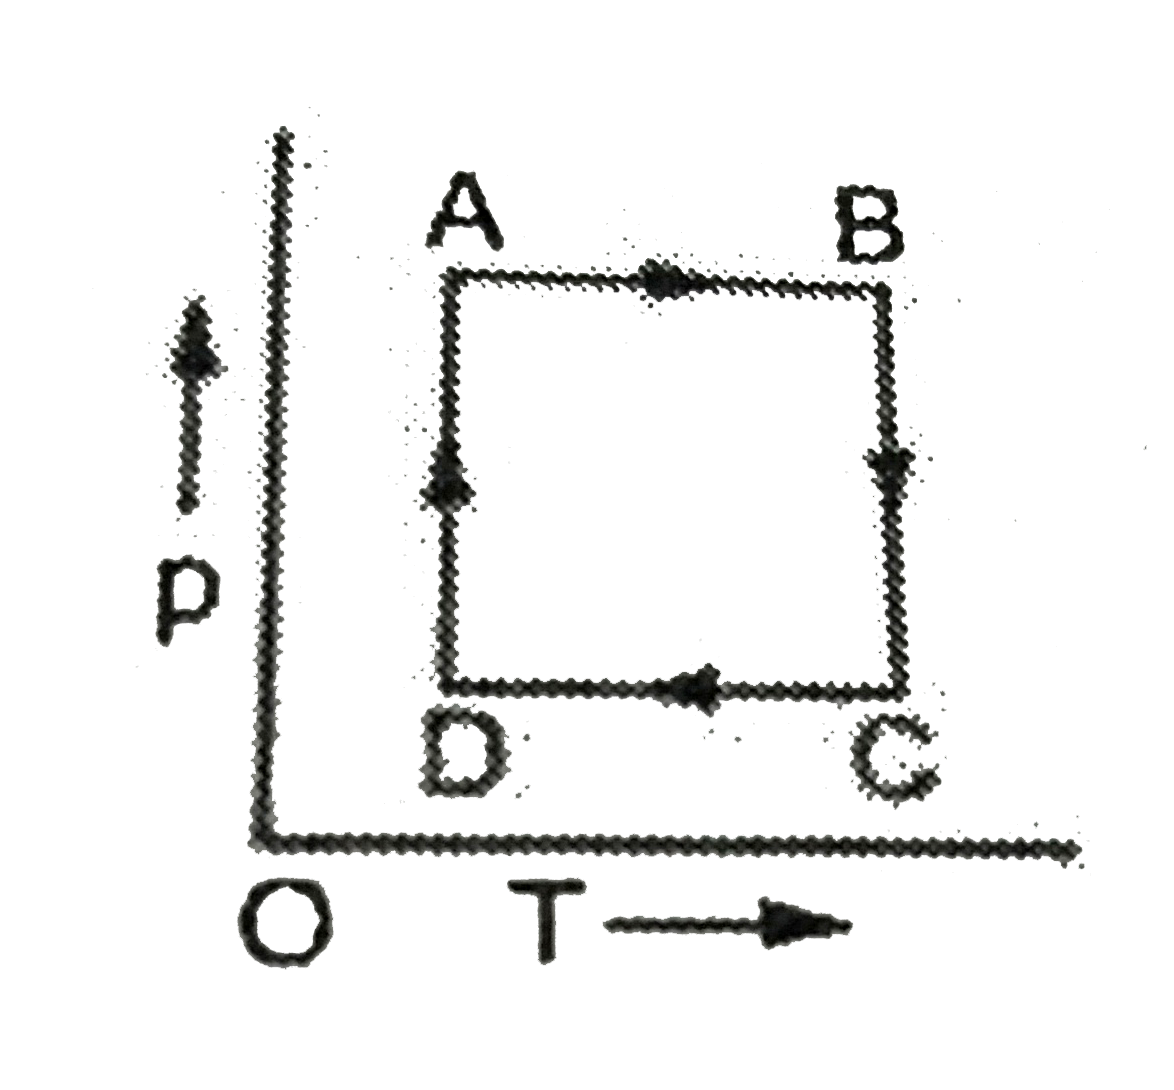
A cyclic process is shown on the p-T diagram . Which of the curves show the same process on a V-T diagram?
View SolutionA cyclic process is shown in the p – T diagram . Which of the following curves shows the same process on the p – V diagram ?
View Solution
A cyclic process ABCD is shown in the p-V diagram. Which of the following curves represent the same process?
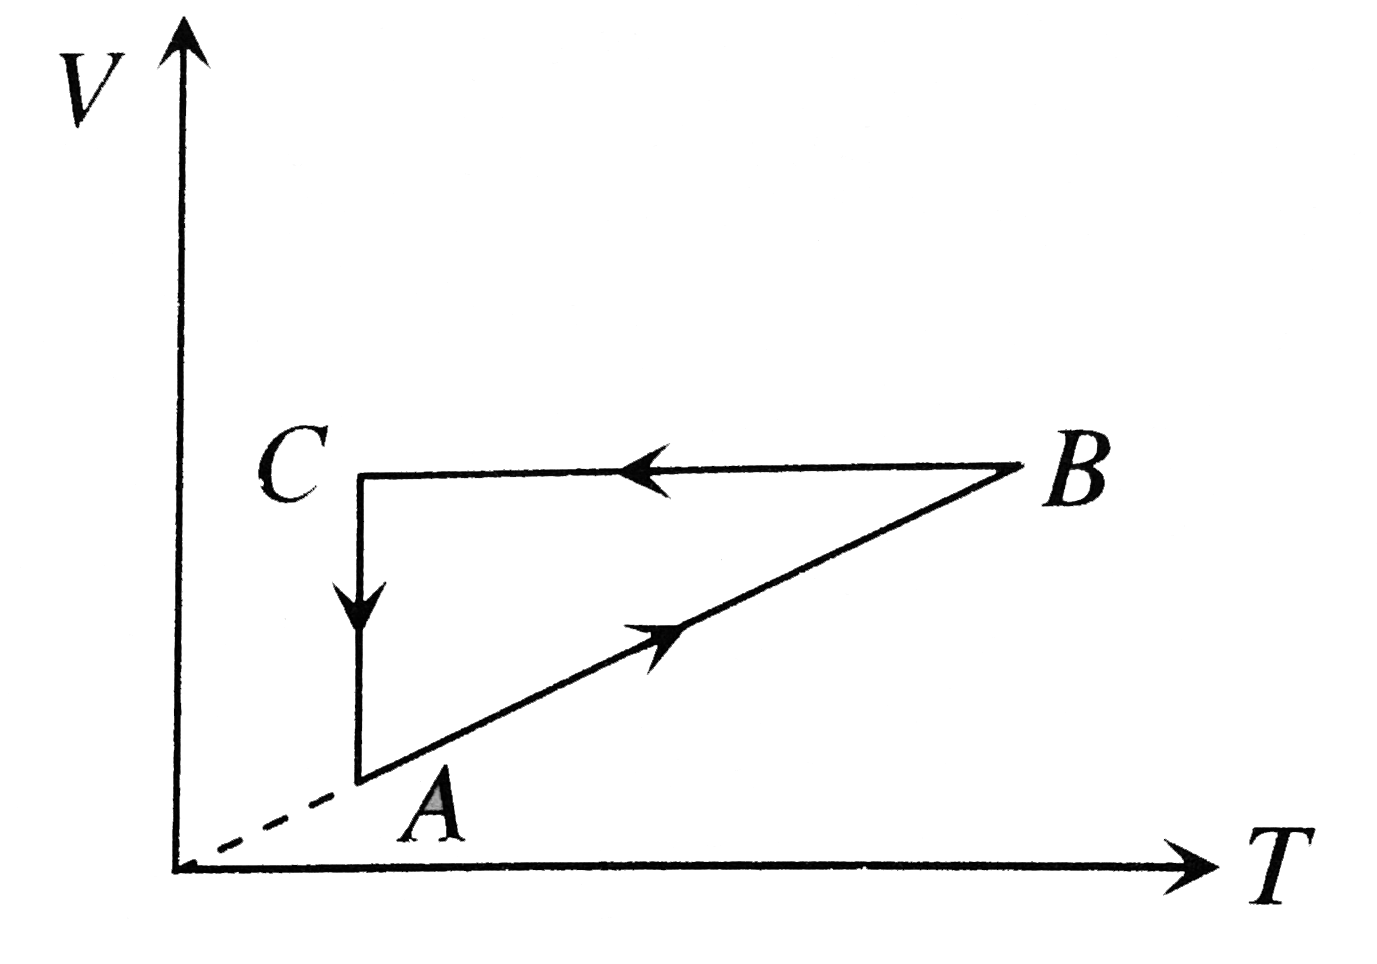
View SolutionA cyclic process ABCA is shown in the V−T diagram process on the P−V
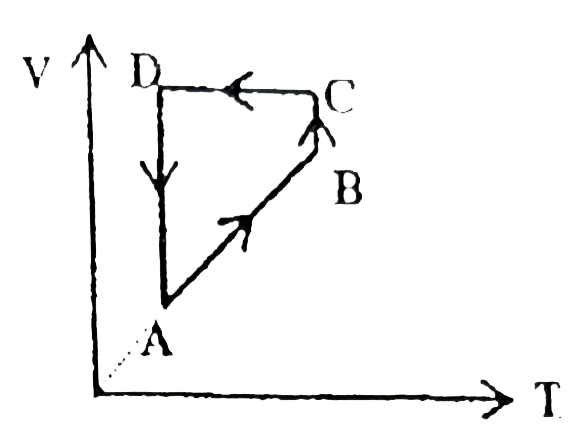
View SolutionA cyclic process ABCD is shown in the V−T diagram. Which of the following curves represent the same process ?
View Solution

