A graph of force against extension of a wire is plotted. The area under the curve is
A
energy density
B
work done during extension
C
the elastic constant
D
coefficient of elasticity
Video Solution
Text Solution
The correct Answer is:B
|
Answer
Step by step video, text & image solution for A graph of force against extension of a wire is plotted. The area under the curve is by Physics experts to help you in doubts & scoring excellent marks in Class 12 exams.
Updated on:21/07/2023Topper's Solved these Questions
- ELASTICITYBOOK - TARGET PUBLICATIONCHAPTER - ELASTICITYEXERCISE - Critical Thinking
54 Videos
- ELASTICITYBOOK - TARGET PUBLICATIONCHAPTER - ELASTICITYEXERCISE - Competitive Thinking
69 Videos
- CURRENT ELECTRICITY BOOK - TARGET PUBLICATIONCHAPTER - CURRENT ELECTRICITY EXERCISE - Evaluation Test
6 Videos
- ELECTROMAGNETIC INDUCTIONBOOK - TARGET PUBLICATIONCHAPTER - ELECTROMAGNETIC INDUCTIONEXERCISE - EVALUATION TEST
8 Videos
Similar Questions
Knowledge Check
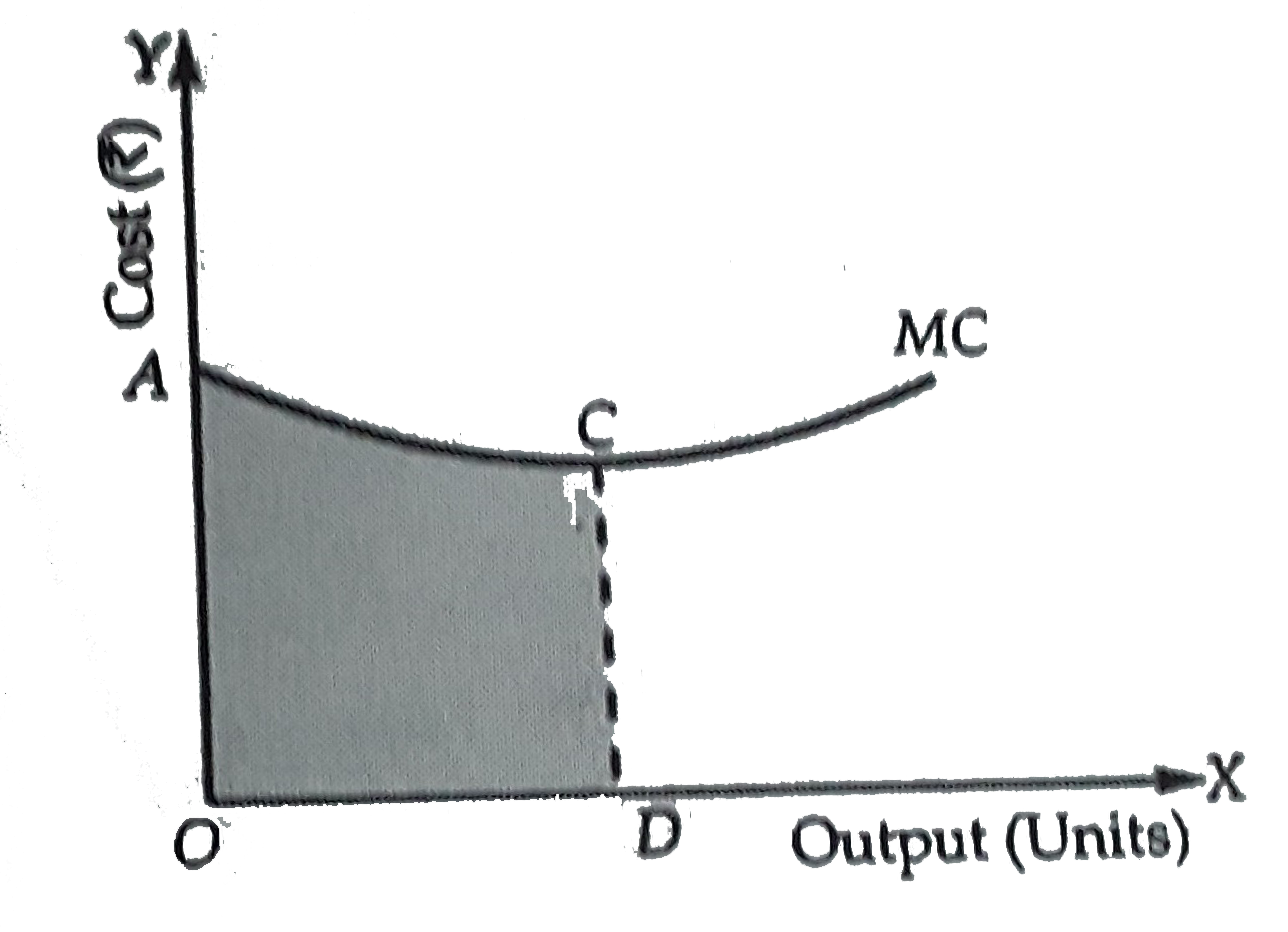
The area under the given curve is
 ATCBTVCCACDAVC
Area under power-time curve gives
Atotal work done on the bodyBtotal work done by the bodyCeither (a) or (b)Dneither (a) nor (b)Area under speed-time curve gives
AdistanceBvelocityCaccelerationDnone of these

