A graph of potential energy V(x) verses x is shown in figure. A particle of energy E0 is executing motion in it. Draw graph of velocity and kinetic energy versus x for one complete cycle AFA.
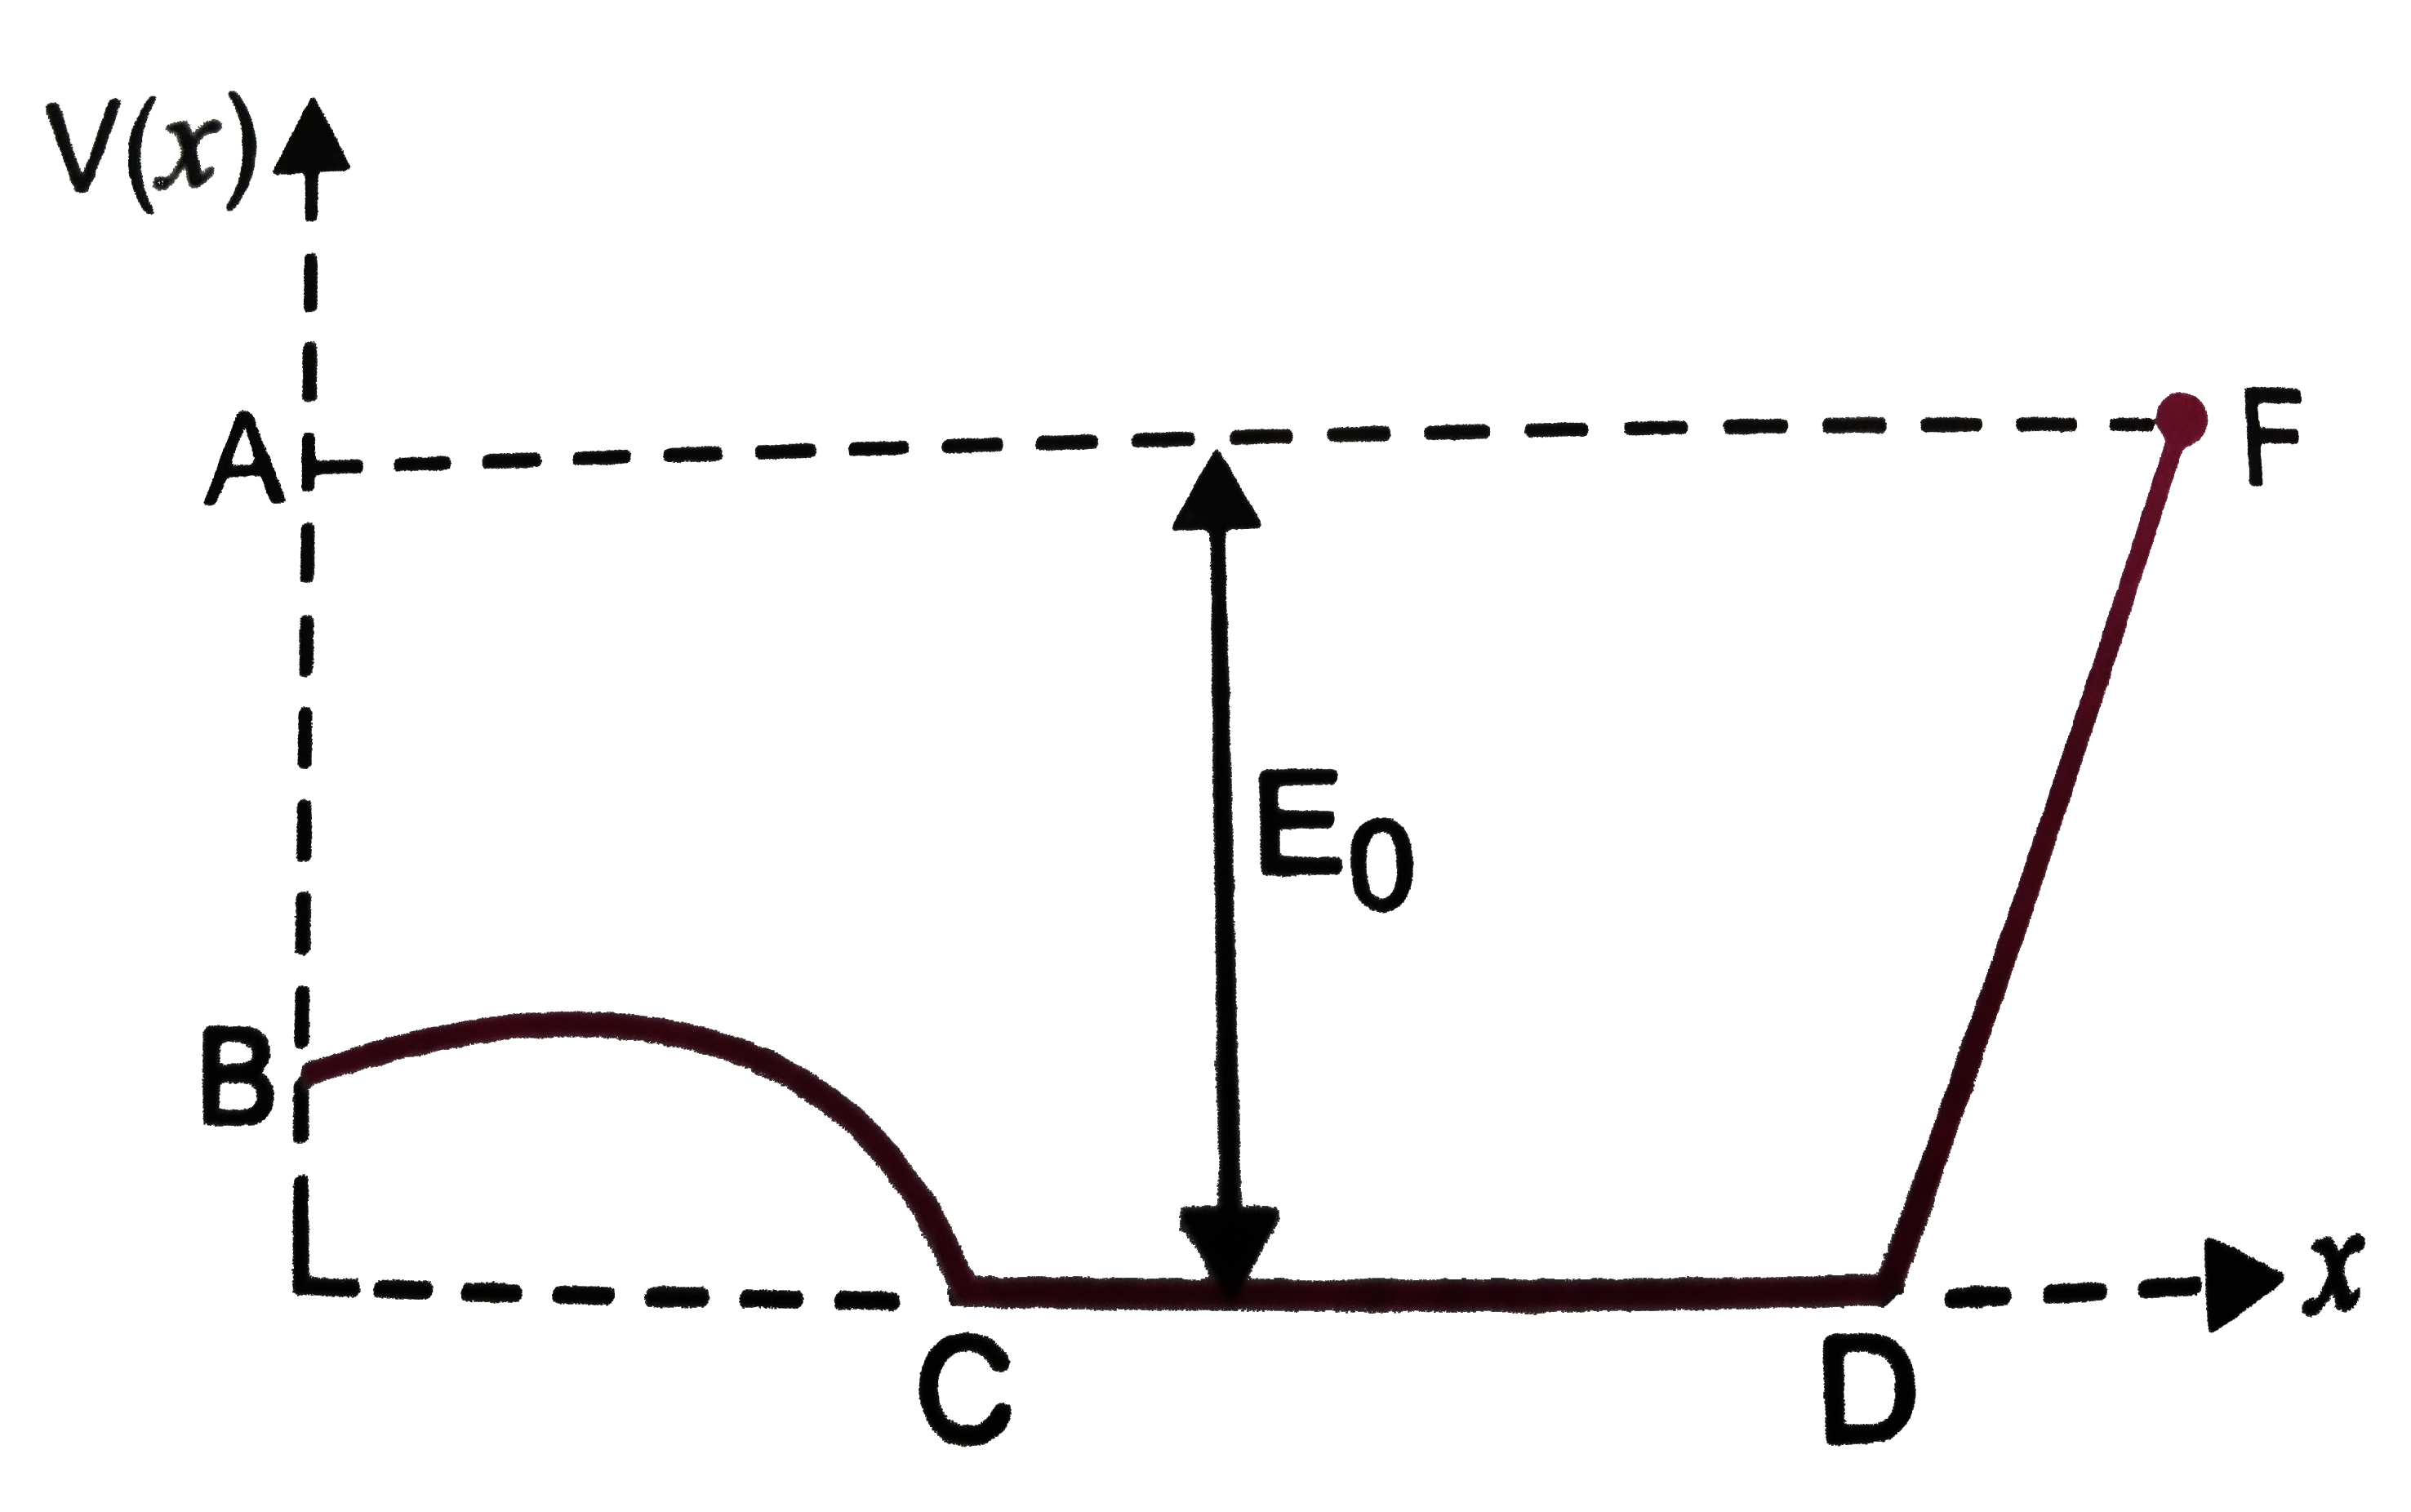
Total energy E0=KE+PE
or E0=KE+V(x)
or KE=E0−V(x)
At A , V(x)=E0and KE = 0 , so v = 0
Figures (a) and (b) show the graph of velocity and KE versus x for complete cycle AFA .

At B ,V(x)<E0 and KE is positive but not maximu
At C and D , V(x) = 0 and KE = maximum ,
v=± maximum
At F , V(x)=E0and KE = 0 , so v = 0
Figures (a) and (b) show the graph of velocity and KE versus x for one complete cycle AFA .
Topper's Solved these Questions
- WORK, ENERGY AND POWER Book:MODERN PUBLICATIONChapter:WORK, ENERGY AND POWER Exercise:Higher Order Thinking Skills & Advanced Level
Explore 15 Videos
- WORK, ENERGY AND POWER Book:MODERN PUBLICATIONChapter:WORK, ENERGY AND POWER Exercise:Revision Exercise (Very Short Answer Questions)
Explore 31 Videos
- WORK, ENERGY AND POWER Book:MODERN PUBLICATIONChapter:WORK, ENERGY AND POWER Exercise:NCERT FILE (NCERT Exemplar Problems (Very Short Answer Type Questions))
Explore 12 Videos
- WAVESBook:MODERN PUBLICATIONChapter:WAVESExercise:CHAPTER PRACTICE TEST
Explore 14 Videos
Similar Questions
Draw the graph between displacement and
kinetic energy for a particle executing SHM.
View SolutionAssertion : The graph of potential energy and kinetic energy of a particle in SHM with respect to position is a parabola.
Reason : Potential energy and kinetic energy do not vary linearly with position.
View Solution
Knowledge Check
The potential energy function for a particle executing linear SHM is given by V(x)=12kx2 where k is the force constant of the oscillator. For k=0.5Nm−1, the graph of V(x) versus x is shown in the figure A particle of total energy E turns back when it reaches x=±xm.if V and K indicate the potential energy and kinetic energy respectively of the particle at x=+xm,then which of the following is correct?
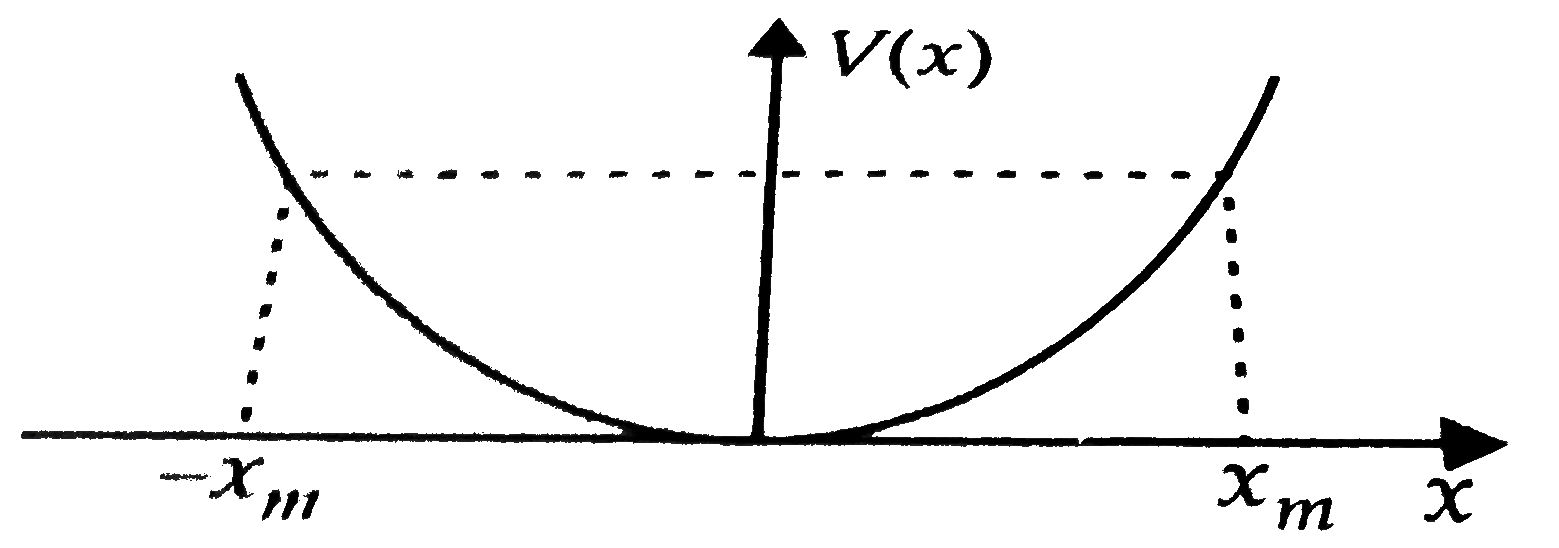 AV=0, K=EBV=E, K=0CV lt K, K=0DV=0, K lt E
The slope of potential energy versus position graph represents
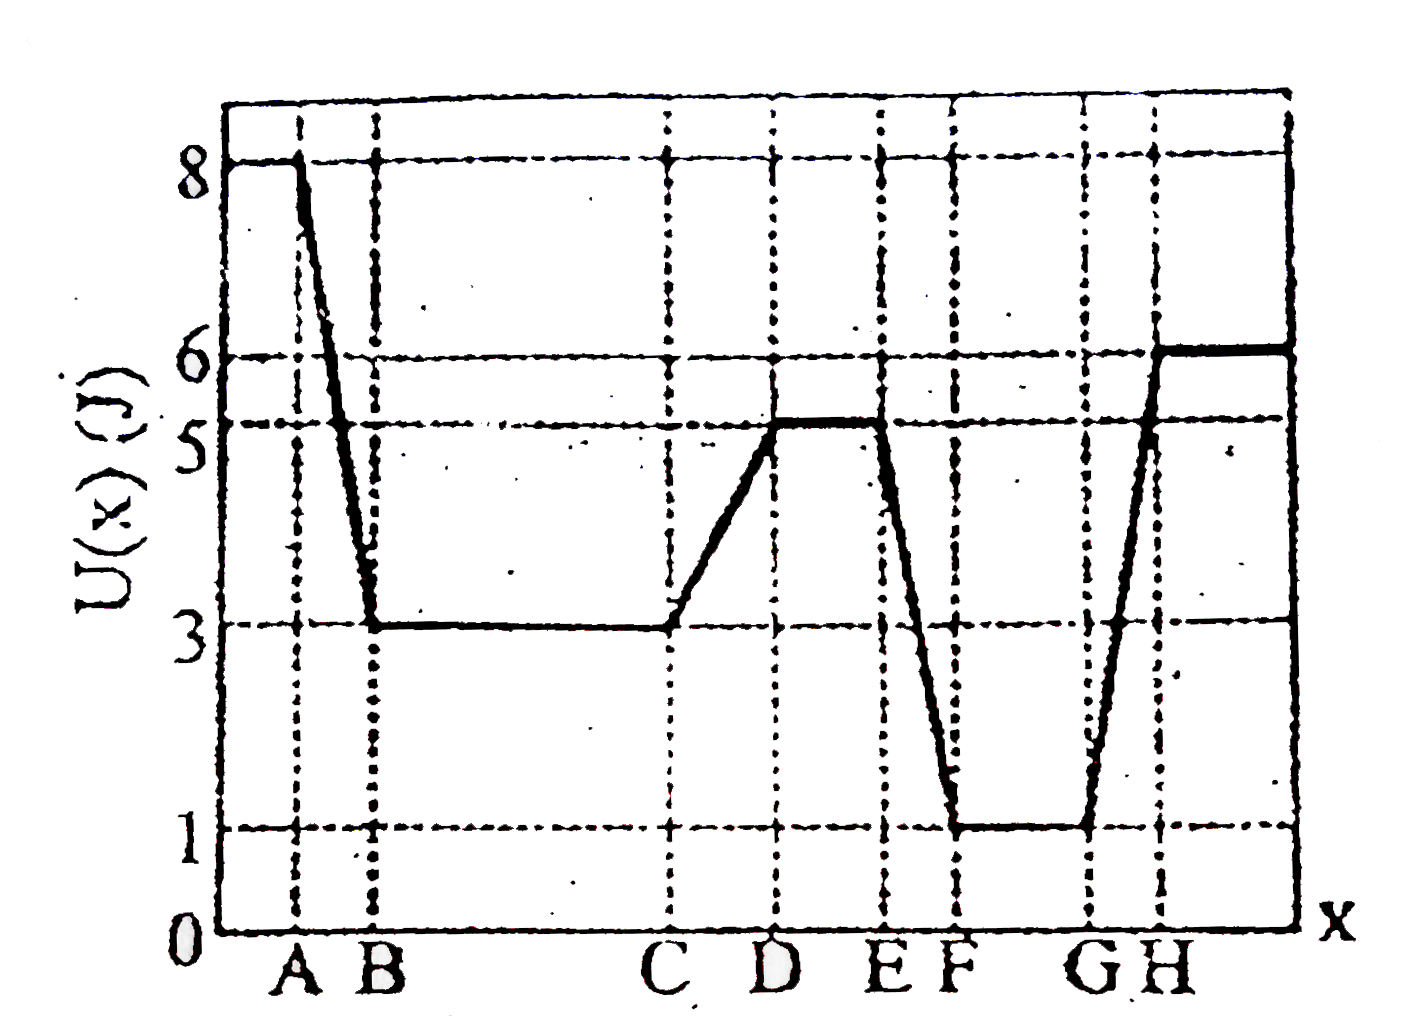
AforceBpowerCmomentumDworkThe figure below shows a graph of potential energy U(s) verses position x for a particle executing on edimensional motion along the x axis. The total mechanical energy of the system is indicated by the dashed line. At t=0 the particle is somewhere between points A and G. For later times choose the correct statement:-
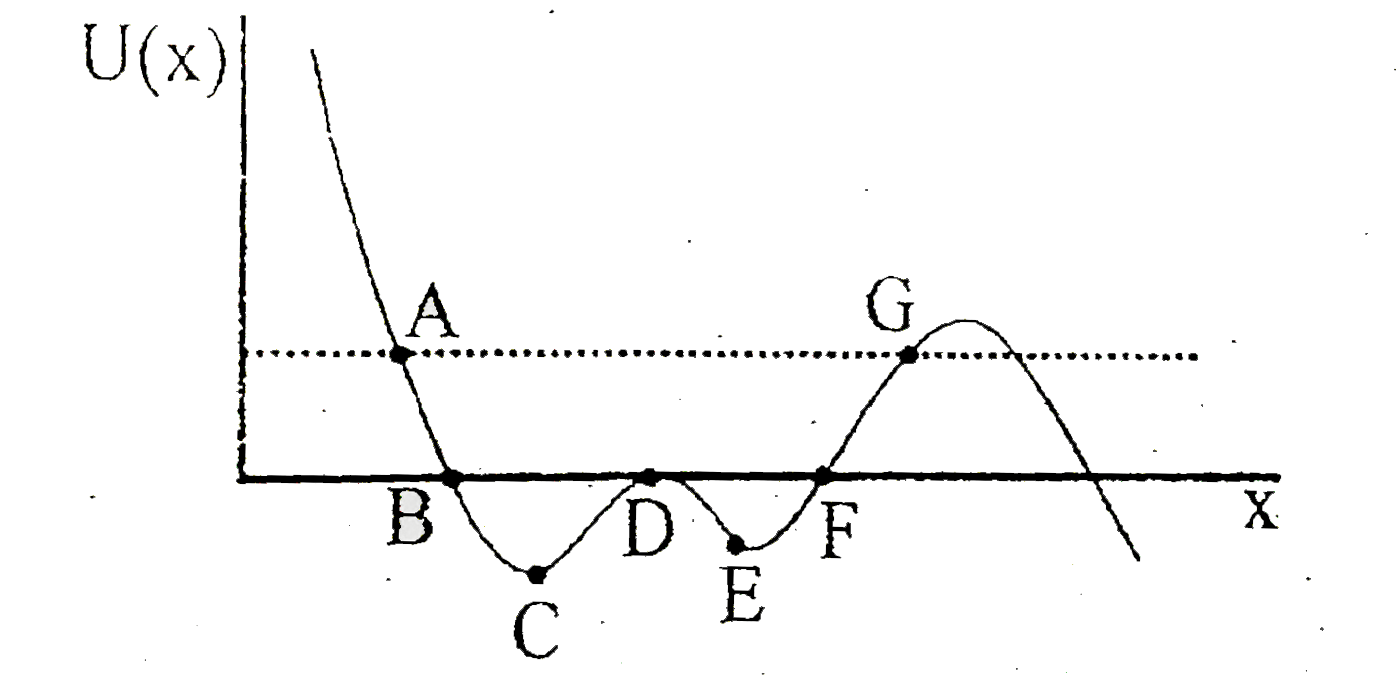 AThe magnitude of force is maximum at DBThe kinetic energy is maximum at BCThe velocity is zero at A & GDThe magnitude of force is minimum at F
Assertion: y−x graph of a transverse wave on a string is as shown in figure. At potential energy and kinetic energy both are minimum.
Reason : At point B kinetic energy and potential energy both are maximum.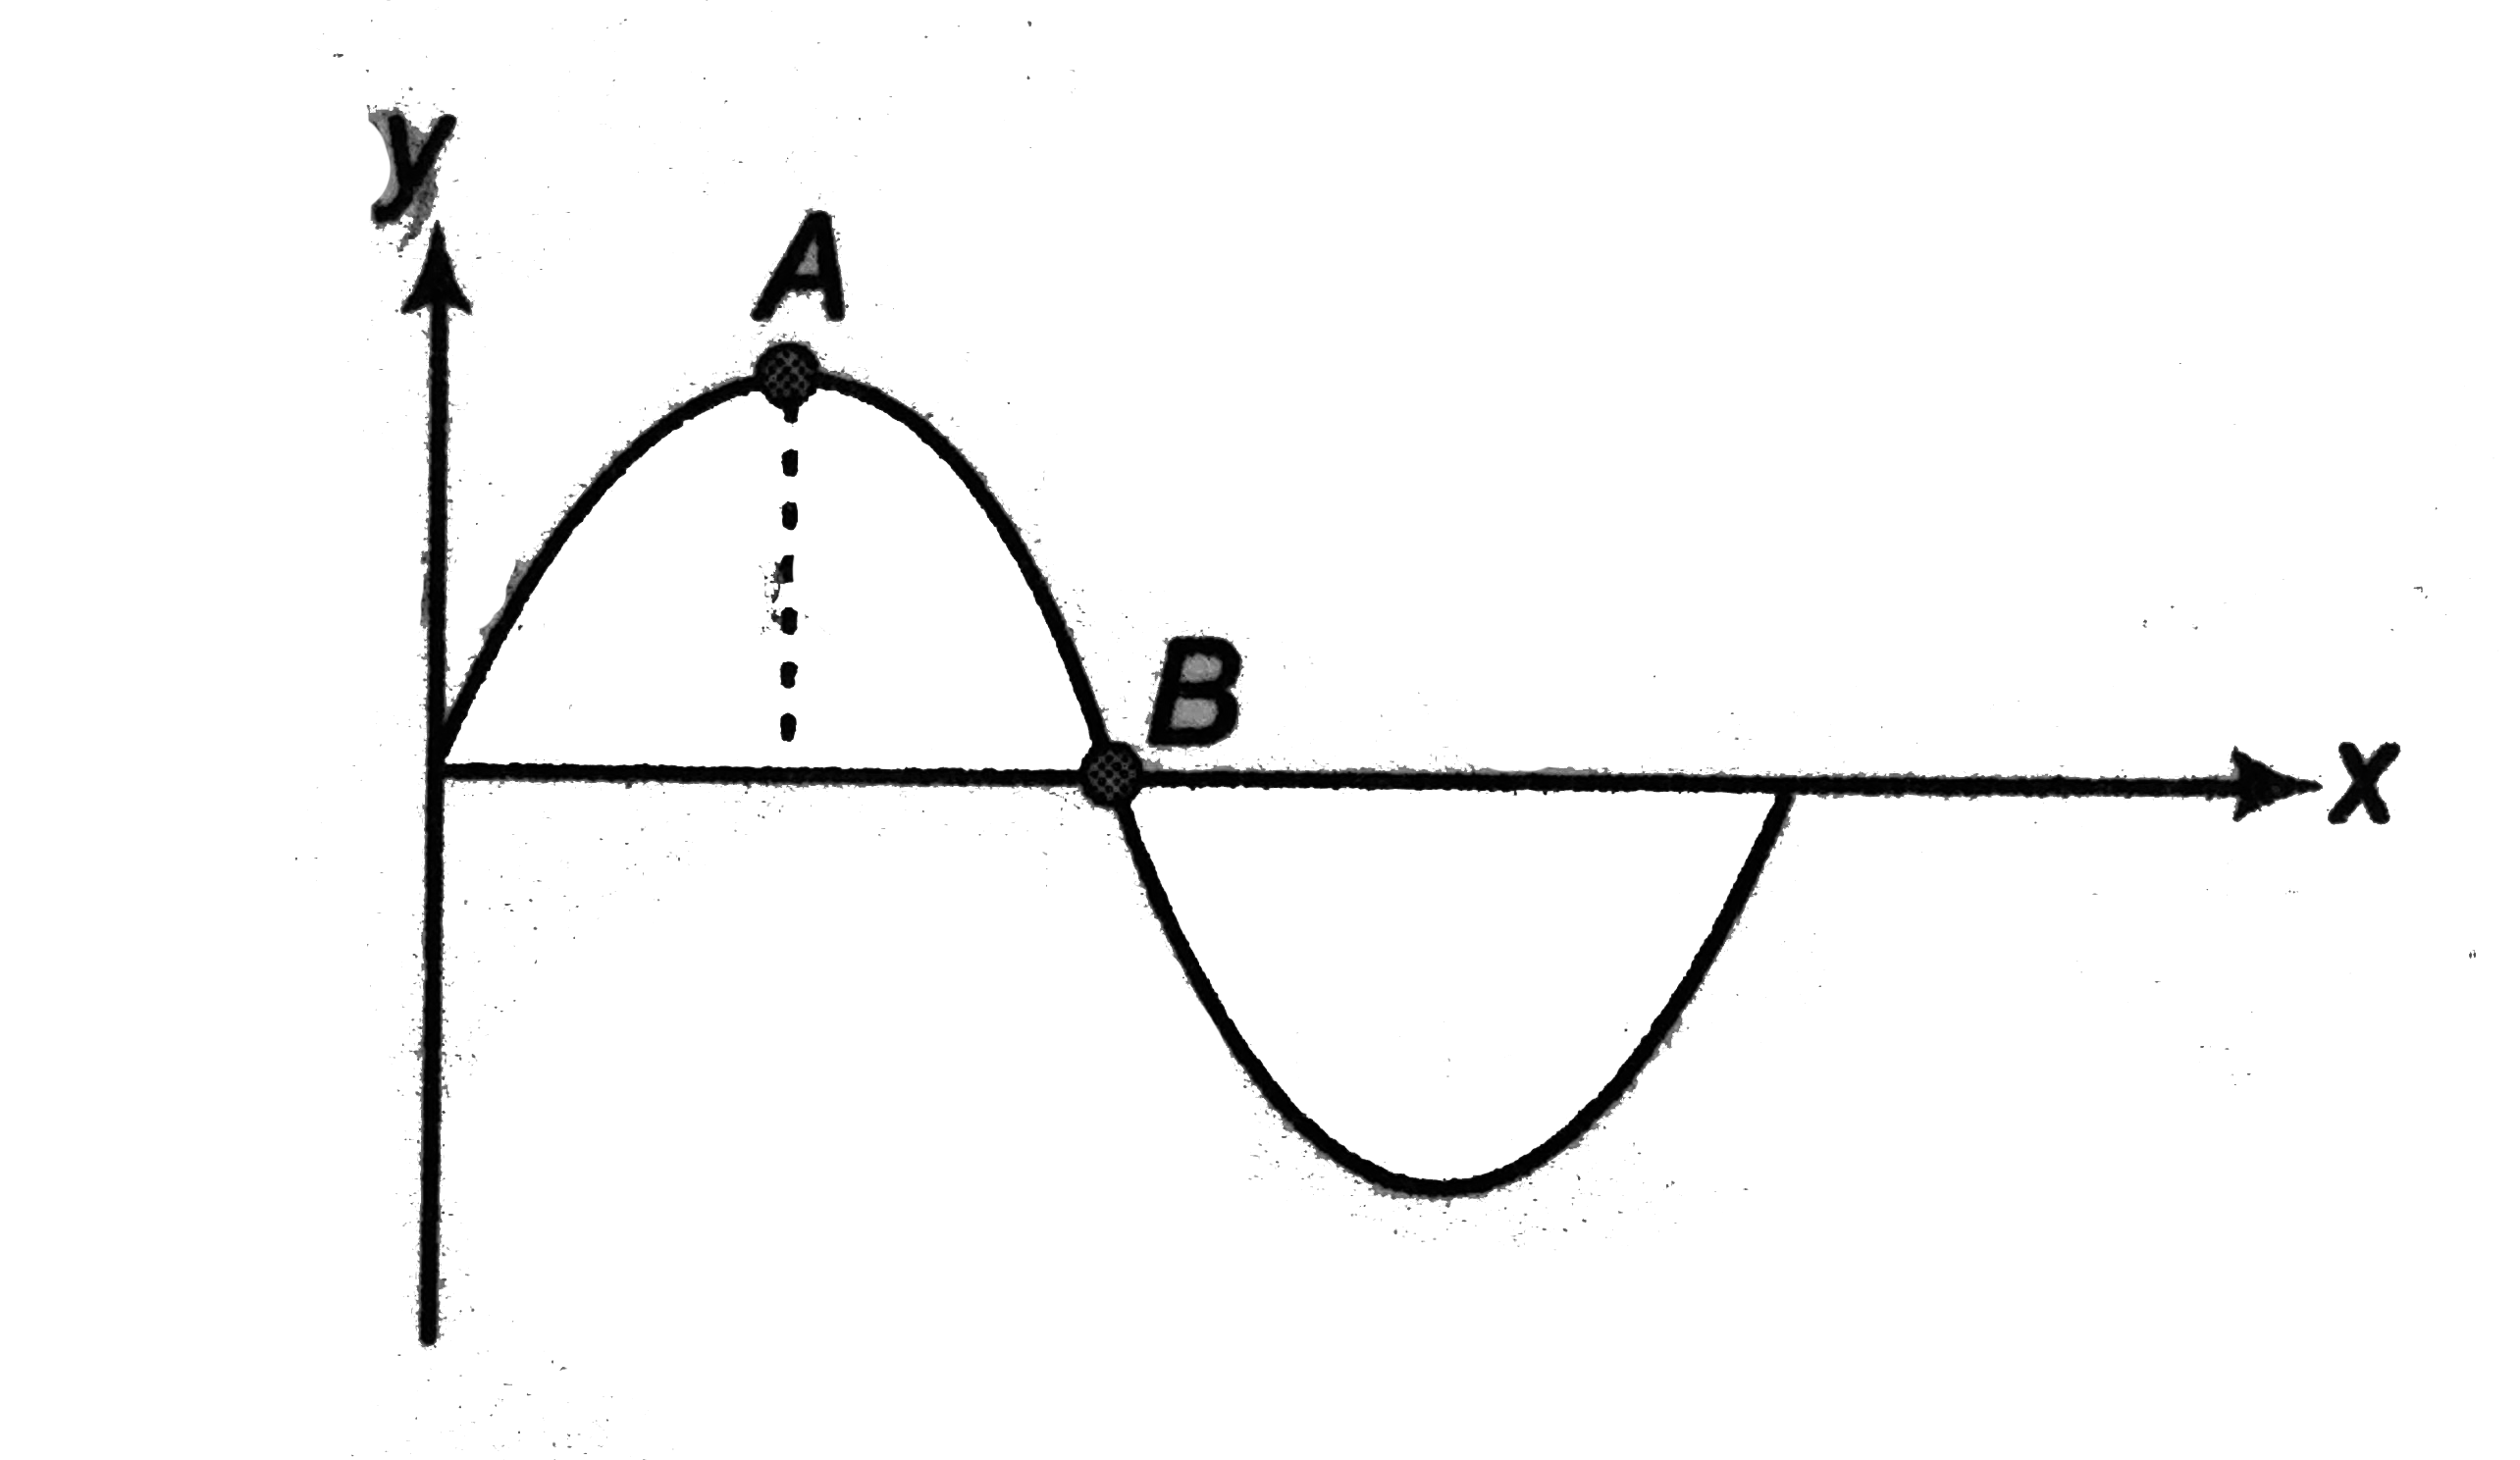
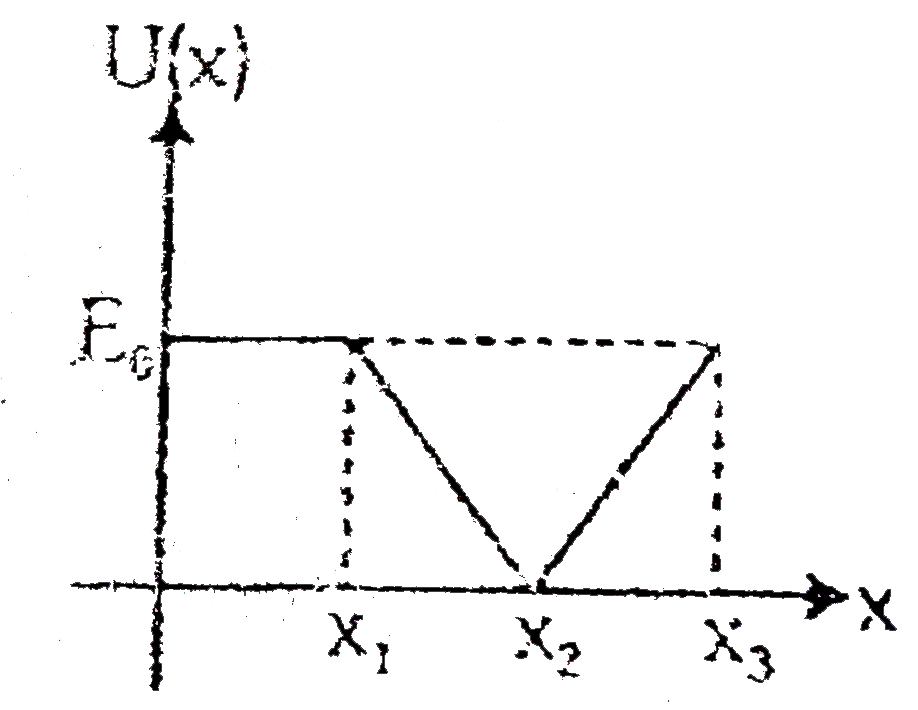
View SolutionThe potential energy U(x) of a particle moving along x−axis is shown in figure. Which one of the following graphs represents the variation of kinetic energy of this particel if its total mechanical enery is E0
View SolutionA potential energy curve U(x) is shown in the figure. What value must the mechanical energy Emec of the particle not exceed, if the particle is to be trapped within the region shown in graph?
 .
.
View SolutionThe potential energy of a particle varies with distance x as shown in the graph. The force acting on the particle is zero at
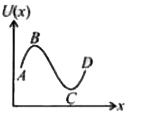
View SolutionThe potential energy of a particle varies with distance x as shown in the graph. The force acting on the particle is zero at

View Solution