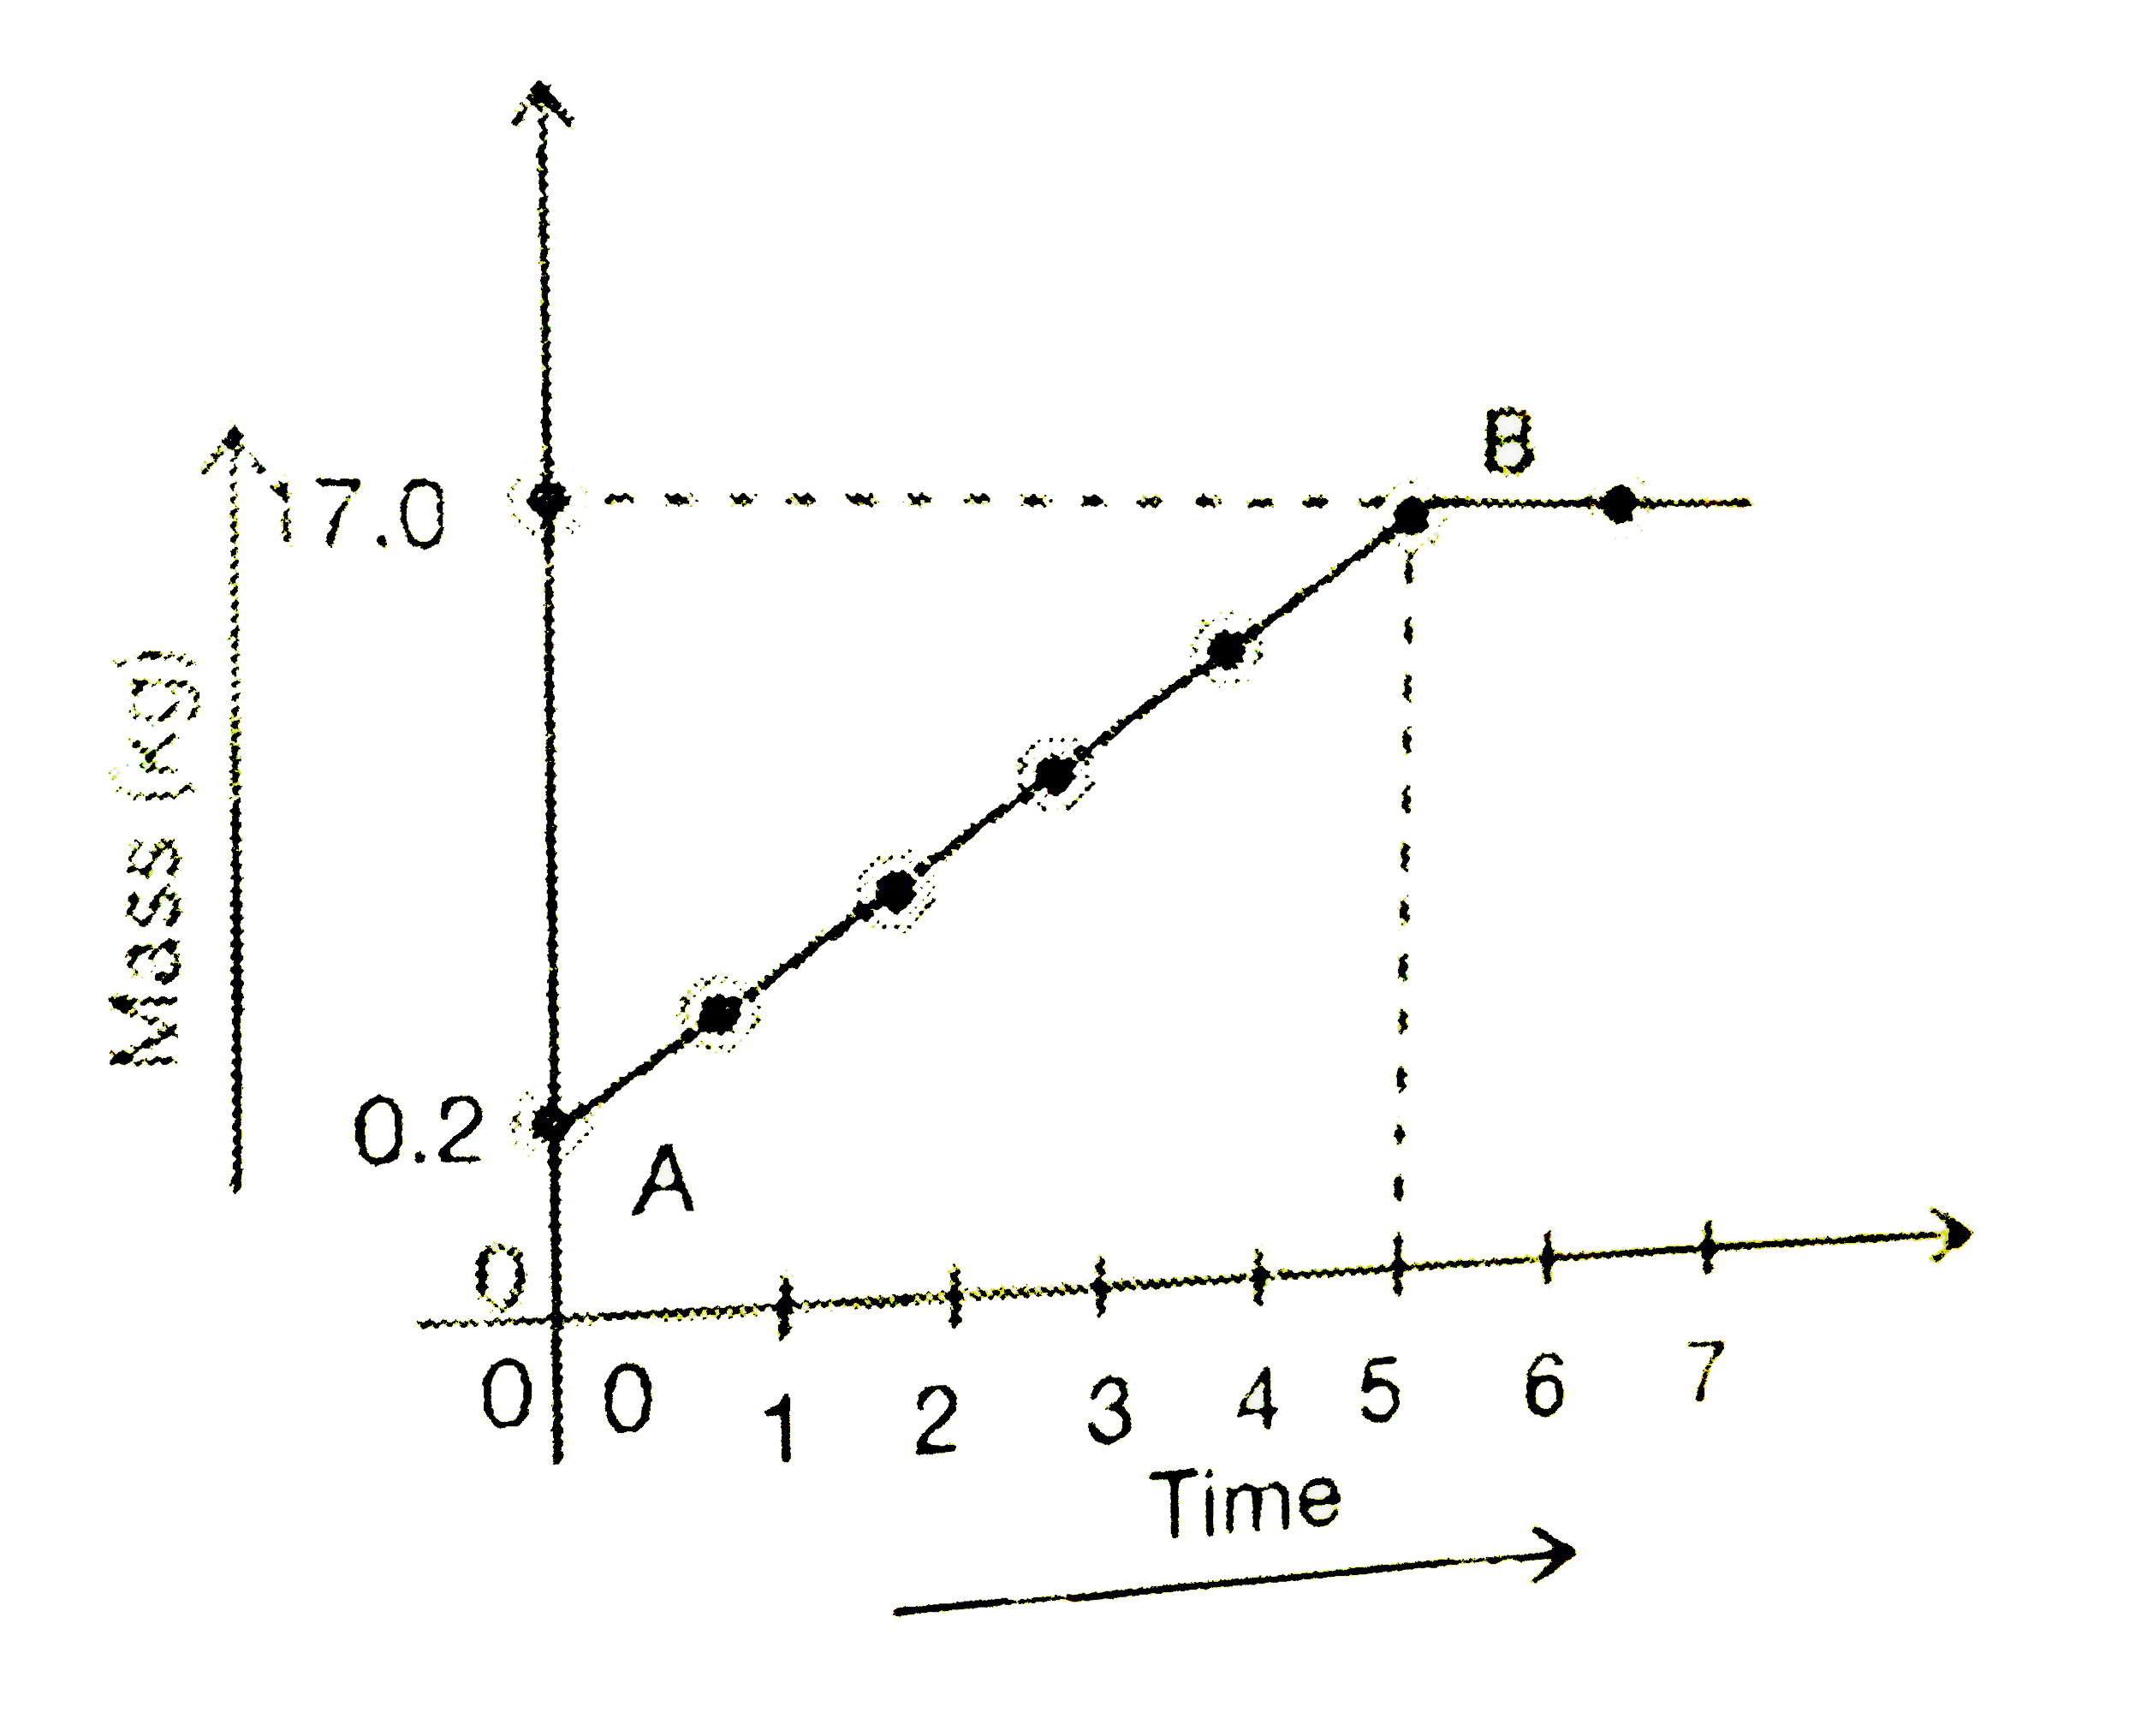
A liquid flows into a vessel initially empty at a steady rate of 70 cm3s−1 . The pictorial repressentation (graph) of the increase in the mass of the vessel with time is given below.
(i) What does the point A represent ?
(ii) What does the horizontal line beyond B indicate ?
(iii) find the capacity of the vessel.
(iv) Find the density of the liquid .

Video Solution
Text Solution
(i) calculate L.C.
=pitch number of division on circular scale
(ii) P.S.R = nth division × pitch
(iii) Observed reading =P.S.R +(H.S.R×L.C.)
(iv) Zero error =[H.S.R. + (N -n) ×L.C.]
(v) Corrections is positive if error is negative
(vi) Correct measurement = observed reading + correction.
(vii) Correct measurement =7.25 mm
|
Topper's Solved these Questions
Similar Questions
Knowledge Check
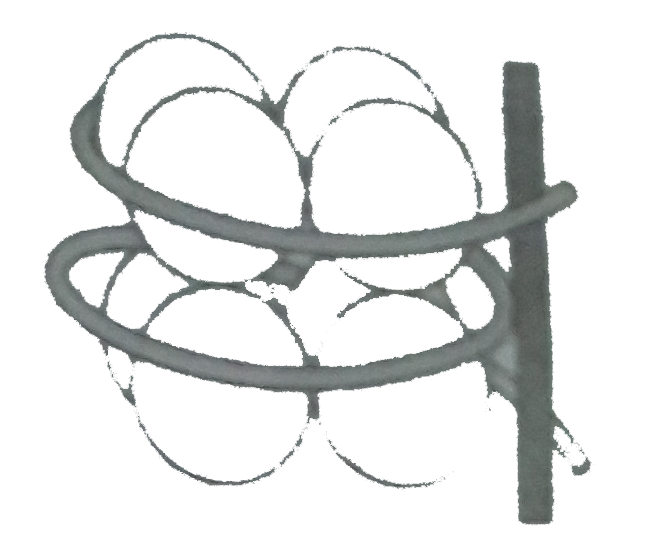
What does the given figure represent?
 ASectional view of ovaryBSectional view of seminiferous tubuleCL.S. of testisDMature Graadian follicle
What does the given diagram represent ?
 ANucleosomeBSpliceosomeCHistone complexDBoth (a) and (b)
What does the slope of a speed-time graph indicate ?
ASpeedBAccelerationCvelocityDnone of the above
What does the slope of a speed-time graph indicate ?
View SolutionWhat does the slope of a speed-time graph indicate ?
View SolutionWhat does the literacy rate of a country indicate?
View SolutionWhat does the slope of a distance-time graph indicate ?
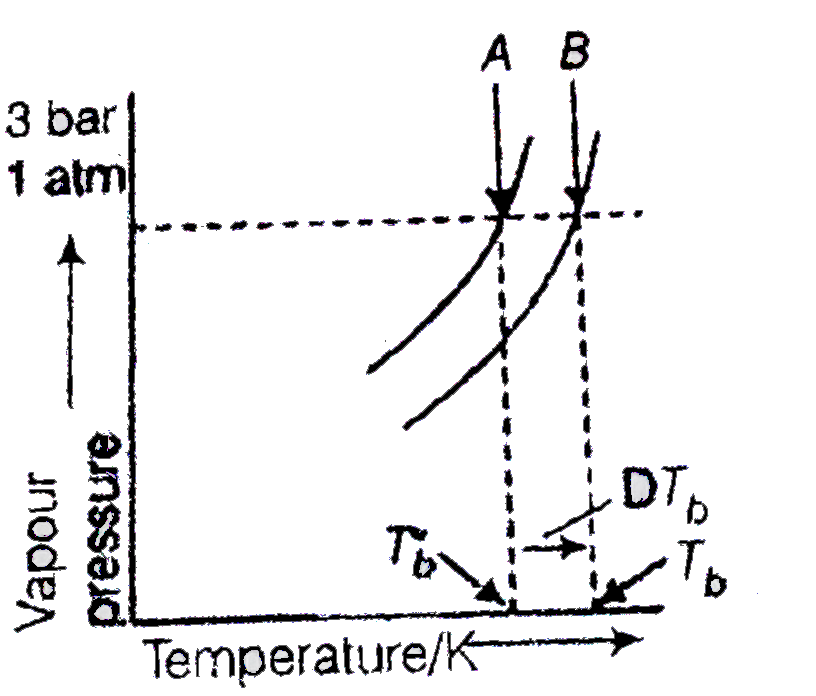
View SolutionWhat does point A and B represent in the following diagram?

View Solution

