A person in a train moving at a speed 3×10⁷ms−1 sleeps at 10 .00 p.m. by his watch and gets up at 4.00 a.m. How long did he sleep according to the clocks at the stations?
The time interval measured by the watch is the proper time interval because the events , 'sleeping ' and 'getting up' , are recorded by the single clock (the watch). The clocks at the stations represent the ground frame and in this frame he sleeps at one place and gets up at another place. Thus, the time interval measured by the station clocks is improper time interval and is more than the proper time interval. The duration of his sleep in the ground frame is δt'=γΔt=⎛⎜⎝Δt√1−v2c2⎞⎟⎠=⎛⎜
⎜
⎜
⎜⎝6h√1−(3×10⁷ms−13×108ms−1^(2))
=6h(√10099)=6hours1.8minutes.
The speed of the train in this example is hypothetical. A typical fast train today runs at about300kmh−1.
Repeat the exercise with such a train .
Topper's Solved these Questions
- BOOK - HC VERMACHAPTER - THE SPECIAL THEORY OF RELATIVITYEXERCISE - worked out example8videos
THE SPECIAL THEORY OF RELATIVITY
- BOOK - HC VERMACHAPTER - THE SPECIAL THEORY OF RELATIVITYEXERCISE - Objective7videos
THE SPECIAL THEORY OF RELATIVITY
- BOOK - HC VERMACHAPTER - THE NUCLEOUSEXERCISE - Exercises53videos
THE NUCLEOUS
- BOOK - HC VERMACHAPTER - THERMAL AND CHEMICAL EFFECT OF ELECTRIC CURRENTEXERCISE - Exercises24videos
THERMAL AND CHEMICAL EFFECT OF ELECTRIC CURRENT
Similar Questions
Knowledge Check
- Question 1 - Select One
A train starts moving from a place P at 10:00 a.m. and arrives at another place Q at 5:30 p.m. on the same day. If the speed of the train is 50 km/hr, then what will be the distance (in km) covered by the train?
A424B390C375D225 - Question 2 - Select One
A train starts moving from a place X at 7:00 a.m. and arrives at another place Y at 1:00 pm on the same day. If the speed of the trains 15m/s, then what will be the distance (in km) covered by the train?
A324B375C390D345 - Question 3 - Select One
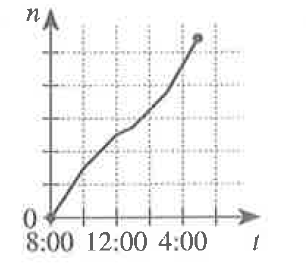
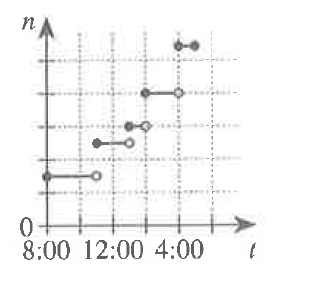
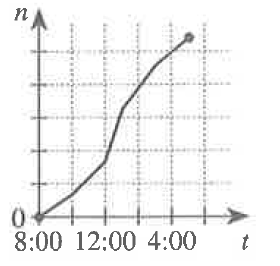
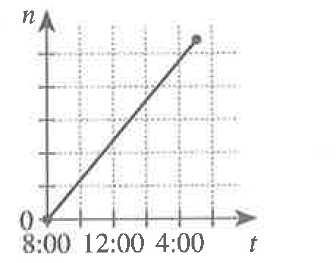
Three copy machines- A,B and C- copy at the same rate and will all be used to make copies of a report. At 8:00 a.m., all 3 machines begin copying Machine A breaks down at 10:00 a.m. And is back in service at 1:00 p.m. Machine B breaks down at 12:00 p.m. (noon) and begins copying again at 3:00 p.m. All 3 machines finish copying at 5:00 p.m. when the copying of the report is complete. One of the following graphs showns n, the numbers of copies made, as a function of t, the time at any given point during the copying. Which graph is it?
A B
B C
C D
D
A block of mass 2.00 kg moving at a speed of 10.0 m/s accelerates at 3.0 ms2 for 5.00 s. Compute its final kinetic enegy.
View SolutionIn a particle accelerator , an electron enters a region in which it accelerates uniformly in a straight line from a speed of 4.00×10⁵m/s to a speed of 6.00×10⁷m/s in a distance of 3.00 cm. For what time interval does the electron accelerate ?
View Solution. Reena leaves office at 6.00 p.m. and catches a 6.30 p.m. local train that arrives in her town at 7.00 p.m. Her father leaves home to pick her up at 7.00 p.m. from the station as she gets off the train. Yesterday, Reena left her office early and took a 6.00 p.m. train and arrived at 6.30 p.m. As her father was not there to pick her up, she started walking towards home. Her father left home at the usual time, saw her daughter walking, turned around, picked her up and drove home, arriving there 10 minutes earlier than the usual. For how long did Reena walk before her father picked her up? 10 m∈ b. 1 m∈ c. 25 m∈ d. 20 m∈
View SolutionA 120 m long train is moving towards west with a speed of 10 m/s. A bird flying towards east with a speed of 5 m/s crosses the train. The time taken by the bird to cross the train will be
View SolutionTrain A' runs at a speed of 80 kmph and leaves station X' at 11.00 a.m. Train 'B' leaves station 'X at 11.15 a.m. in the same direction, on the same day . At what speed train 'B' should run in order to catch train 'A at station 'Y located at a distance of 60 km?
View Solution

