A solid material is supplied with heat at a constant rate. The temperature of the material is changing with the heat input as shown in the graph in figure. Study the graph carefully and answer the following questions:
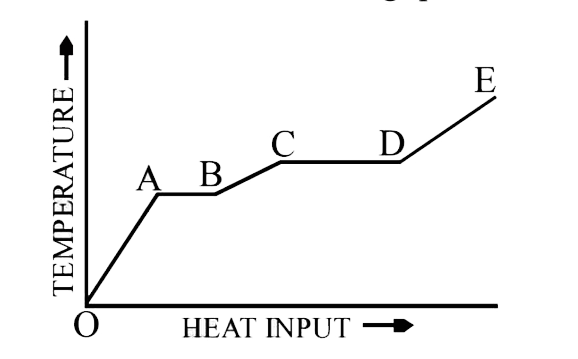
(i) What do the horizontal regions AB and CD represent?
If CD is equal to 2AB, what do you infer?
What does the slope of DE represents?
The slope of OAgtthe slope of BC. What does this indicate?
Step by step video & image solution for A solid material is supplied with heat at a constant rate. The temperature of the material is changing with the heat input as shown in the graph in figure. Study the graph carefully and answer the following questions: (i) What do the horizontal regions AB and CD represent? If CD is equal to 2AB, what do you infer? What does the slope of DE represents? The slope of OAgtthe slope of BC. What does this indicate? by Physics experts to help you in doubts & scoring excellent marks in Class 12 exams.
Updated on:21/07/2023Topper's Solved these Questions
- HEAT AND THERMAL EXPANSIONBOOK - PHYSICS GALAXY - ASHISH ARORACHAPTER - HEAT AND THERMAL EXPANSIONEXERCISE - CONCEPTUAL MCQs SINGLE OPTION CORRECT
15 Videos
- HEAT AND THERMAL EXPANSIONBOOK - PHYSICS GALAXY - ASHISH ARORACHAPTER - HEAT AND THERMAL EXPANSIONEXERCISE - NUMERICAL MCQs SINGLE OPTIONS CORRECT
81 Videos
- HEAT AND THERMAL EXPANSIONBOOK - PHYSICS GALAXY - ASHISH ARORACHAPTER - HEAT AND THERMAL EXPANSIONEXERCISE - PRACTICE EXERCISE
40 Videos
- GEOMETRICAL OPTICSBOOK - PHYSICS GALAXY - ASHISH ARORACHAPTER - GEOMETRICAL OPTICSEXERCISE - Unsolved Numerical Problems
107 Videos
- HEAT TRANSFER BOOK - PHYSICS GALAXY - ASHISH ARORACHAPTER - HEAT TRANSFER EXERCISE - Unsolved Numerical Problems for Preparation of NSEP,INPhO&IPhO
66 Videos
Similar Questions
Knowledge Check
A solid material is supplied heat at a constant rate. The temperature of material is changing with heat input as shown in the figure. What does the slope of DE represent ?
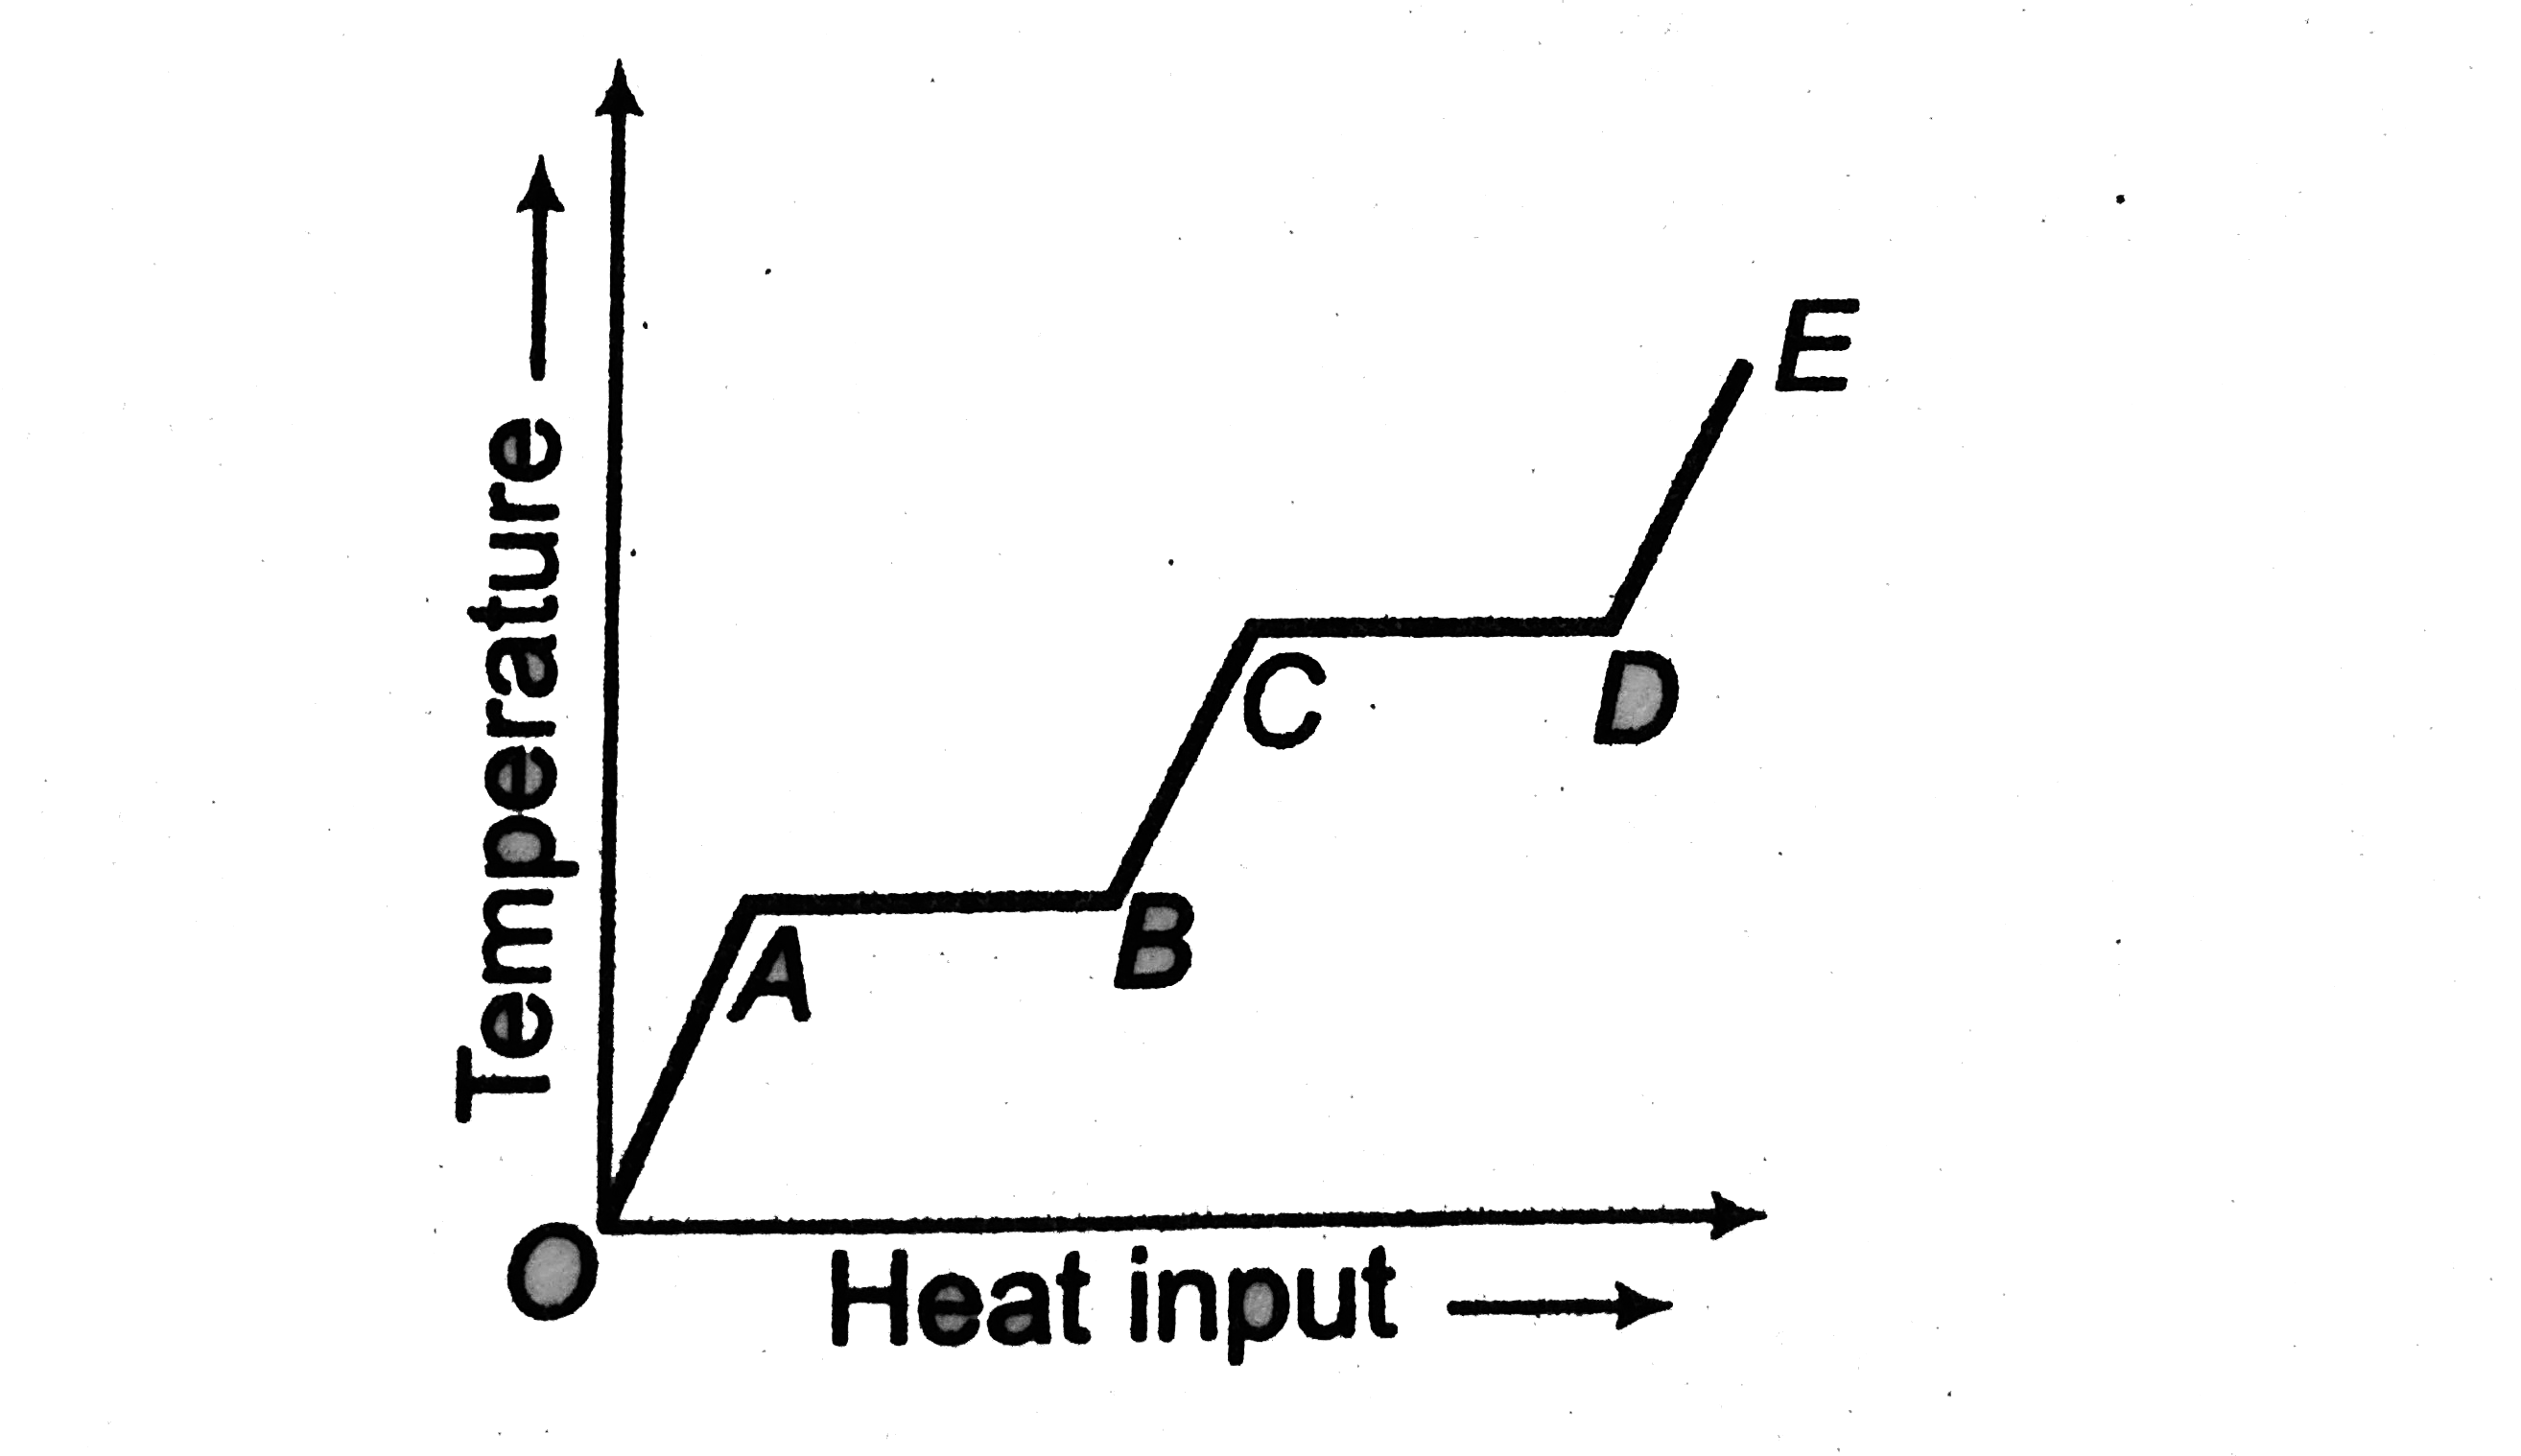 ALatent heat of liquidBLatent heat of vaporizationCHeat capacity of vapourDInverse of heat capacity of vapour
Refer to the given graph carefully and answer the following question.
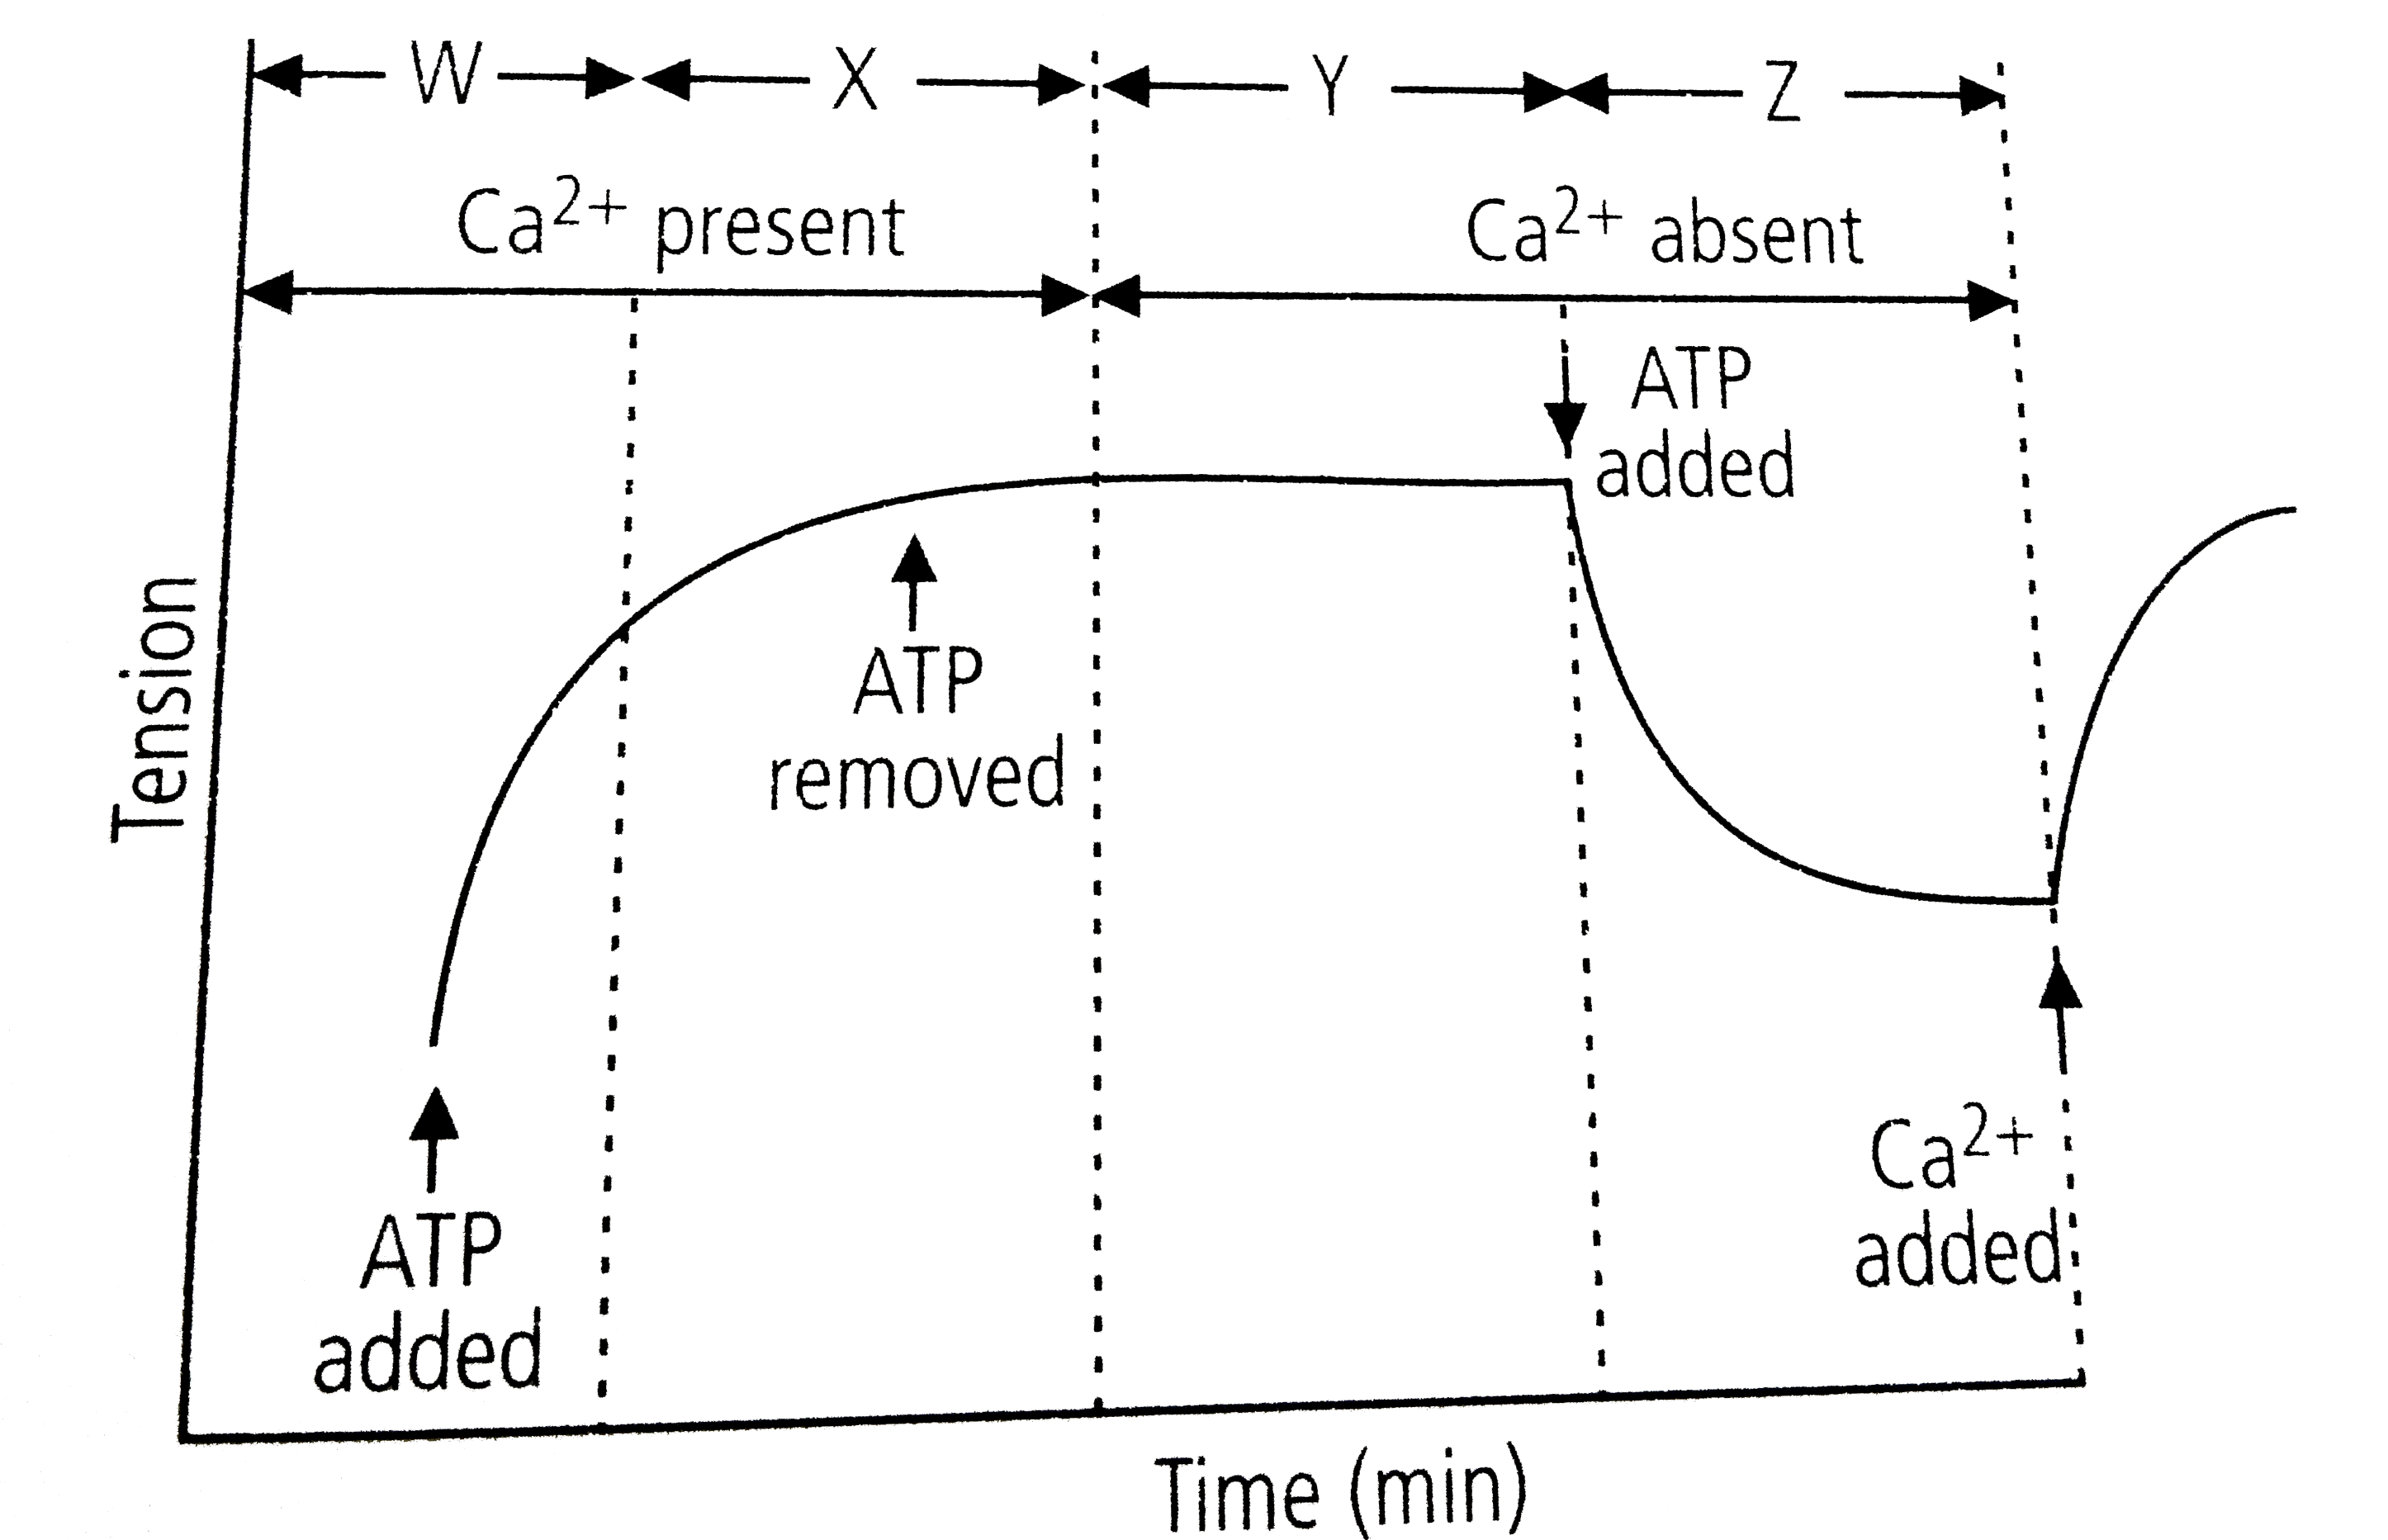
Which of the labelled parts on the graph represents rigor mortis?AXBWCZDYStudy the following graph carefully and answer the following questions -----

What was the percentage drop in export quantity from 1983 to 1984 ?A75BNilC25D50
Study the given graph carefully and answer the following questions.
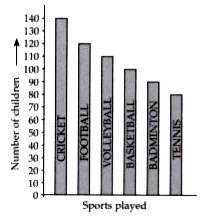
What fraction of the total number of children plays football ?
View SolutionStudy the following graph carefully and answer the given questions.
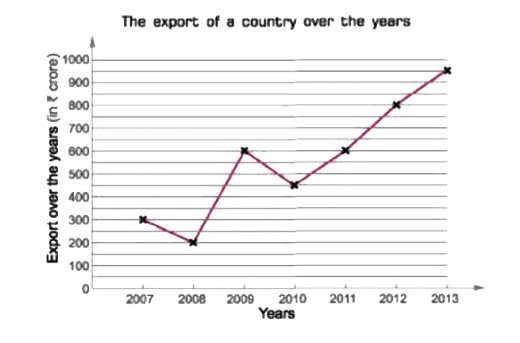
What is the total exports ( in ? Crore) for the given years ?
View SolutionWhat does the slope of a work-time graph represent?
View SolutionStudy the following graph carefully and answer the following questions -----

What was the difference between the tins exported in 1985 and 1986 ?
View SolutionStudy the following graph carefully and answer the questions that
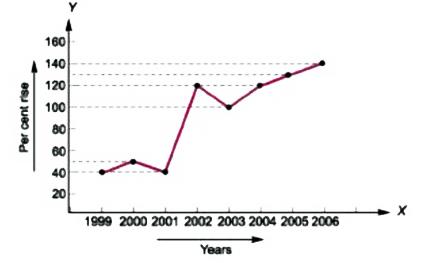
What was the average of percent rise over the given years ?
View Solution

