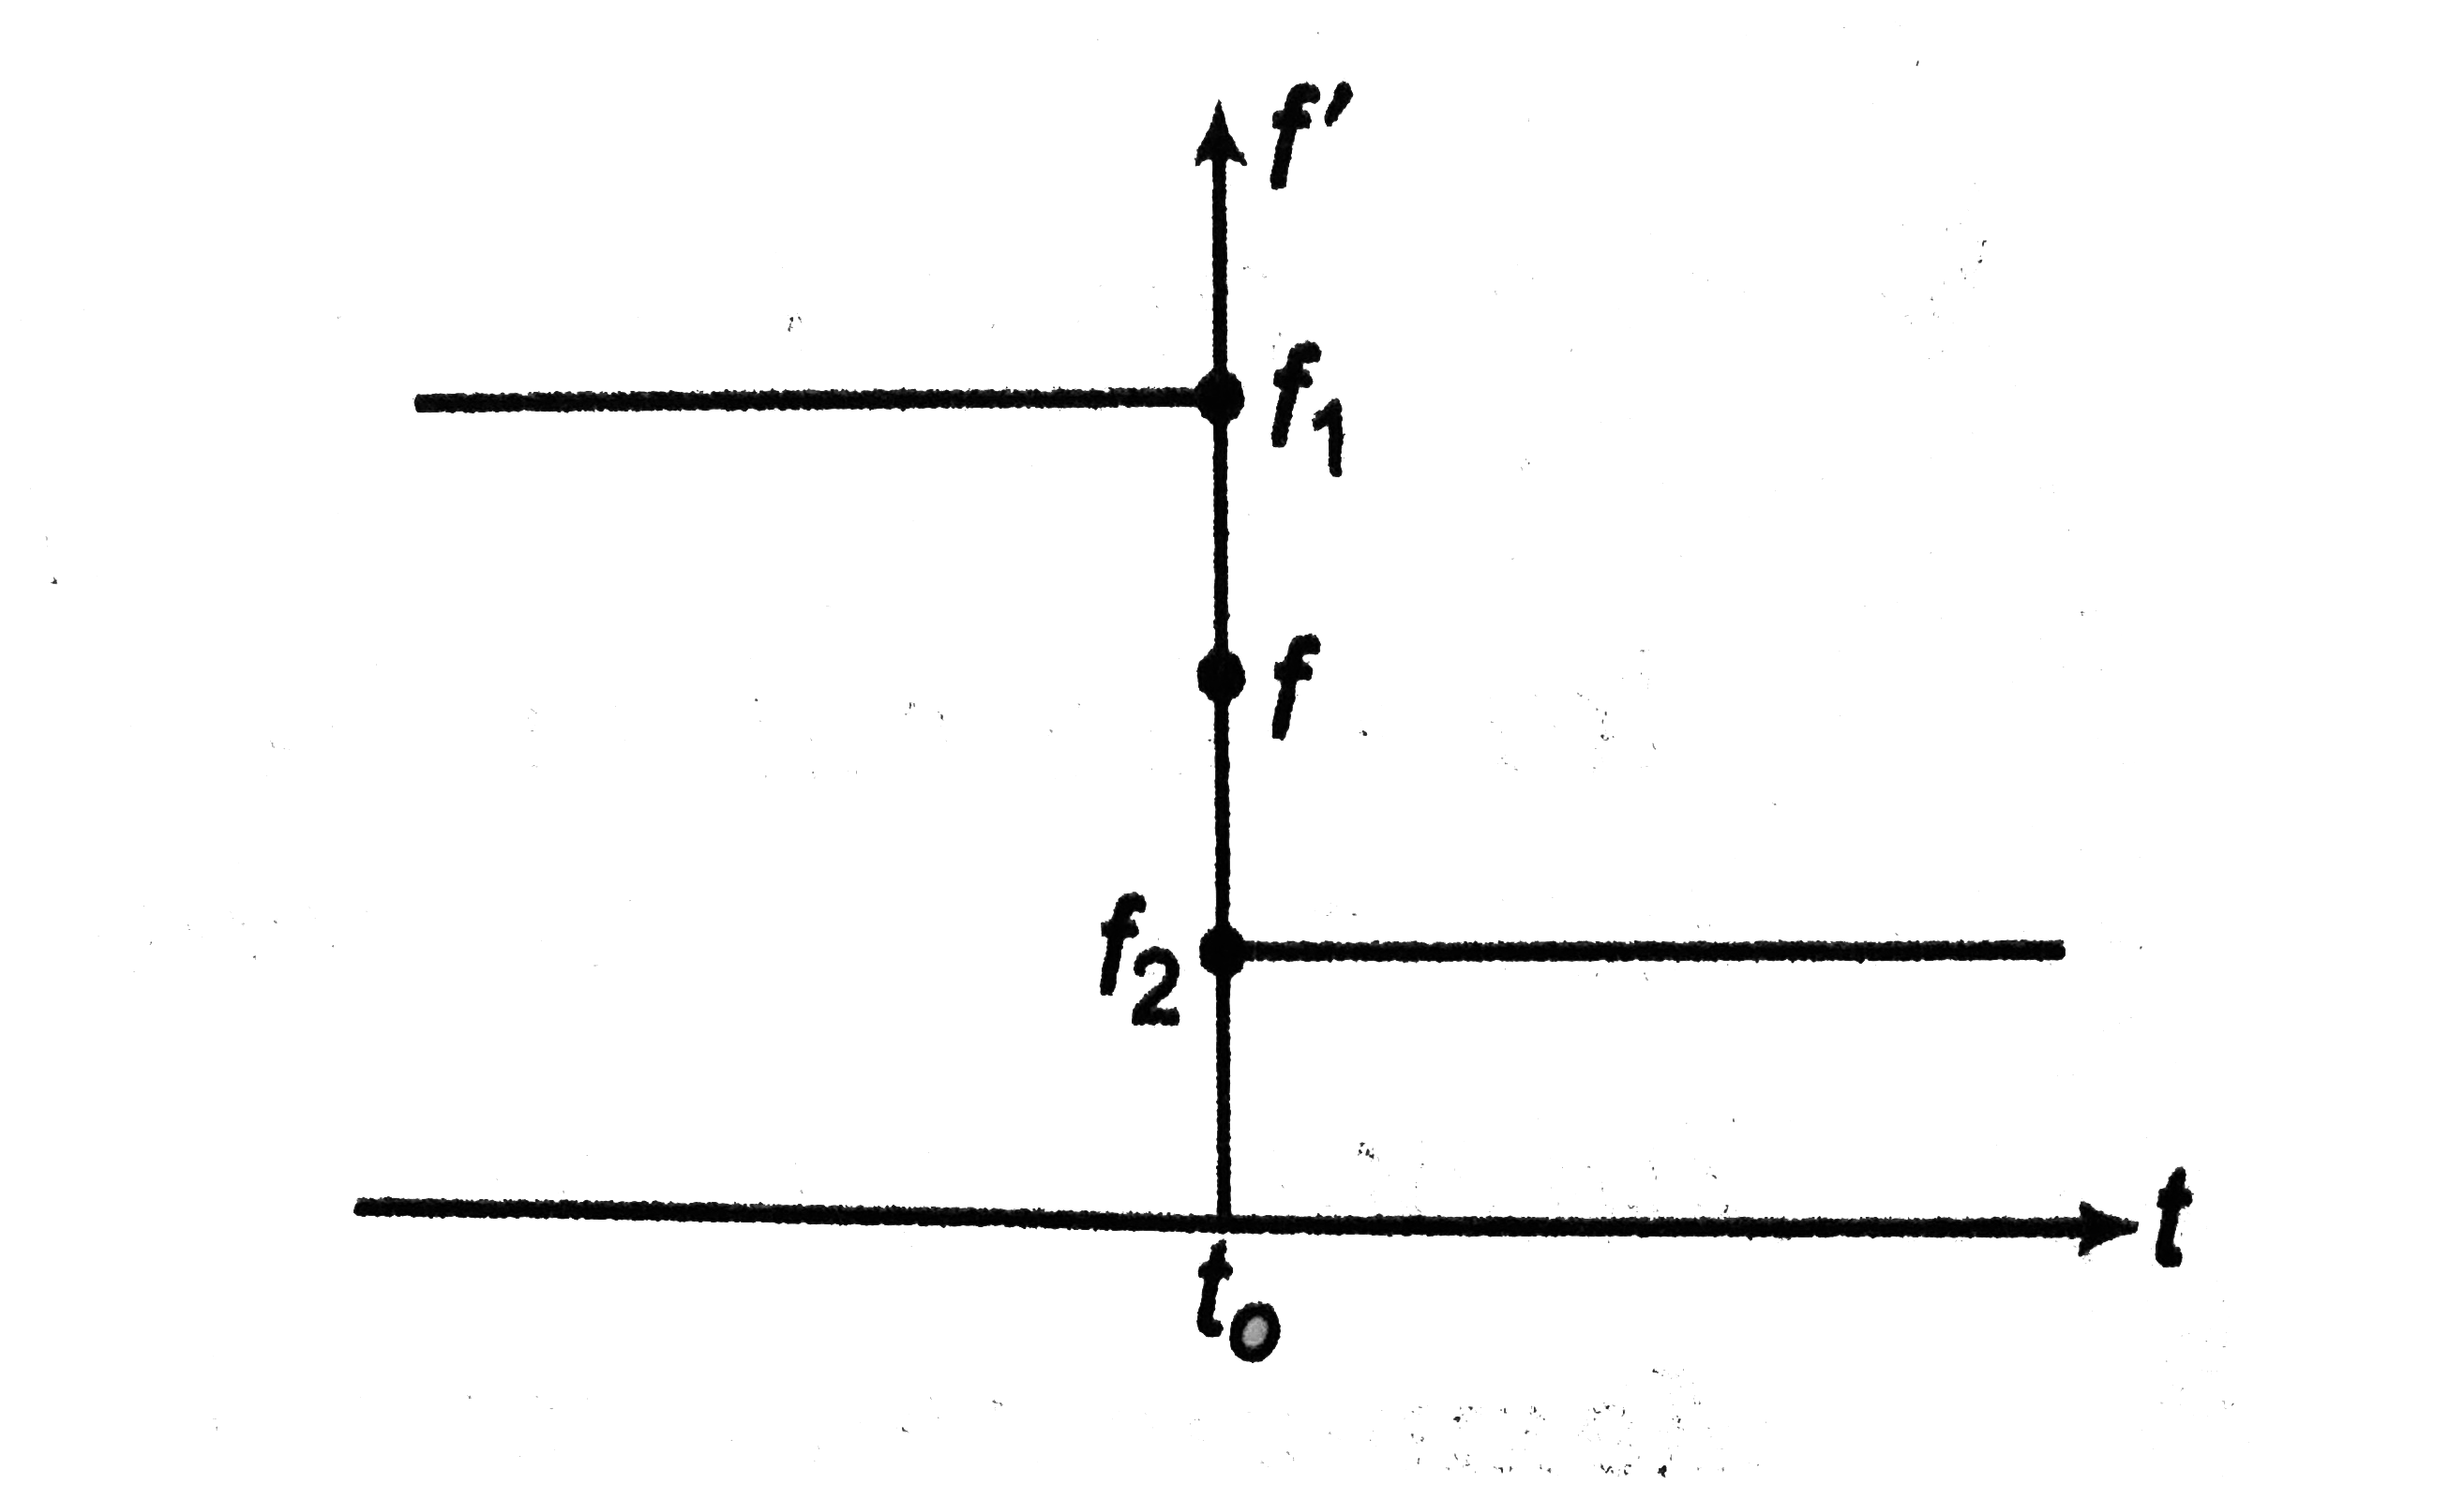
A source of frequency f is moving towards the observer along the line SO with a constant velocity υs as shown in figure. Plot f' versus t graph . Where f' is the changed frequency observed by the observer.

f'=f(υυ−υs)=f1 (say)
f'>f
but f' is constant with time.
f'=f(υυ−υs)=f2 (say)
f'<f
but f' is constant with time . The correct f' versus t graph is as shows.
In the figure, t0 is the time when source is crossing the observer.

Topper's Solved these Questions
- SOUND WAVESBOOK - DC PANDEY ENGLISHCHAPTER - SOUND WAVESEXERCISE - TYPE 5.
2 Videos
- SOUND WAVESBOOK - DC PANDEY ENGLISHCHAPTER - SOUND WAVESEXERCISE - Miscellaneous Examples
8 Videos
- SOUND WAVESBOOK - DC PANDEY ENGLISHCHAPTER - SOUND WAVESEXERCISE - Example Type 3
3 Videos
- SOLVD PAPERS 2017 NEET, AIIMS & JIPMERBOOK - DC PANDEY ENGLISHCHAPTER - SOLVD PAPERS 2017 NEET, AIIMS & JIPMEREXERCISE - Solved paper 2018(JIPMER)
38 Videos
- SUPERPOSITION OF WAVESBOOK - DC PANDEY ENGLISHCHAPTER - SUPERPOSITION OF WAVESEXERCISE - Level 2 Subjective
8 Videos
Similar Questions
A source of sound emitting a note of frequency 200 Hz moves towards an observer with a velocity v equal to the velocity of sound. If the observer also moves away from the source with the same velocity v, the apparent frequency heard by the observer is
View SolutionA source of sound emitting a note of constant frequency is moving towards a stationary listener and then recedes from the listener with constant velocity maintained throughout the motion. The frequency heard by the listener (f). when plotted against time (t) will give the following curve(s).
View Solution
Knowledge Check
A source having frequency of 240 Hz is moving towards an observer with a speed of 20 m/sec. When the observer is moving towards the source with a velocity of 20 m/sec, then apparent frequency heard by the observer, if velocity is 330 m/sec will be
A245 HzB268 HzC271 HzD260 Hz

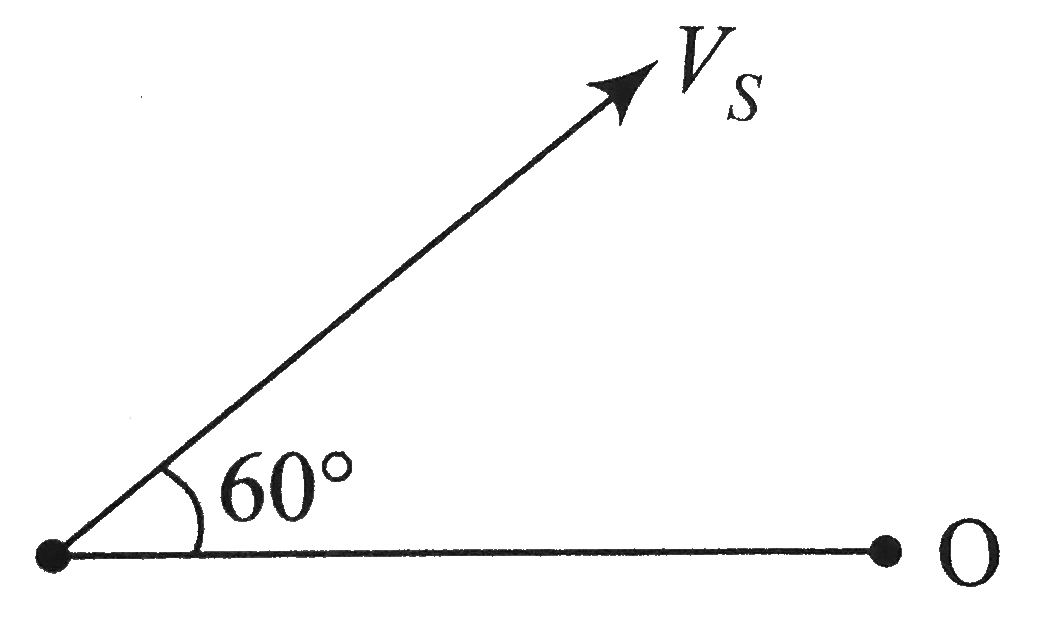
A source of sound S emitting waves of frequency 100Hz and an observer O are located at some distance from each other. The source is moving with a speed of 19.4ms−1 at an angle of 60∘ with the source observer line as shown in the figure. The observer is at rest. The apparent frequency observed by the observer (velocity of sound in air 330ms−1) is
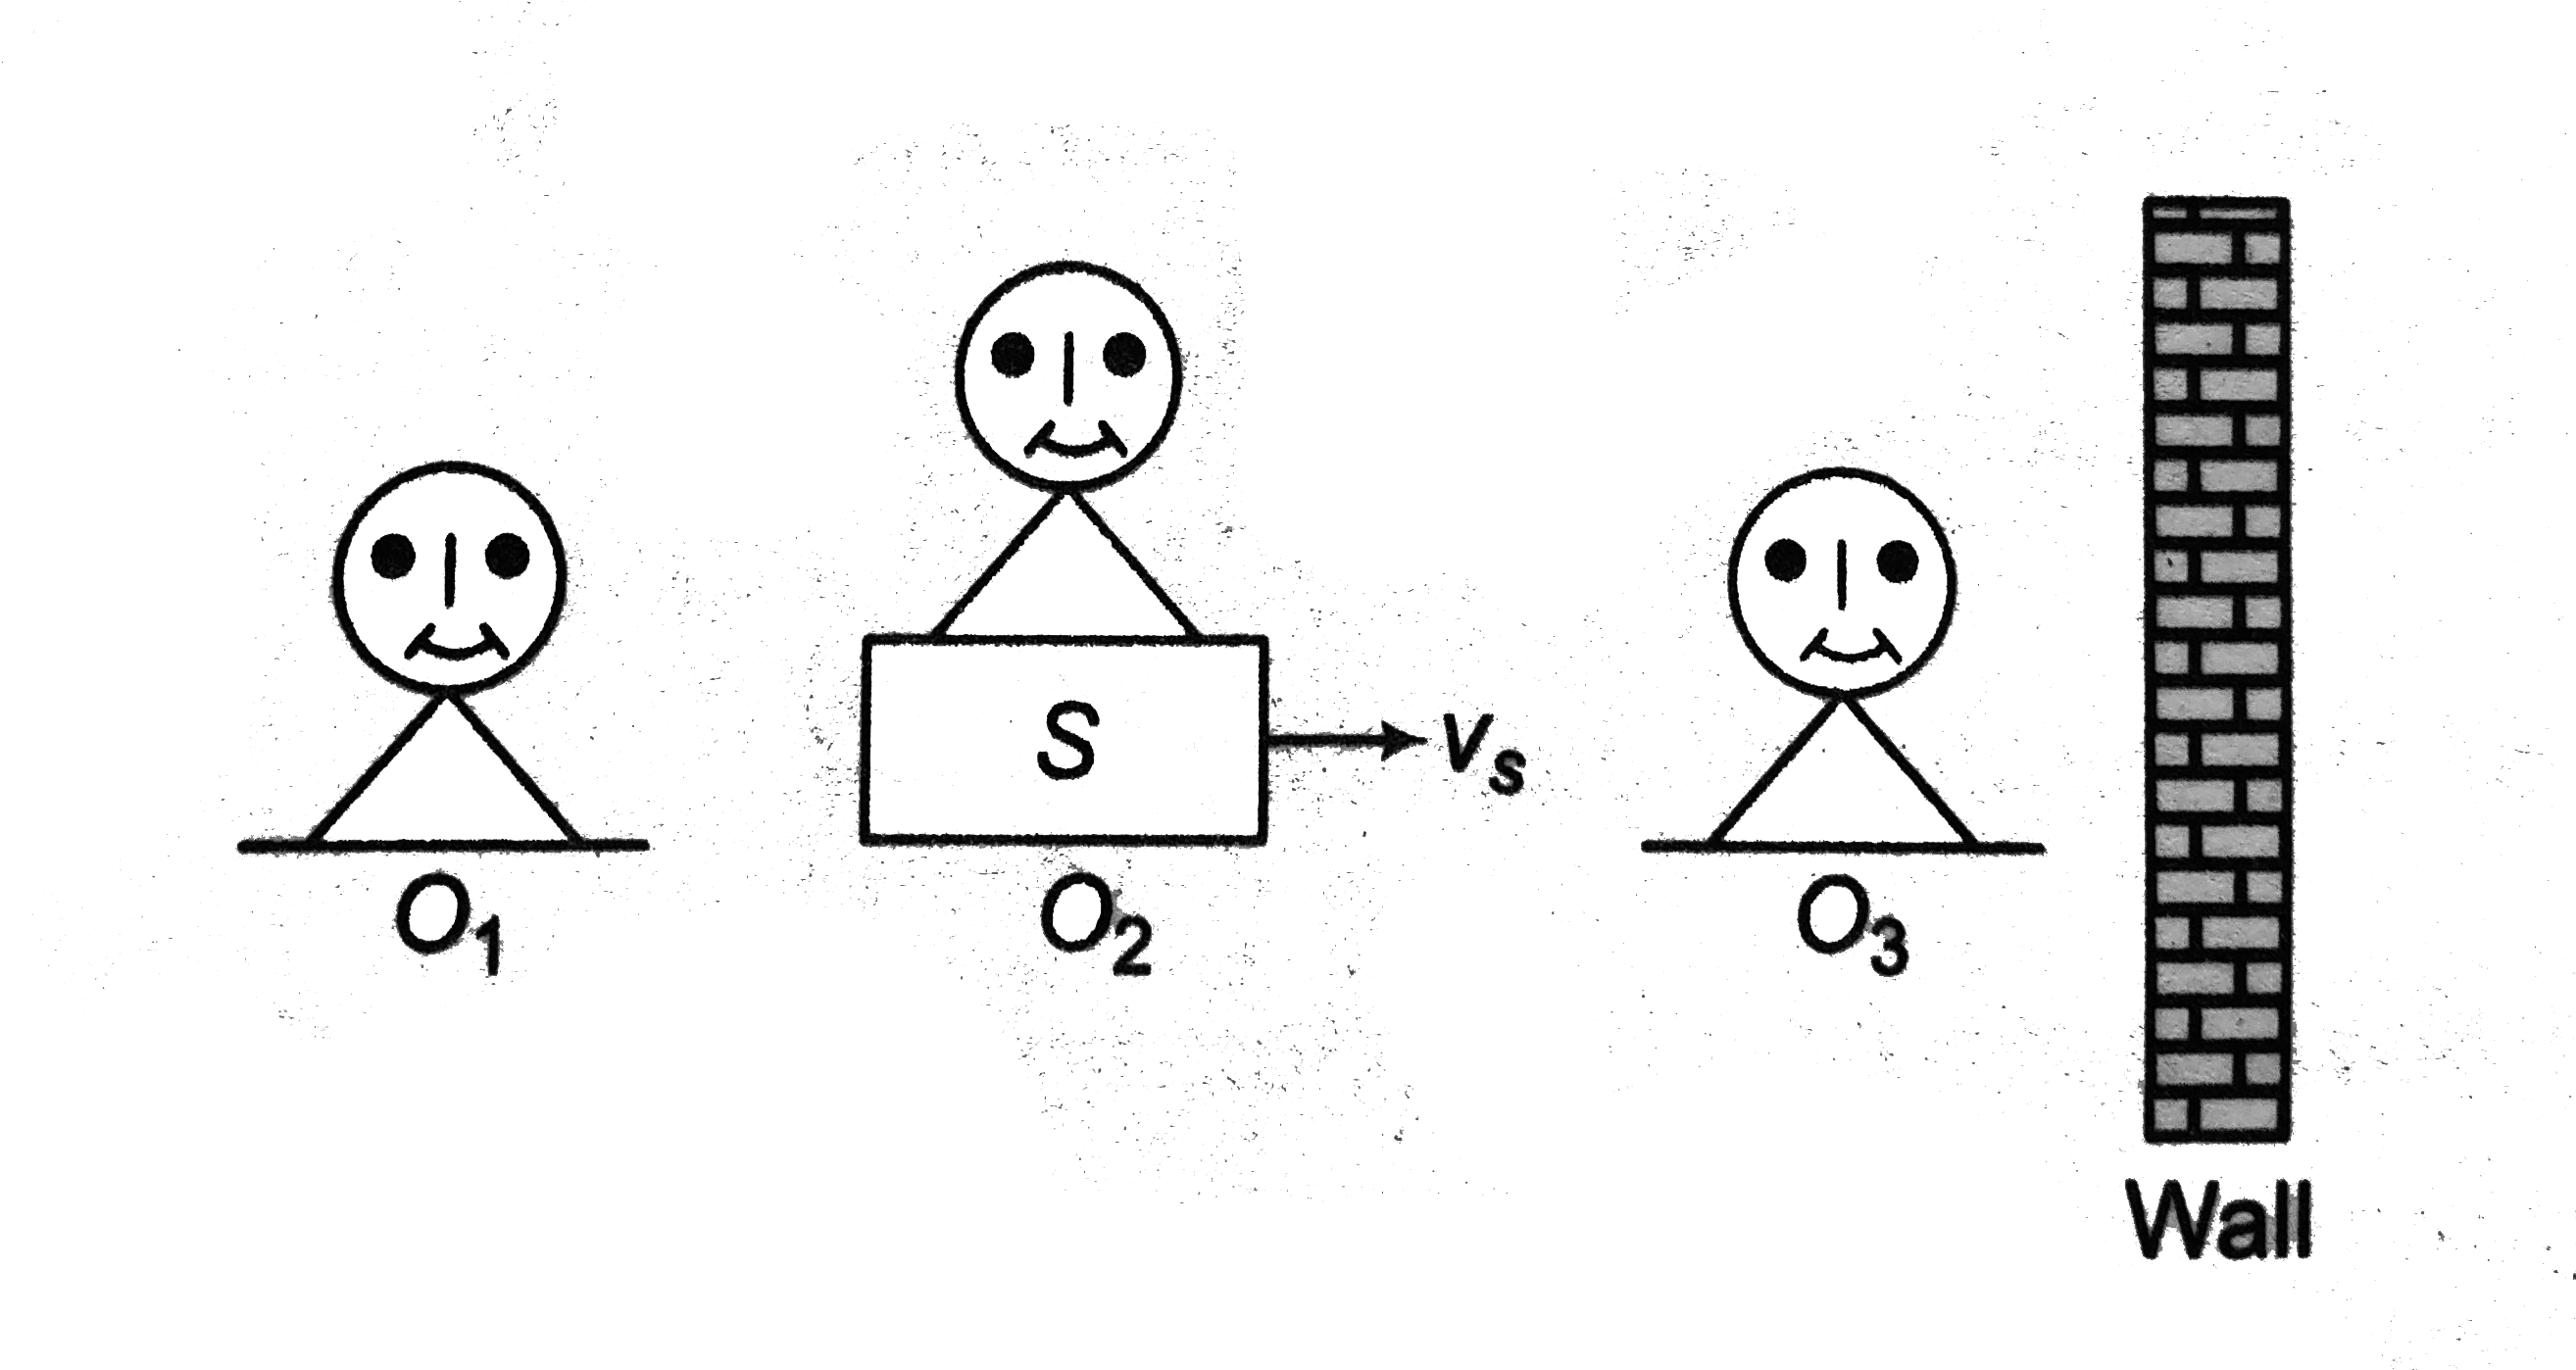
View SolutionA source of sound of frequency f is approaching towards a wall with speed υs . Speed of sound is υ . Three observers O1 , O2 and O3 are at different locations as shown . Find the beat frequency as observed by three different observers.

View SolutionA source of sound of frequency 500 Hz is moving towards an observer with velocity 30 m/s . The speed of sound is 330 m/s . the frequency heard by the observer will be
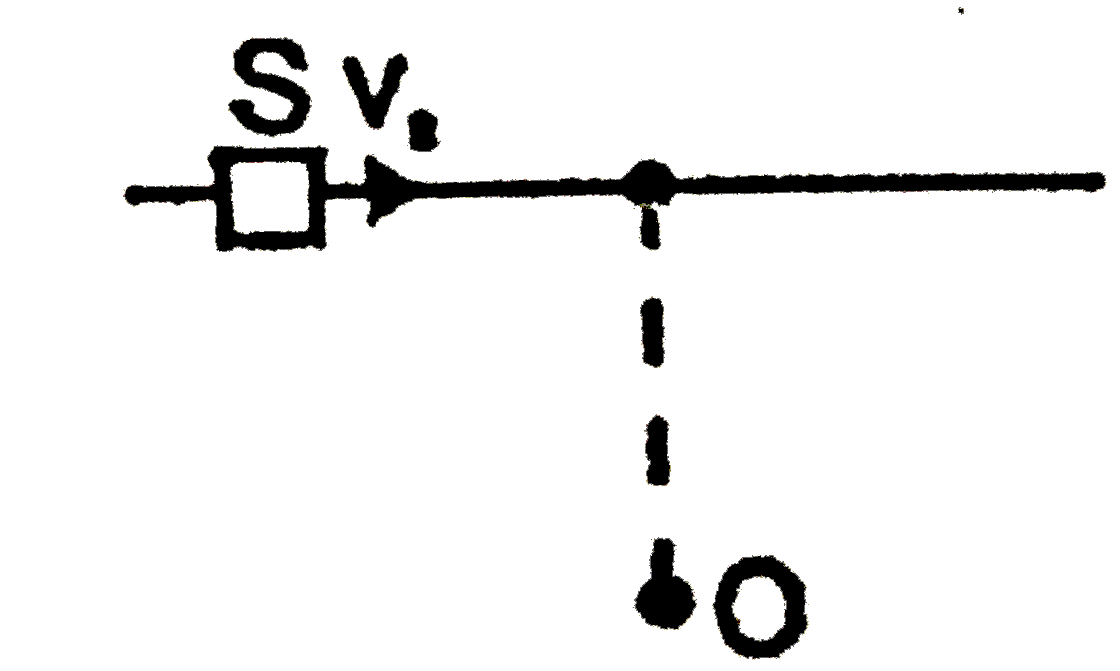
View SolutionThe source (S) of sound is moving constant velocity v0 as shown in diagram. An observer O listens to the sound emmited by the source. The observed frequency of the sound

View SolutionA source is approaching towards an observer with constant speed along the line joining them. After crossing the observer, source recedes from observer with same speed. Let f is apparent frequency heard by observer. Then, 1) f will keep on increasing during approaching 2) f will keep on decreasing during receding 3) f will remain constant during approaching 4) f will remain constant during receding
View SolutionWhen a source of frequency f0 moves away from a stationary observer with a certain velocity, an apparent frequency f' is observed. When it moves with the same speed towards the observer, the observed frequecy is 1.2f'. If the velocity of sound is v, then the acutual frequency f0 is
View SolutionA source of frequency 'f' is stationary and an obsercer starts moving towards it at t=0 with constant small acceleration. Then the variation of observed frequency 'f' registered by the observer with time is best represented as
View Solution