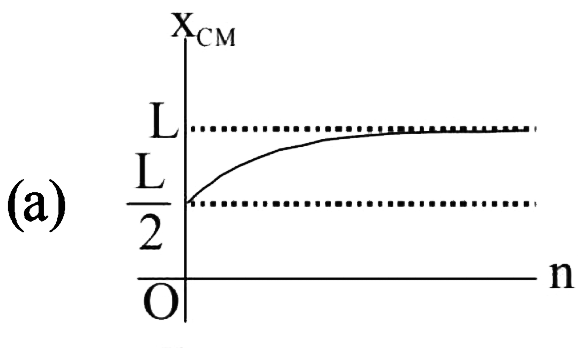
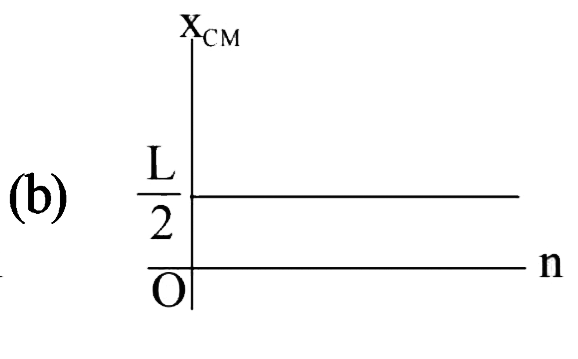
A thin rod of length L is lying along the x-axis with its ends at x = 0 and x = L. Its linear density (mass/length) varies with x as where n can be zero or any positive number. If the position of the centre of mass of the rod is plotted against n, which of the following graphs best approximates the dependence of on n?


The correct Answer is:A
(a) When n= 0,x =k where k is a constant. This means
thet the linear mass density is constant. In this cases
the centre of mass will be at the midelle of the rod ie at
. Therefore (c ) is ruled out
n is positive and as its value increases, the rate of
increase of linear mass density with increase in
x increase. This shows that the centre of mass will
shift towards that end of the rod where n=L as the
value of n increases. Therefore graph (b) is ruled out.
The linear mass density
With increase in the value of n, the centre of mass shift
towads the end x=L such thet first the shifting is at a
higher rate with increase in the value of n and then the
rate decreases with the value of n.
These characteristics are represented by graph (a).
Topper's Solved these Questions
- ROTATIONAL MOTIONBOOK - SUNIL BATRA (41 YEARS IITJEE PHYSICS)CHAPTER - ROTATIONAL MOTIONEXERCISE - MCQs with one correct answer
1 Videos
- MOTIONBOOK - SUNIL BATRA (41 YEARS IITJEE PHYSICS)CHAPTER - MOTIONEXERCISE - JEE Main And Advanced
63 Videos
- SIMPLE HARMONIC MOTIONBOOK - SUNIL BATRA (41 YEARS IITJEE PHYSICS)CHAPTER - SIMPLE HARMONIC MOTIONEXERCISE - JEE Main And Advanced
69 Videos
Similar Questions
A thin rod of length 6m is lying along the x-axis with its ends at x=0 and x=6m. It linear density (mass/length) varies with x as kx4. Find the position of centre of mass of rod in meters.
View SolutionA rod of length L is placed along the x-axis between x = 0 and x = L. The linear density (mass/ length) λ of the rod varies with the distance x from the origin as λ=Rx. Here, R is a positive constant. Find the position of centre of mass of this rod.
View Solution
Knowledge Check
A thin rod of length L is lying along the x-axis with its ends at x = 0 and x = L. Its linear density (mass/length) varies with x as k(xL)n where n can be zero or any positive integer. If position Xcm of centre of mass of the rod is plotted against n, which of the following graphs best approximates the dependence of xCM on n?
A B
B C
C D
D
A thin rod of length 6 m is lying along the x-axis with its ends at x=0 and x=6m. Its linear density *mass/length ) varies with x as kx4. Find the position of centre of mass of rod in meters.
A5mB3mC2mD4m
A rod of length L is placed along the x-axis between x = 0 and x = L. The linear density (mass/length) λ of the rod varies with the distance x from the origin as λ = Rx. Here, R is a positive constant. Find the position of centre of mass of this rod.
View SolutionA rod of length L is placed along the x-axis between x=0 and x=L. The linear mass density (mass/length) ρ of the rod varies with the distance x from the origin as ρ=a+bx. Here, a and b are constants. Find the position of centre of mass of this rod.
View SolutionA rod of length L is placed along the x-axis between x=0 and x=L. The linear mass density is λ such that λ=a+bx. Find the mass of the rod.
View SolutionA rod of length L is placed along the X-axis between x=0andx=L. The linear density (mass/length) ρ of the rod varies with the distance x from the origin as ρj=a+bx. a. Find the SI units of a and b. b. Find the mass of the rod in terms of a,b, and L.
View SolutionThe mass per unit length of a non- uniform rod OP of length L varies as m=k(x)/(L) where k is a constant and x is the distance of any point on the rod from end 0 .The distance of the centre of mass of the rod from end 0 is
View SolutionIf linear density of a rod of length 3m varies as λ=2+x, them the position of the centre of gravity of the rod is
View Solution
