Choose the correct option for the graph between the frequency of incident light and the stopping potential.
It is a parabola
It is a straight line
It is a hyperbola
It is a circle
The correct Answer is:B
hv=hv0+12(mv2)max
But,(12mv2)max=eVS∴VS=hve−hev0
Hence, it is a straight line.
Topper's Solved these Questions
- CATHODE RAY, PHOTOELECTRIC EFFECT AND X-RAYSBOOK - BITSAT GUIDECHAPTER - CATHODE RAY, PHOTOELECTRIC EFFECT AND X-RAYSEXERCISE - BITSAT Archives
6 Videos
- ATOMIC STRUCTUREBOOK - BITSAT GUIDECHAPTER - ATOMIC STRUCTUREEXERCISE - BITSAT Archives
4 Videos
- CURRENT ELECTRICITYBOOK - BITSAT GUIDECHAPTER - CURRENT ELECTRICITYEXERCISE - Bitsat Archives
26 Videos
Similar Questions
What, if any, is the effect of the (i) intensity (ii) frequency of incident radiation on the stopping potential in photoelectric emission?
View SolutionOf the following statement about the photoelectric effect, which are true and which are false?
(a) The greater the frequency of the incident light is, the greater is the stopping potential.
(b) The greater the intensity of the incident light is, the greater is the cutoff frequency.
(c) The greater the work function of the target material is, the greater is the stopping potential.
(d) The greater the work function of the target material is, the greater is the cutoff frequency.
(e) The greater the frequency of the incident light is, the greater is the maximum kinetic energy of the ejected electrons.
(f) The greater the energy of the photons is, the smaller is the stopping potential.
View Solution
Knowledge Check
Which of the following is the graph between the frequency (v) of the incident radiations and the stopping potential ?
A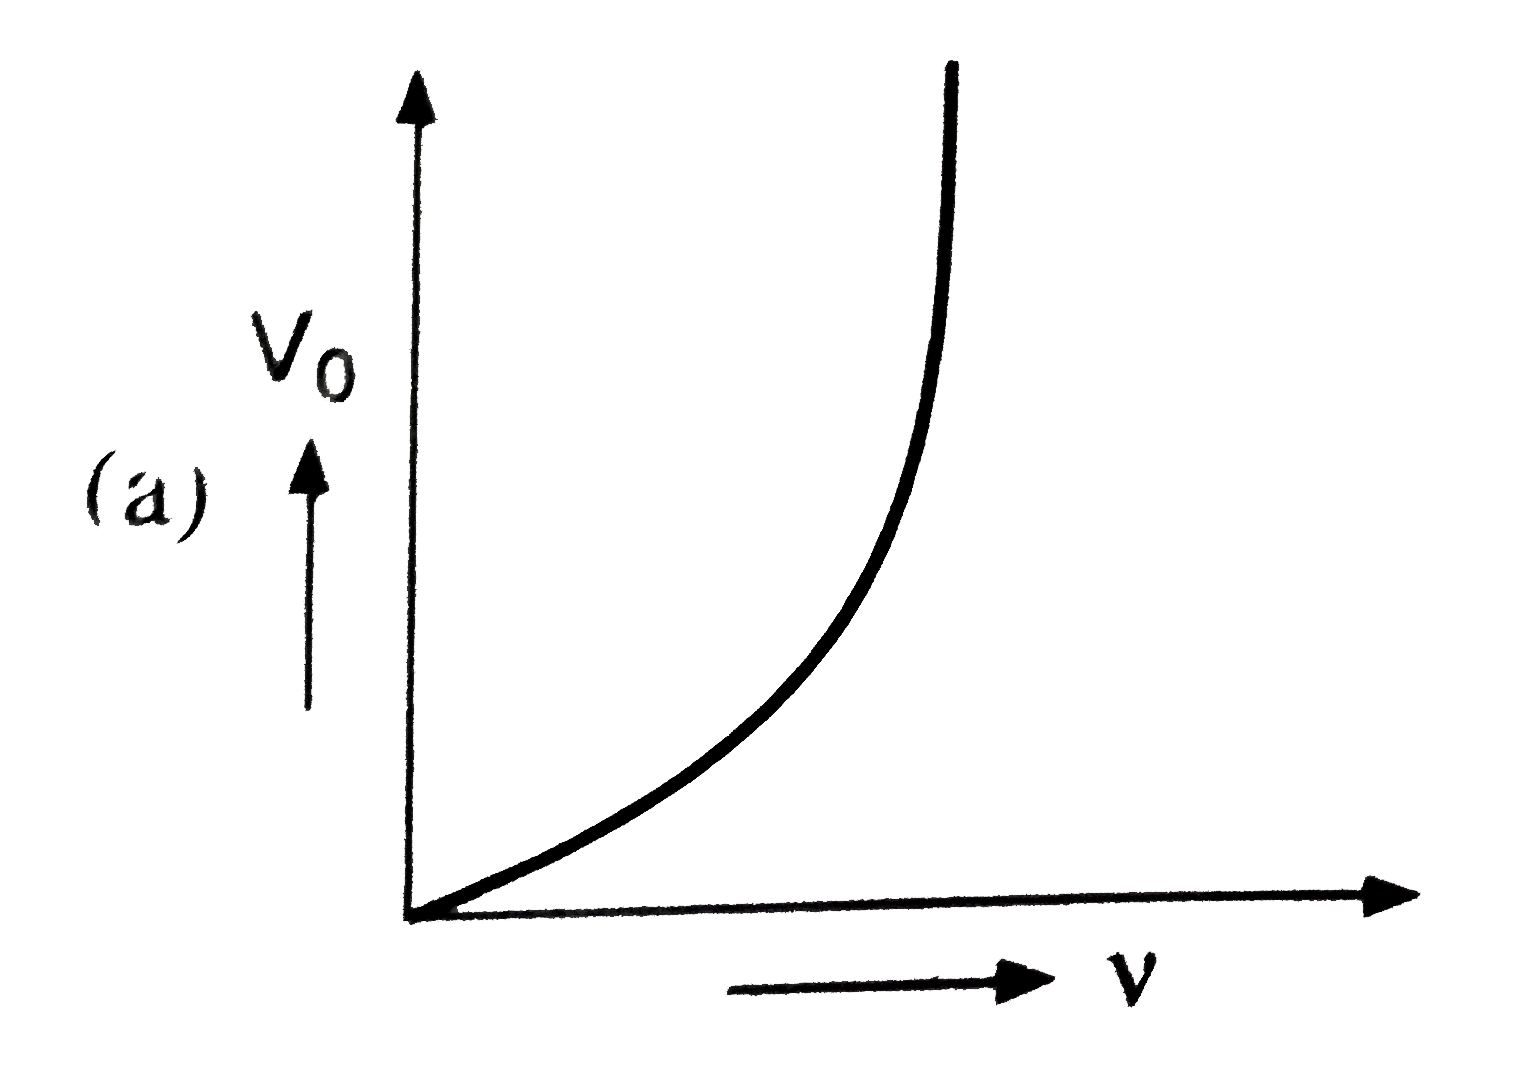 B
B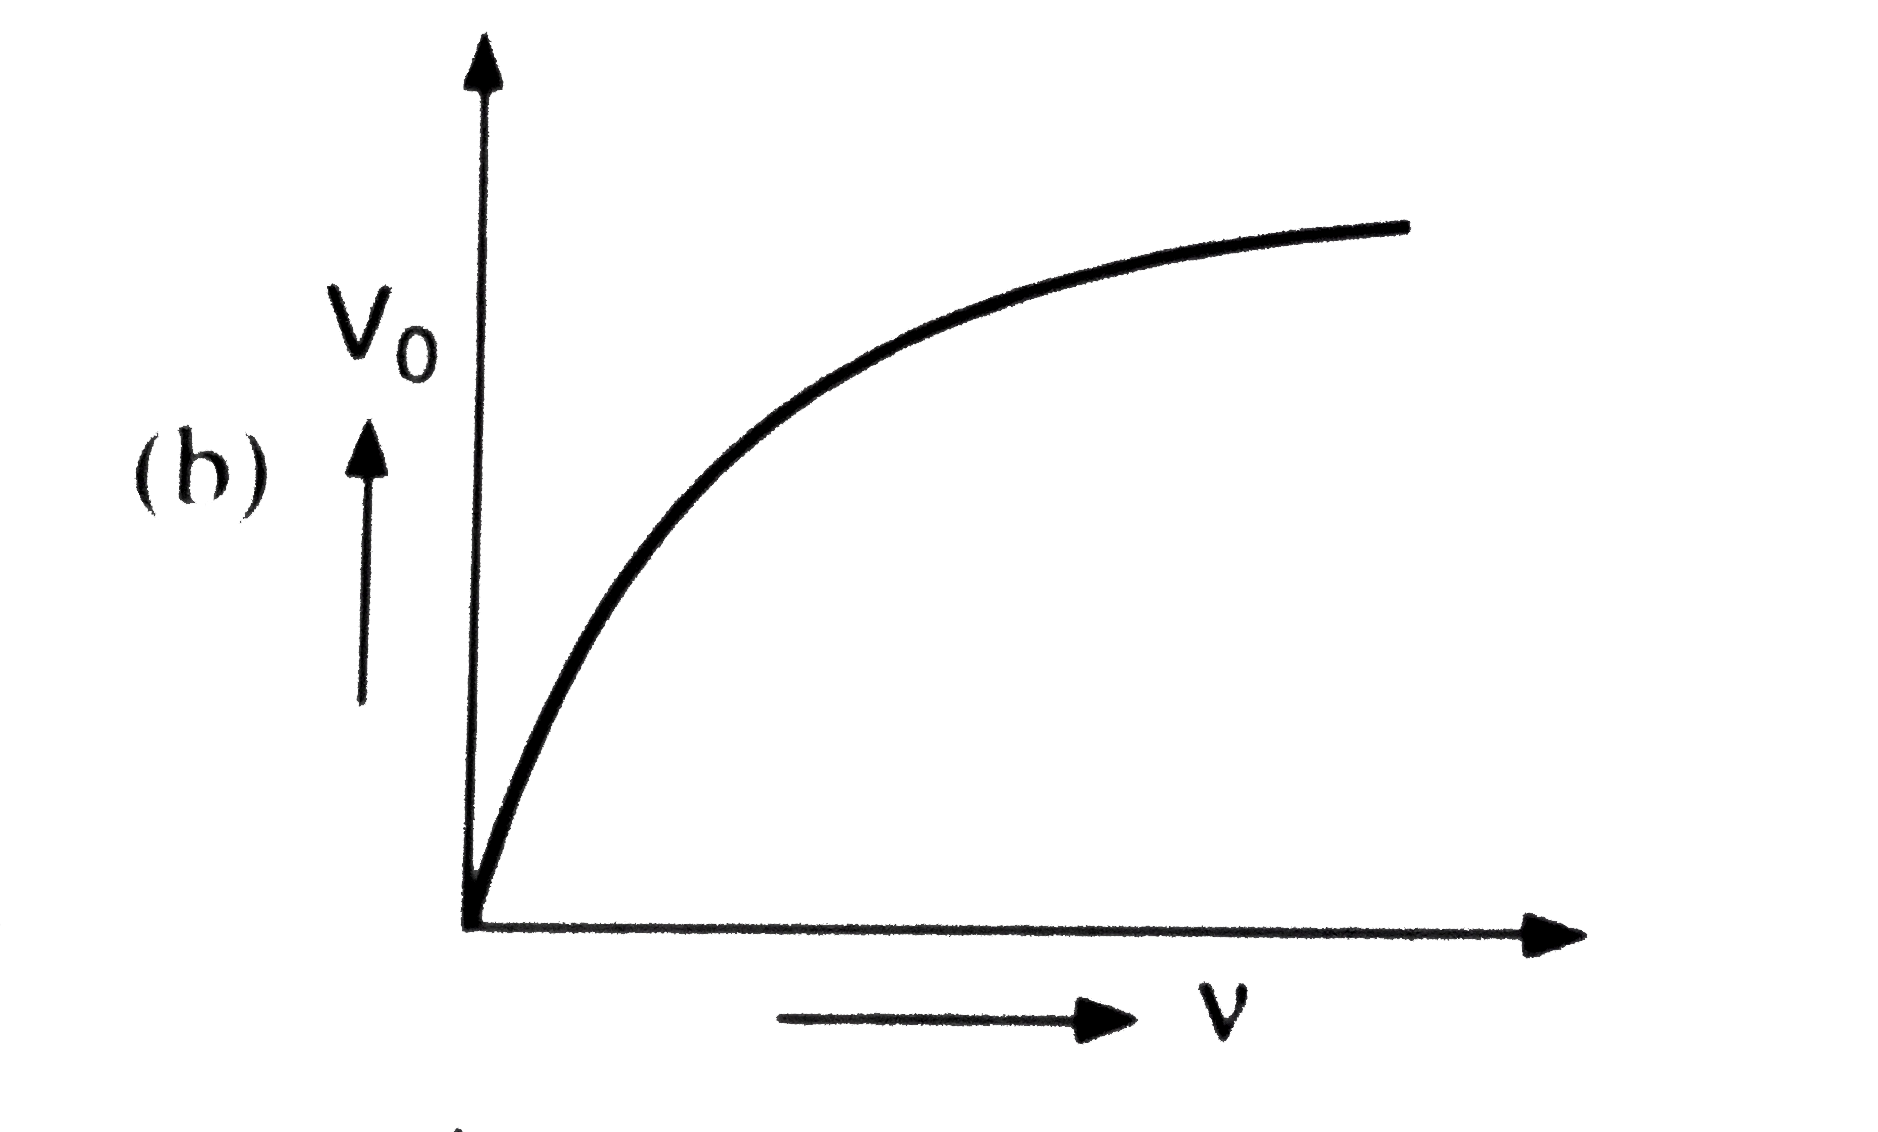 C
C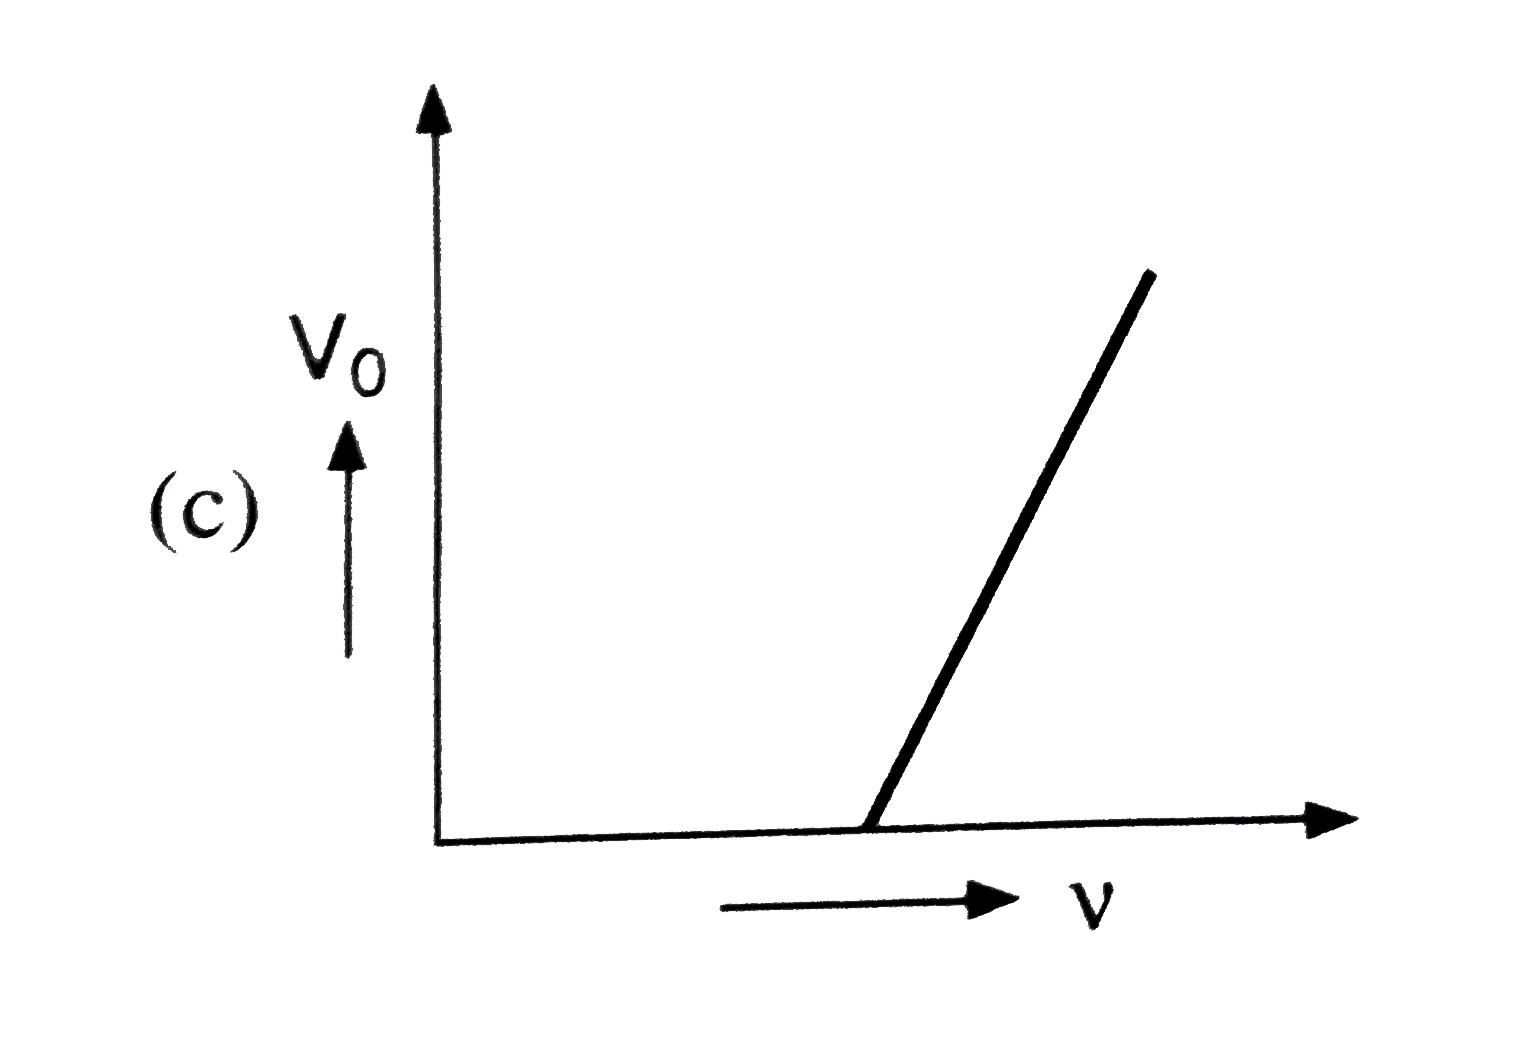 D
D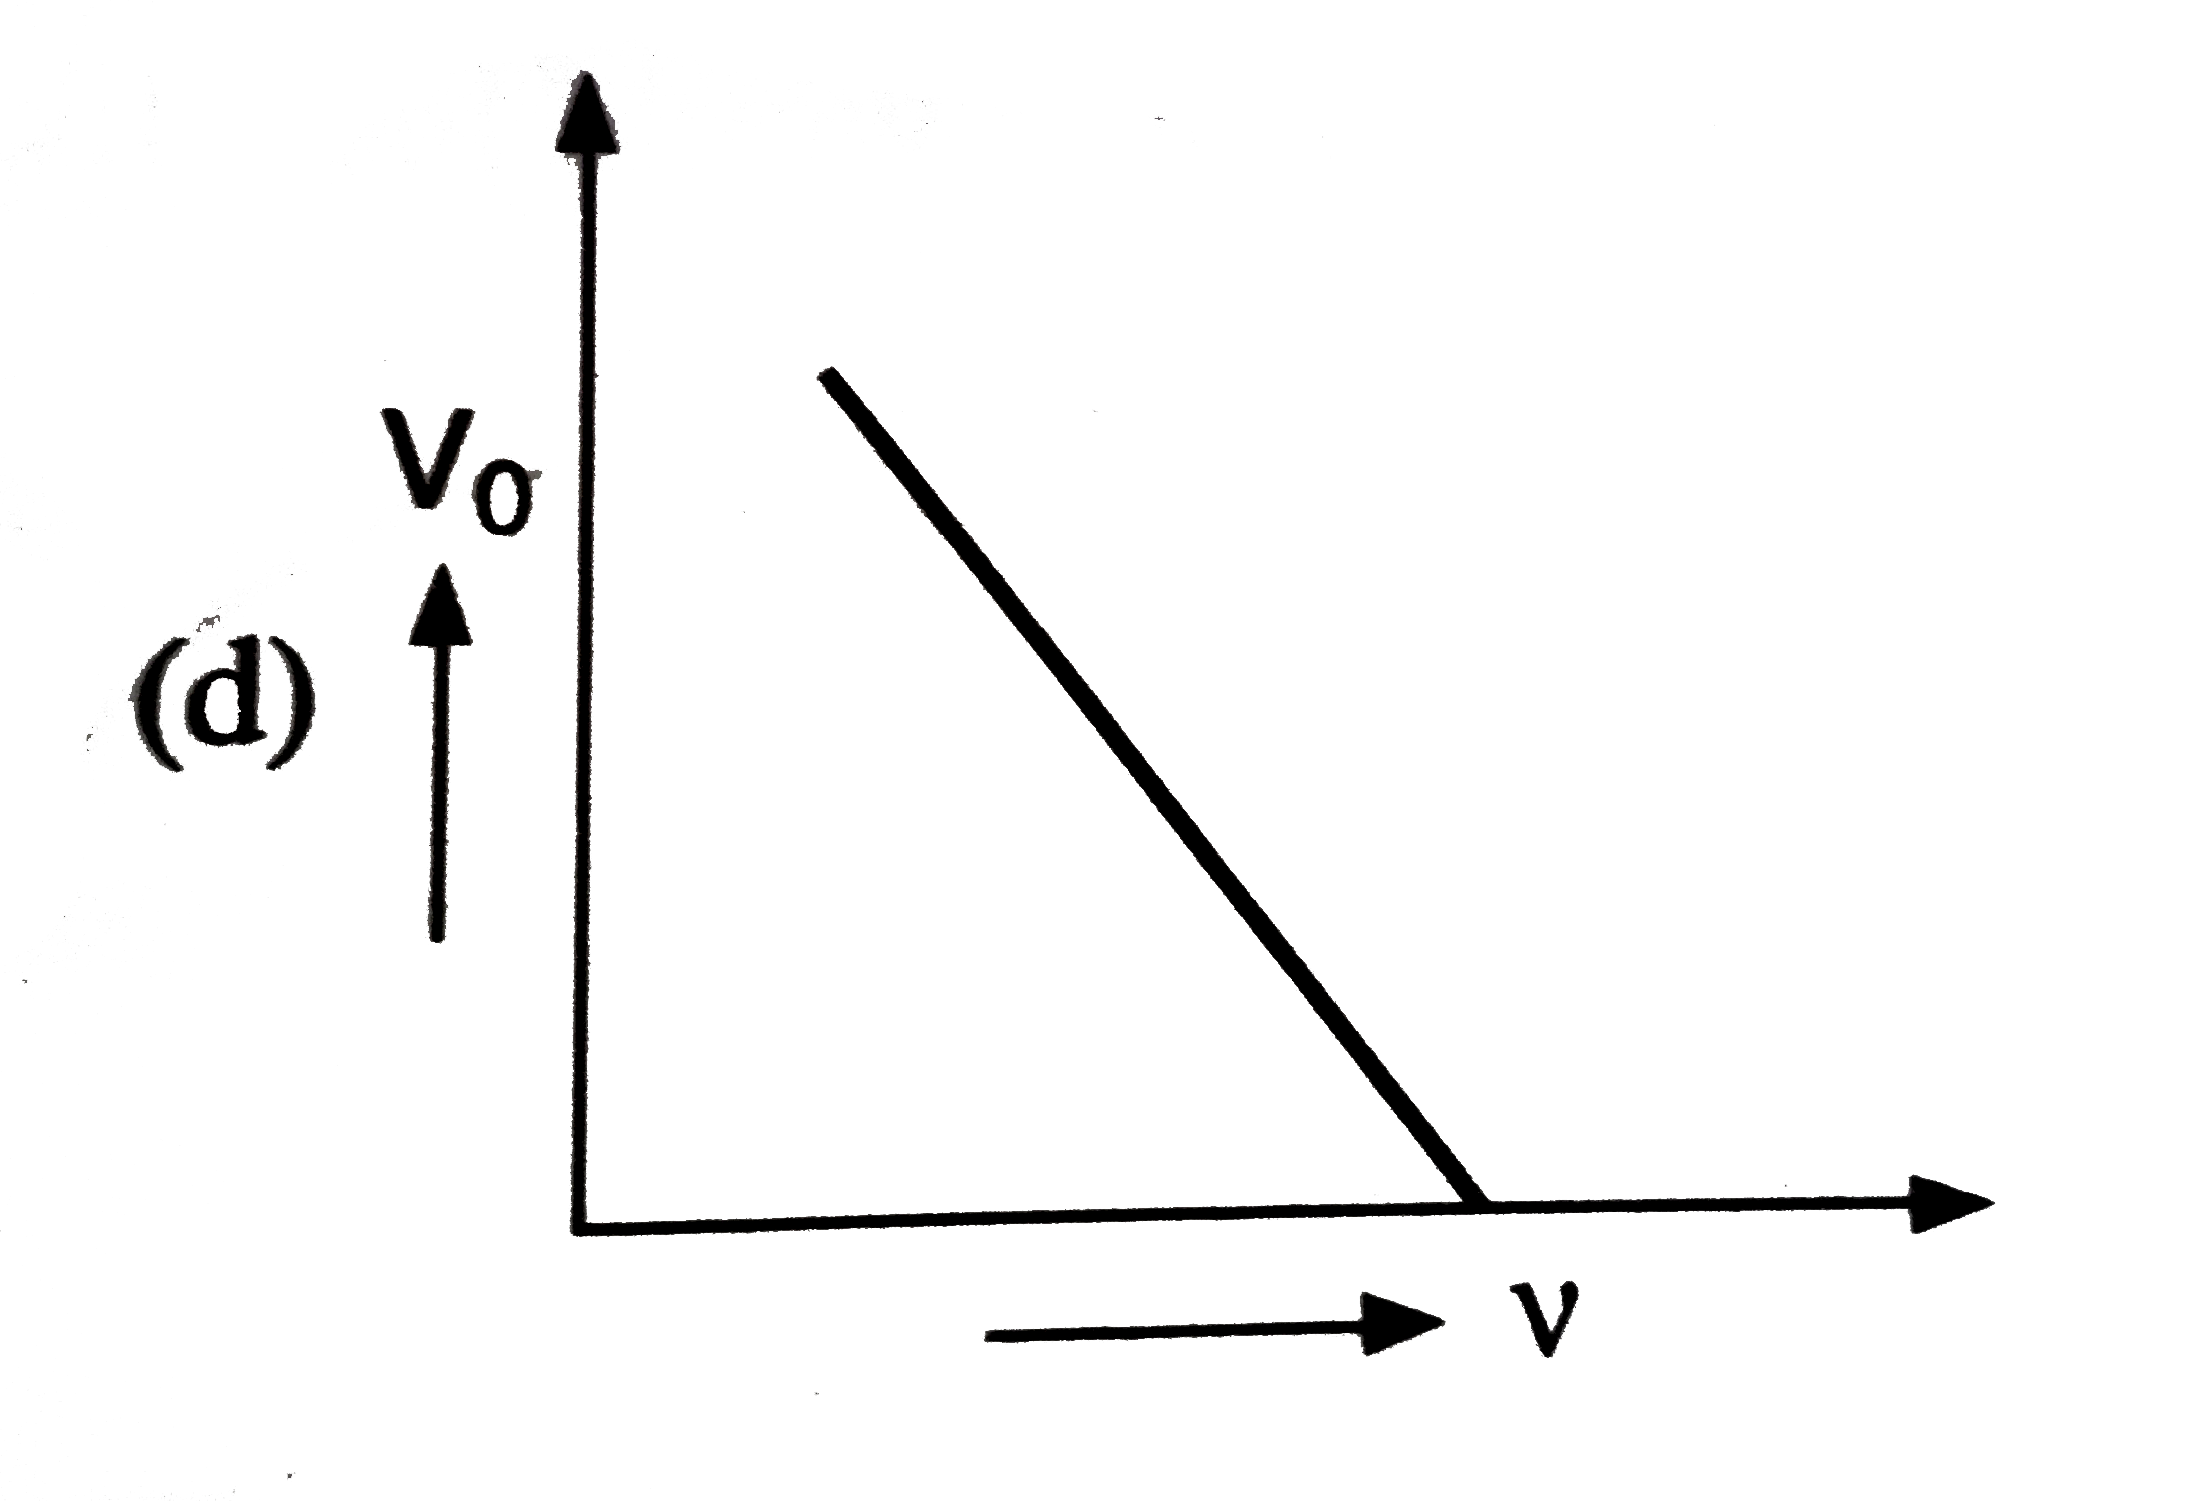
The slope of frequency of incident light and stopping potential for a given surface will be
AhBh/eCehDeAssertion : The stopping potential depends on the frequency of incident light.
Reason : The stopping potential is related to maximum kinetic energy by eV0=Kmax.AIf both assertion and reason are true and reason is the correct explanation of assertion.BIf both assertion and reason are true but reason is not the correct explanation of assertion.CIf assertion is true but reason is false.DIf both assertion and reason are false.
What is the effect of decrease in frequency of incident radiation on the stopping potential in photoelectric emission?
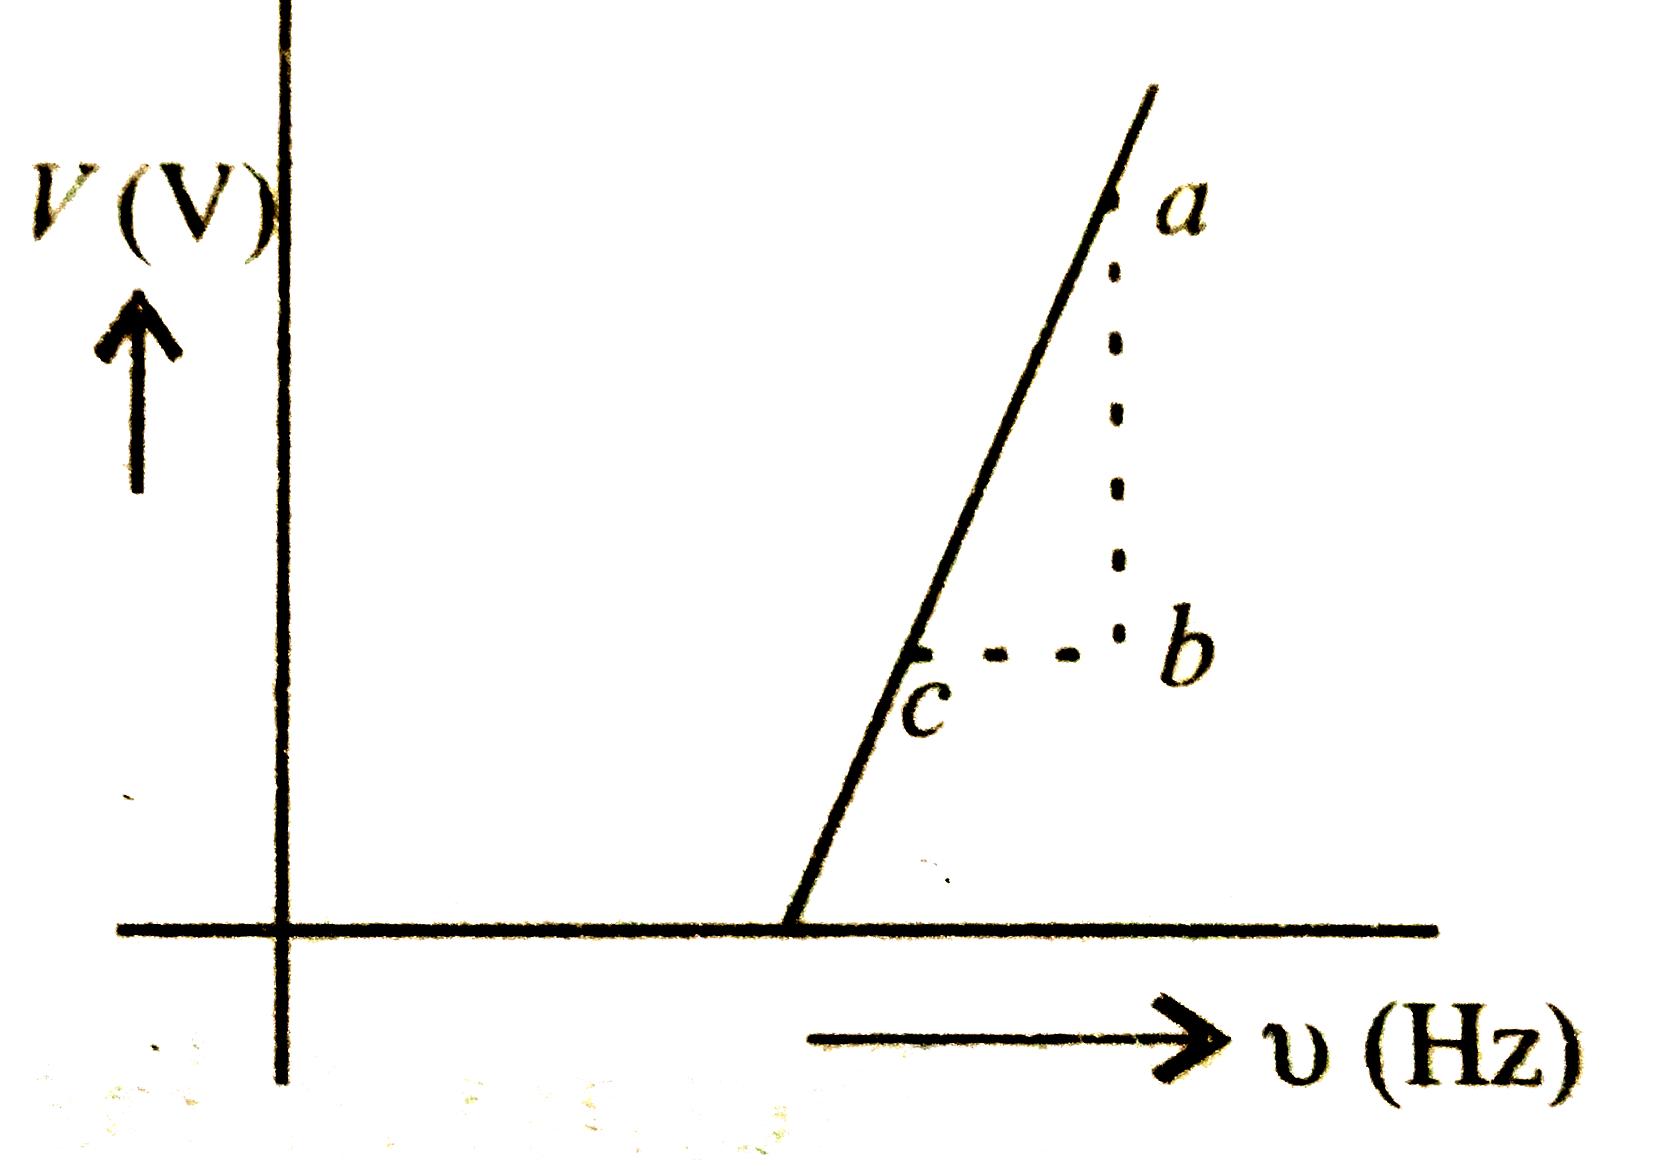
View SolutionIn a photoelectric experiment, the graph of frequency v of incident light (in Hz) and stopping potential V (in V) is as shown in the figure. Planck's constant is (e is the elementary charge)
View SolutionThe photoelectric work function of the emitter of a photocell is 3.63 eV . The frequency of incident light radiation if the stopping potential of the emitter is 3 volt , is
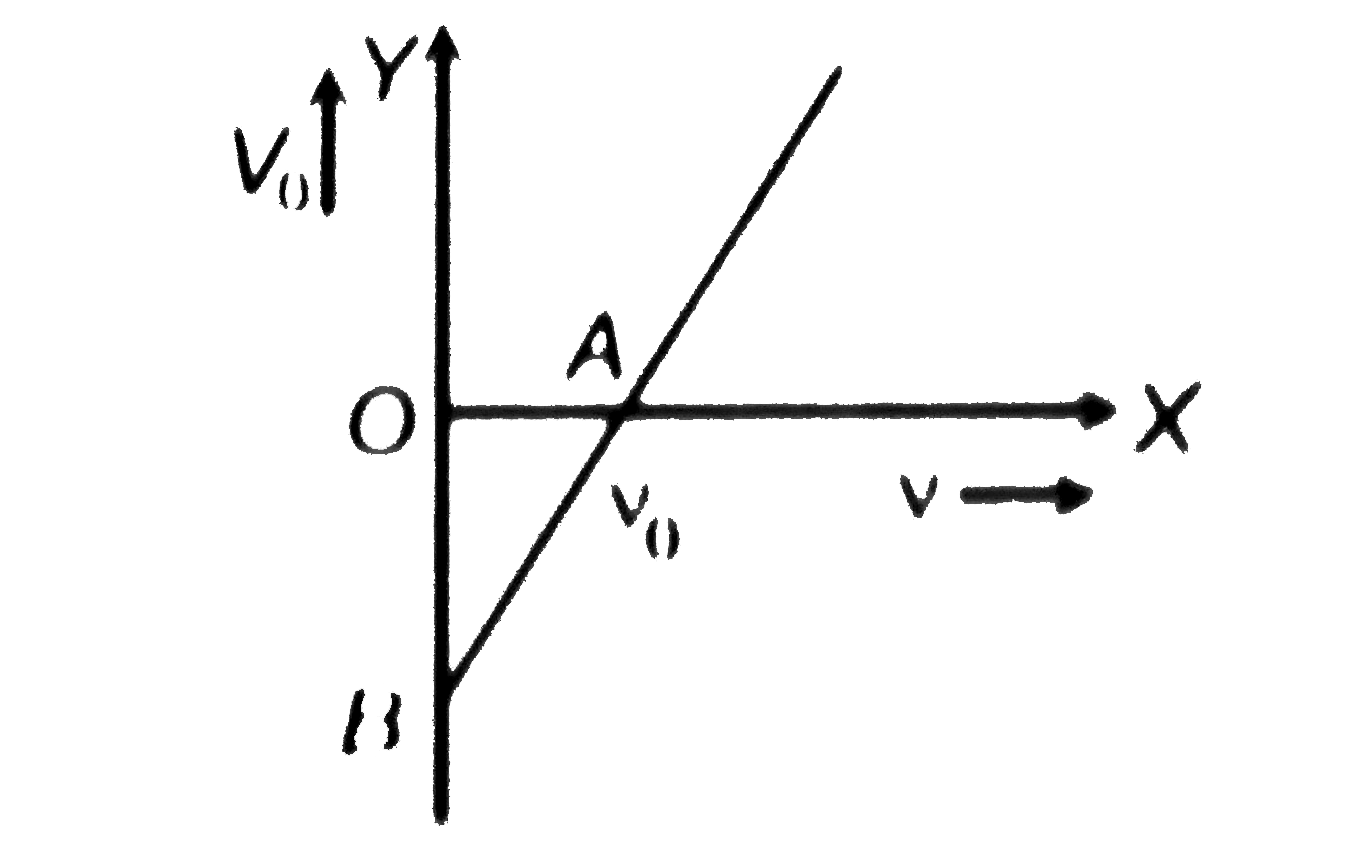
View SolutionIn an experiment on photoelectric effect the frequency f of the incident light is plotted against the stopping potential V0. The work function of the metal is given by ( e is the electronic charge)
View SolutionRead the following statements and choose the correct option.
(A) The angle made by the incident light ray with the plane of mirror is equal to the angle made by the reflected light ray with the plane of mirror.
(B) The angle between an incident light ray and a reflected light ray is twice that of the angle between the incident light ray and normal.
View Solution
