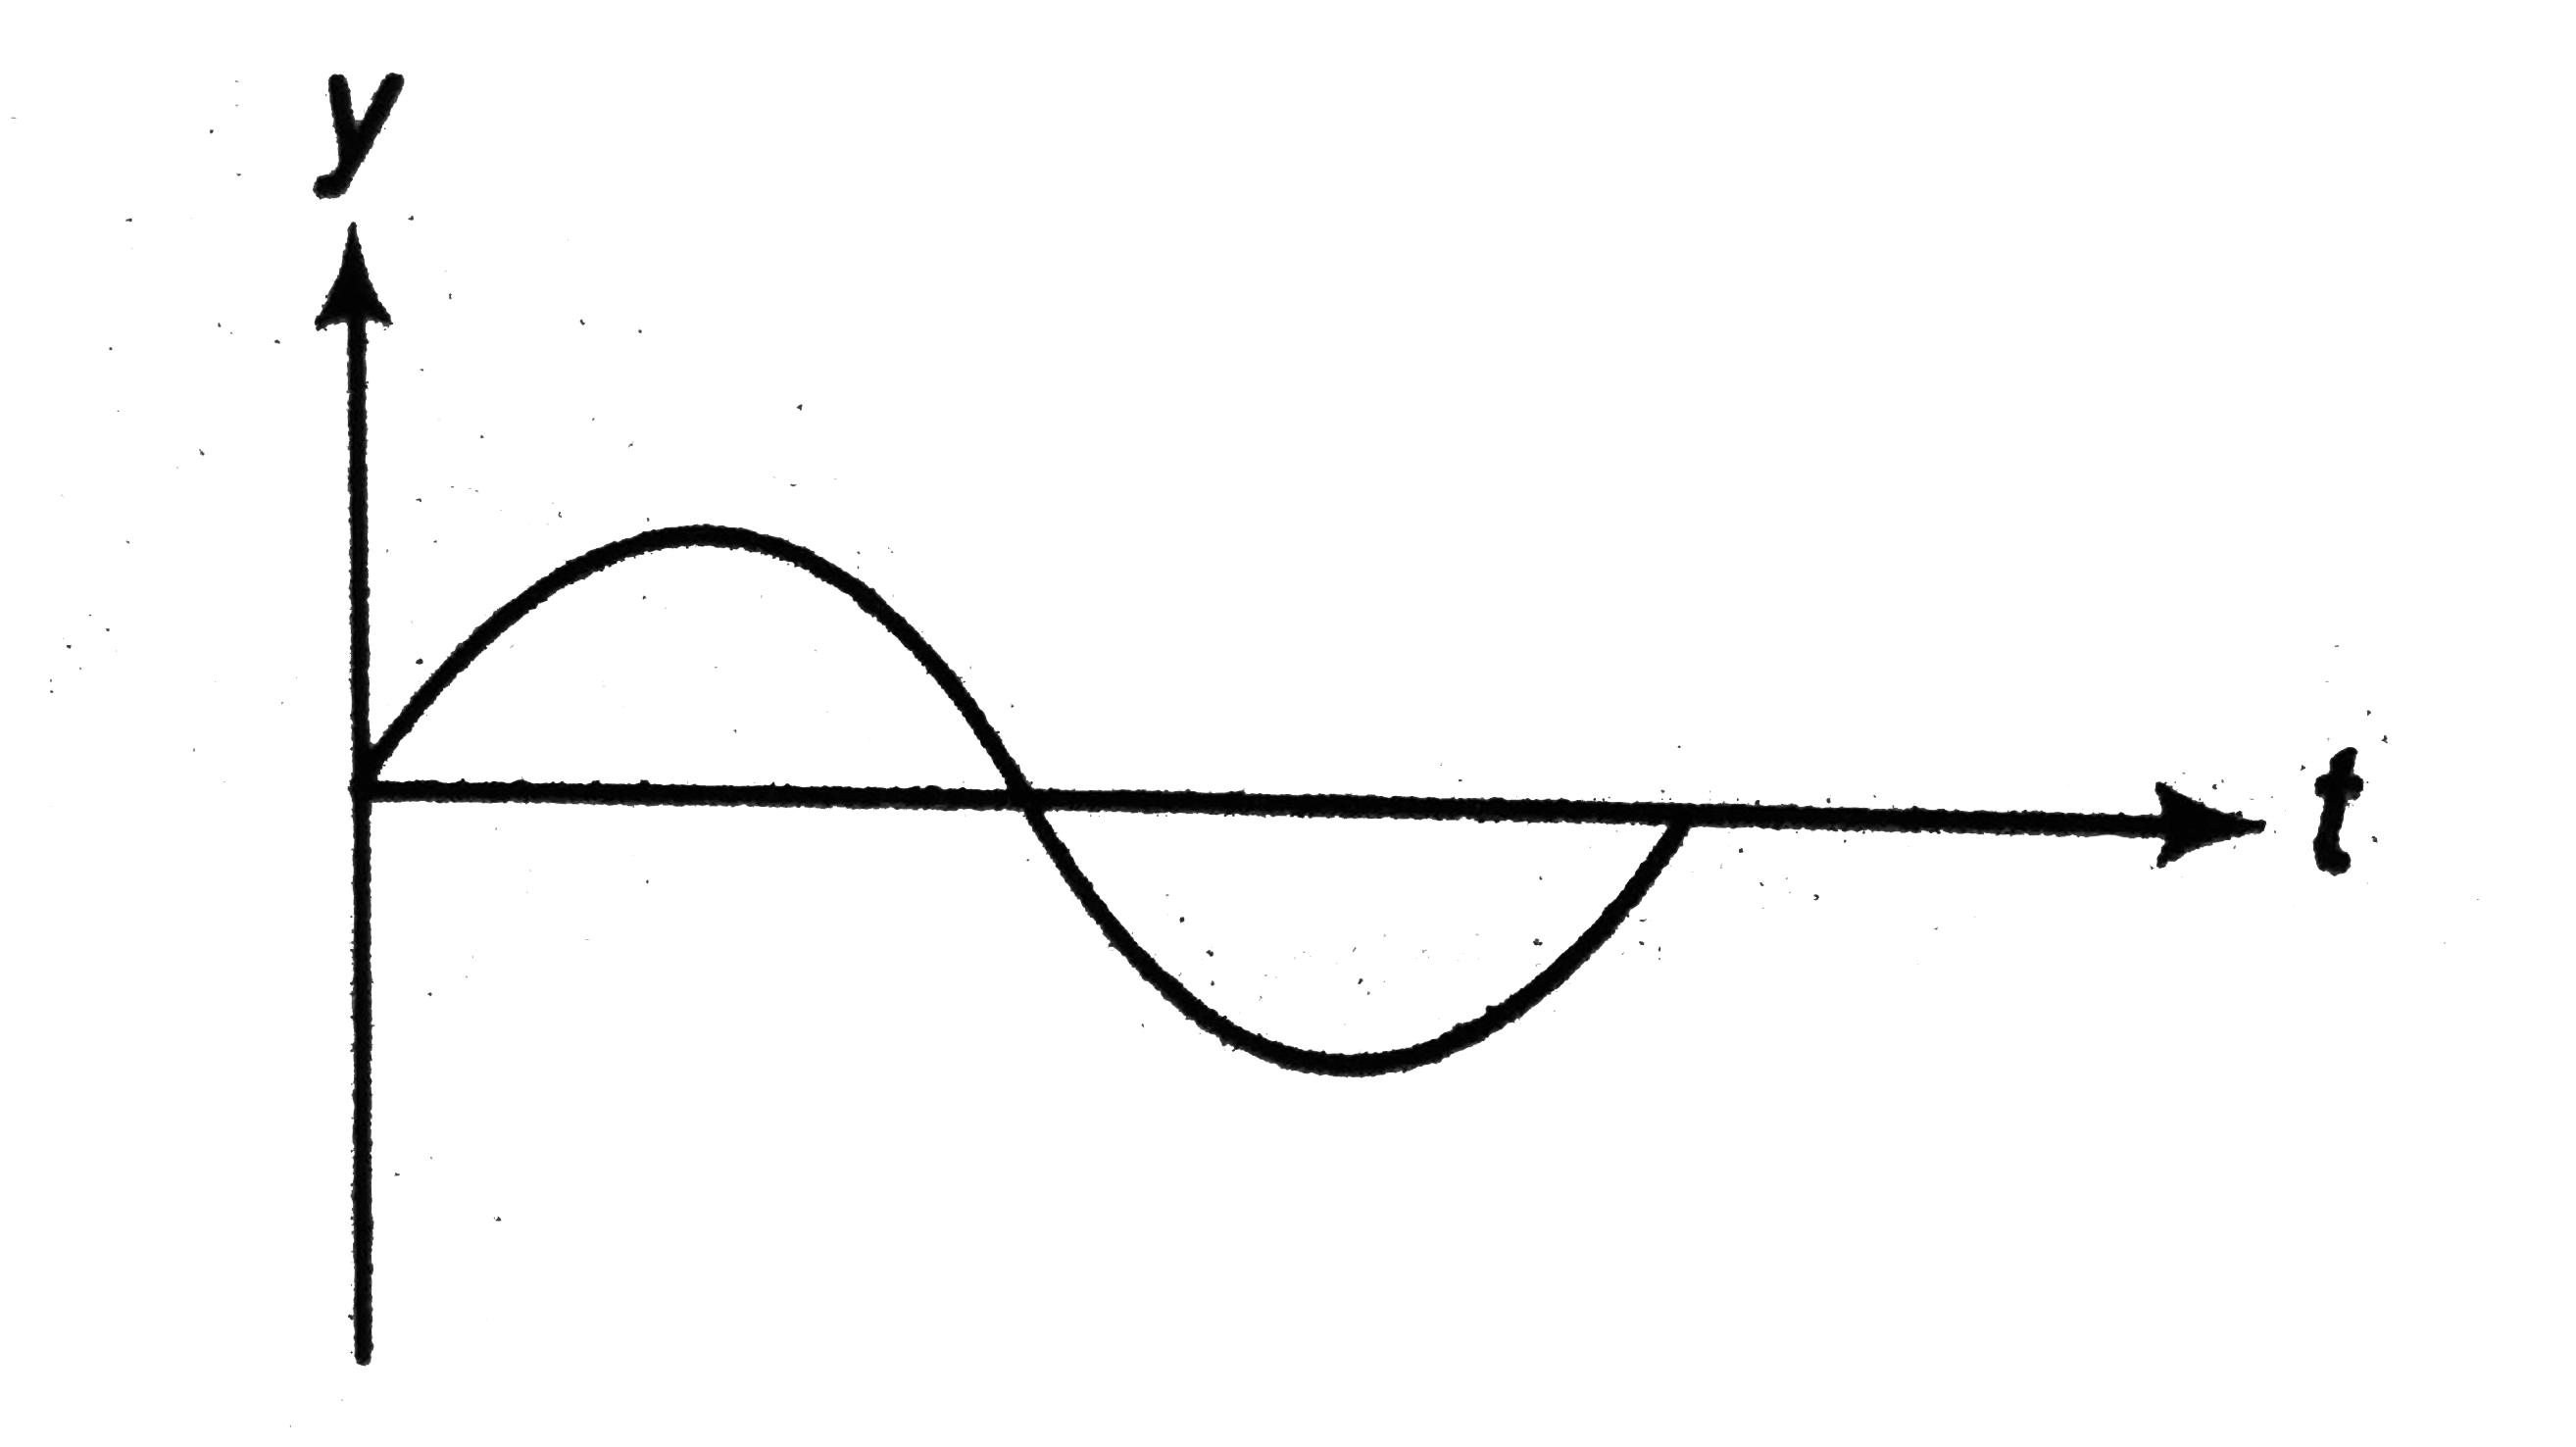
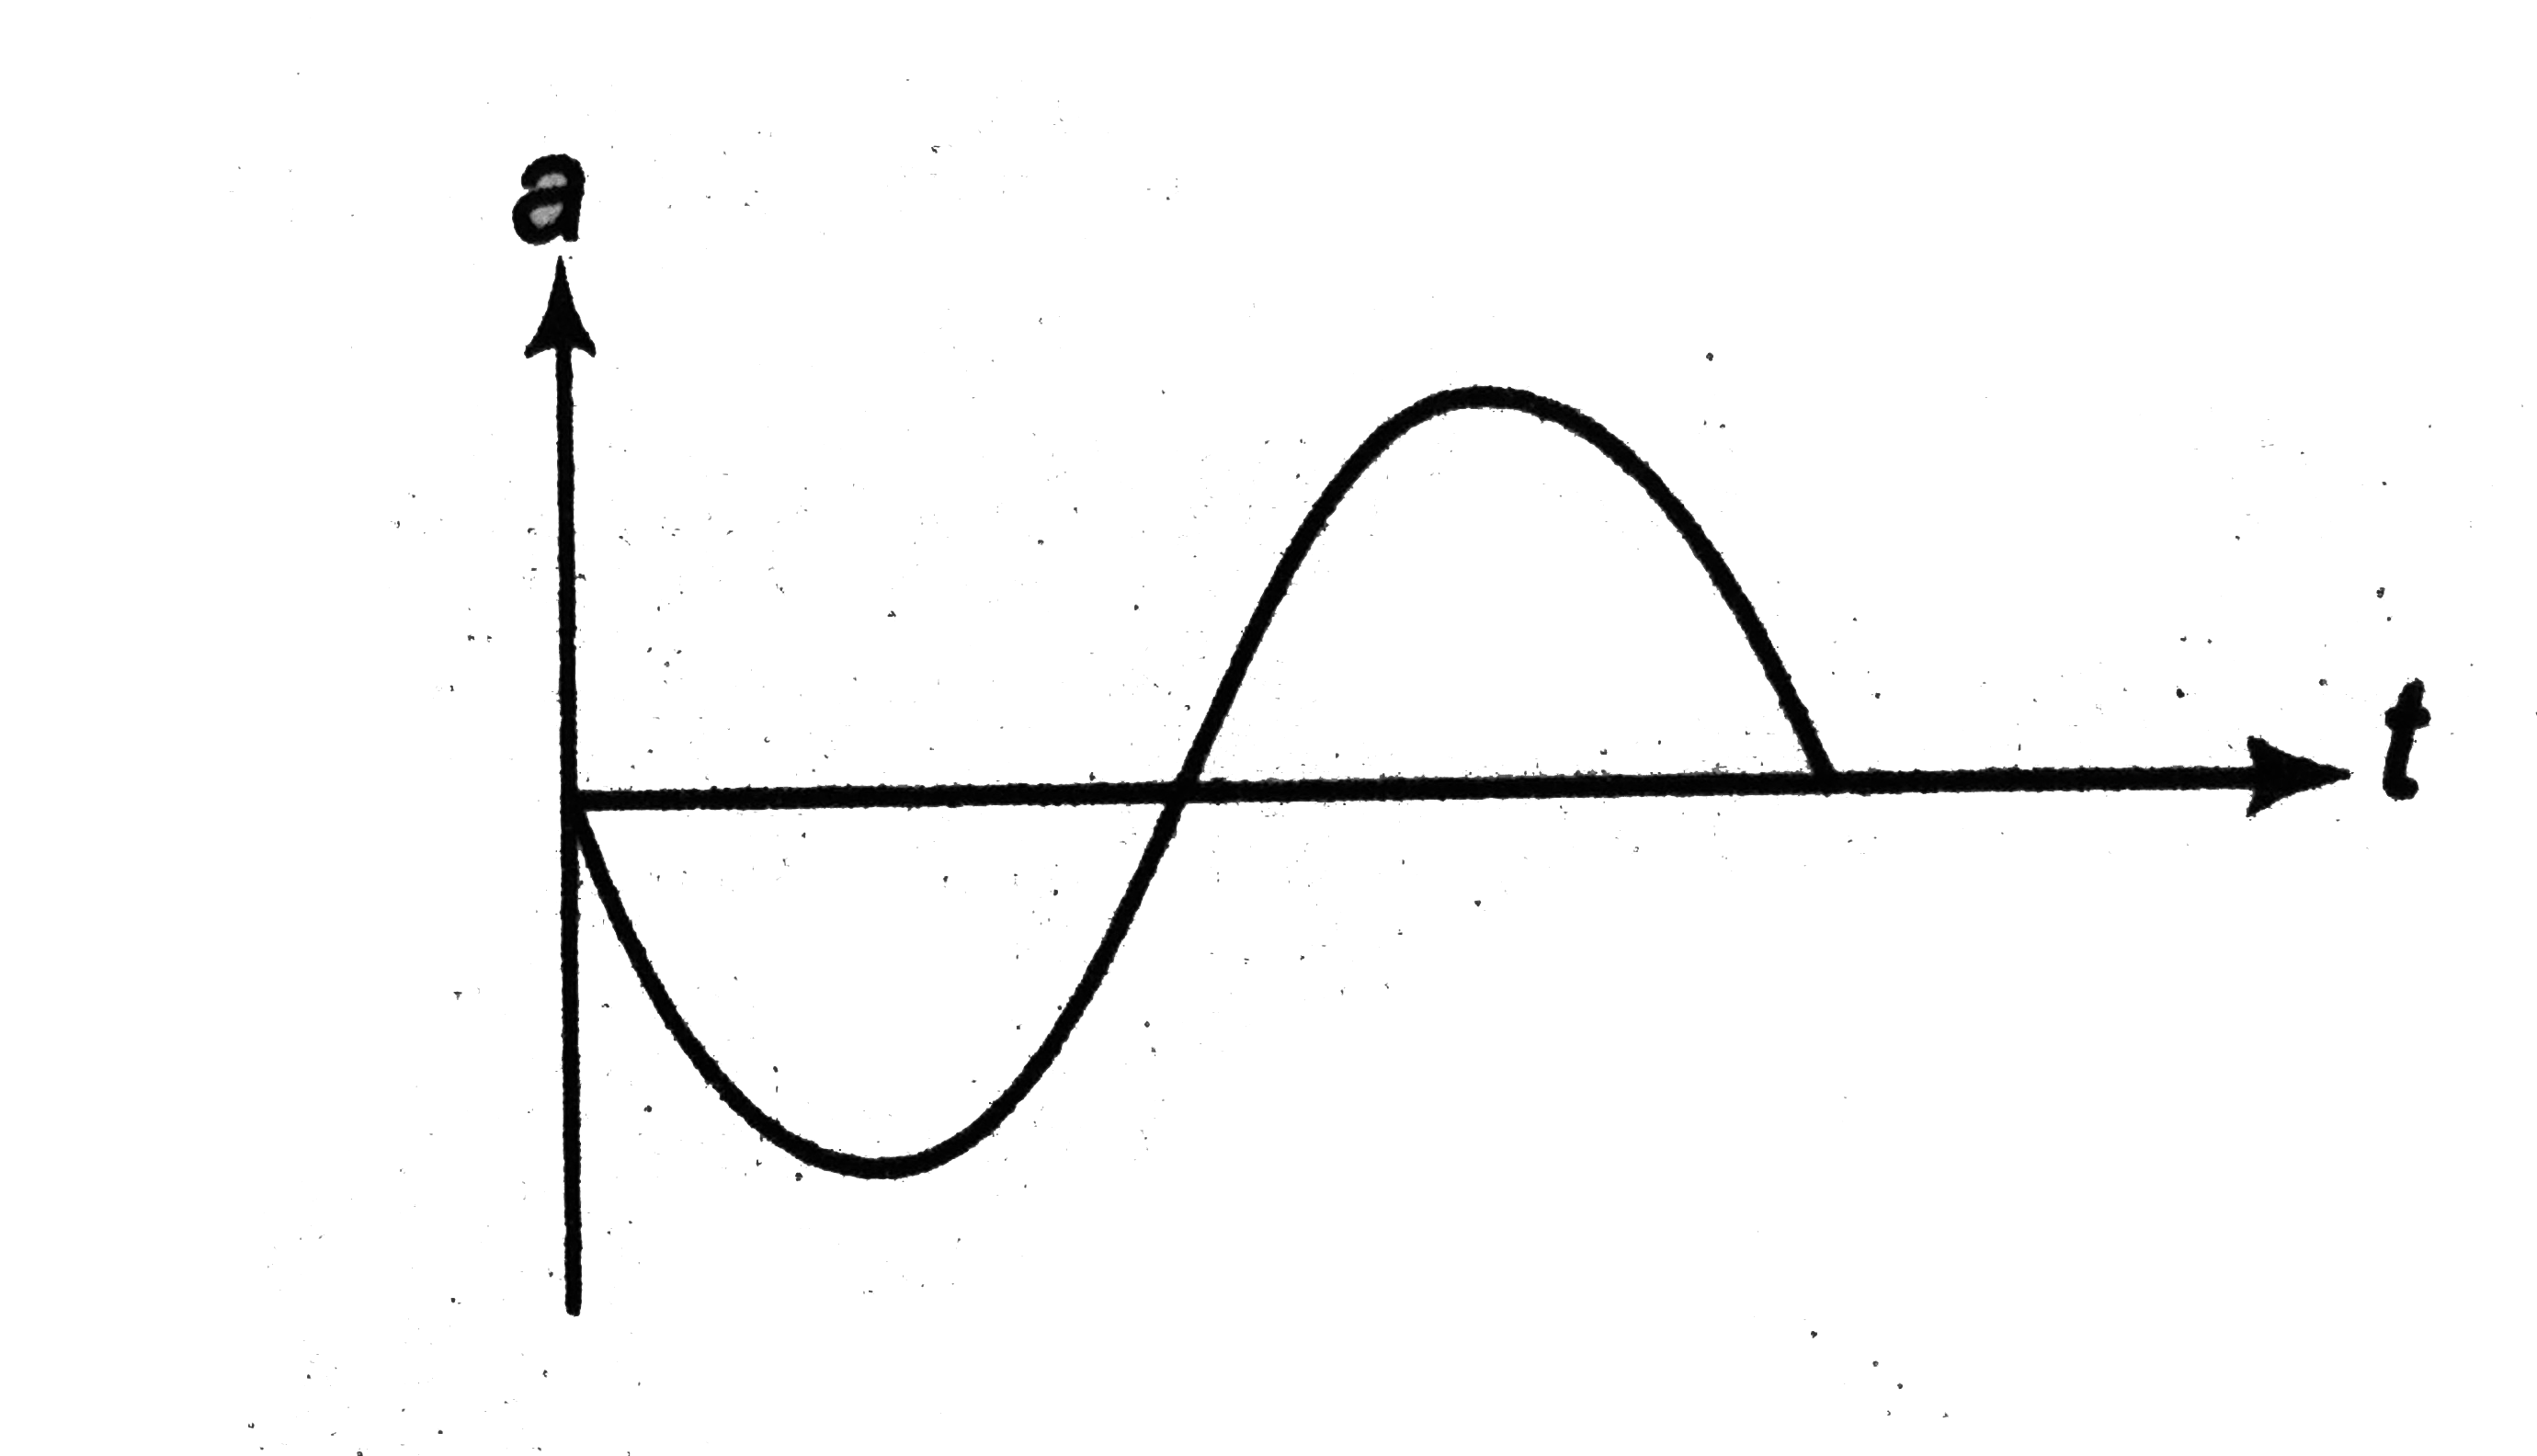
Corresponding to y−t graph of a transverse harmonic wave shown in figure,
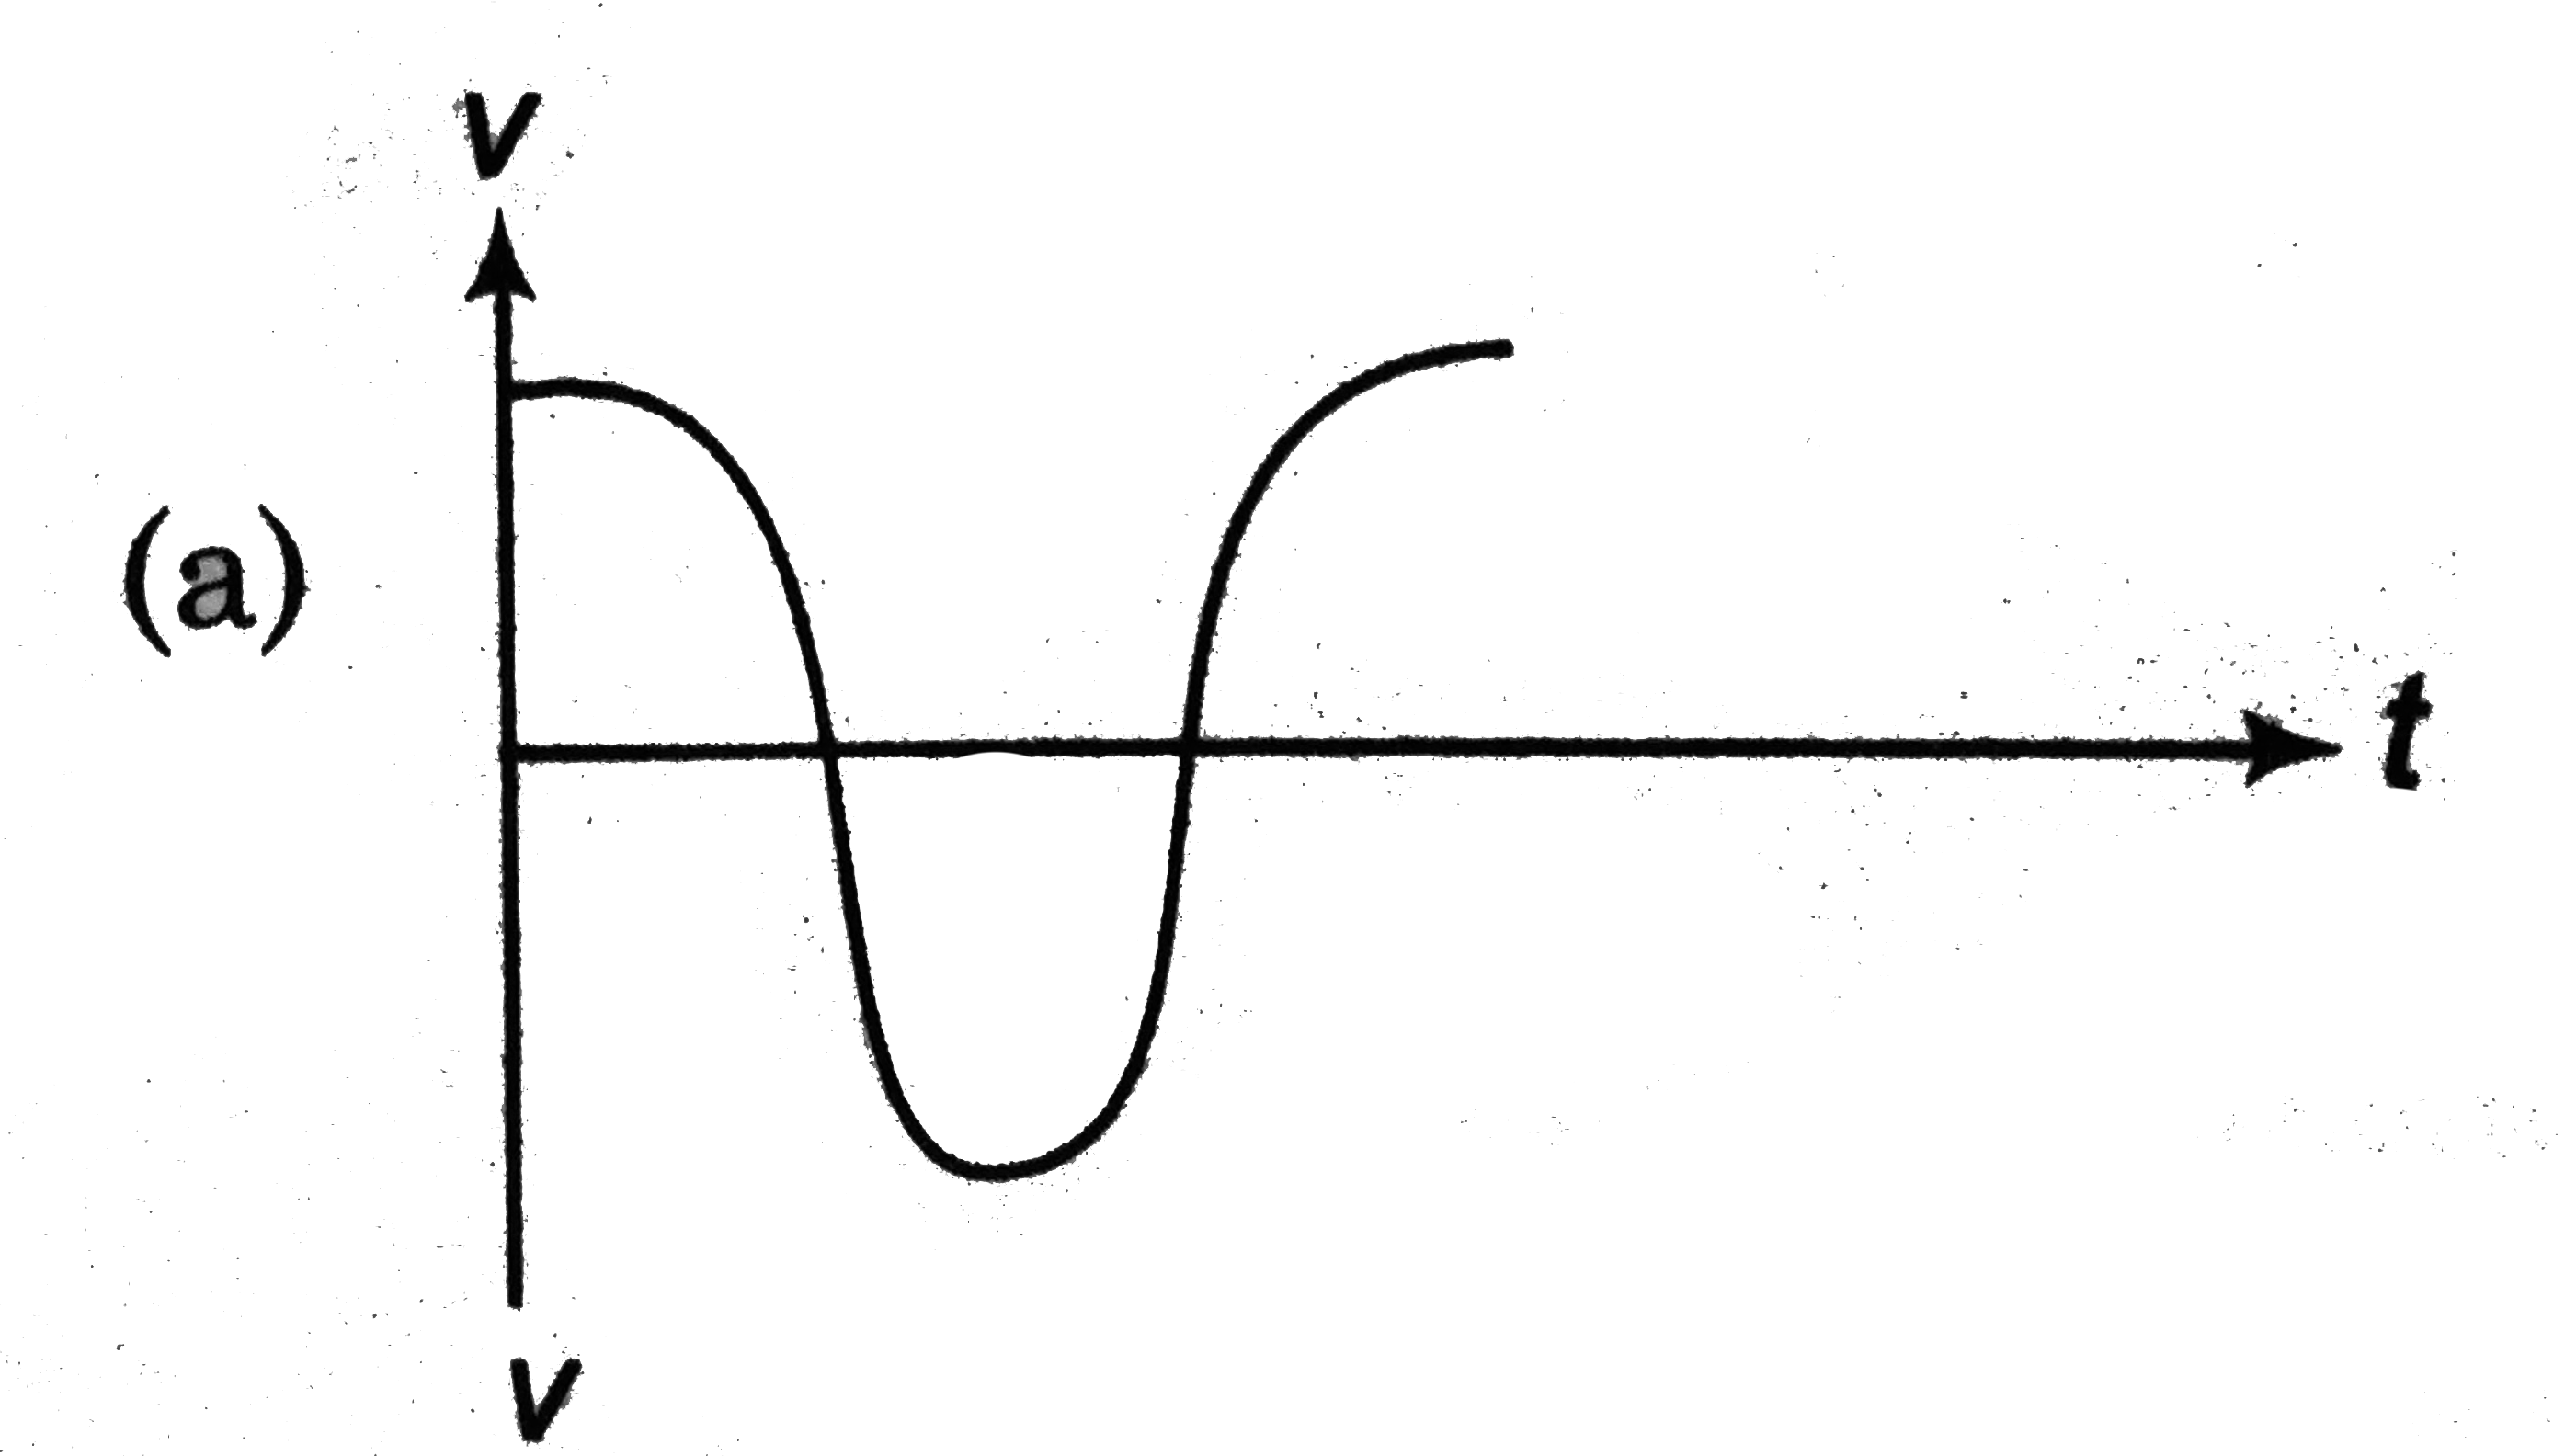
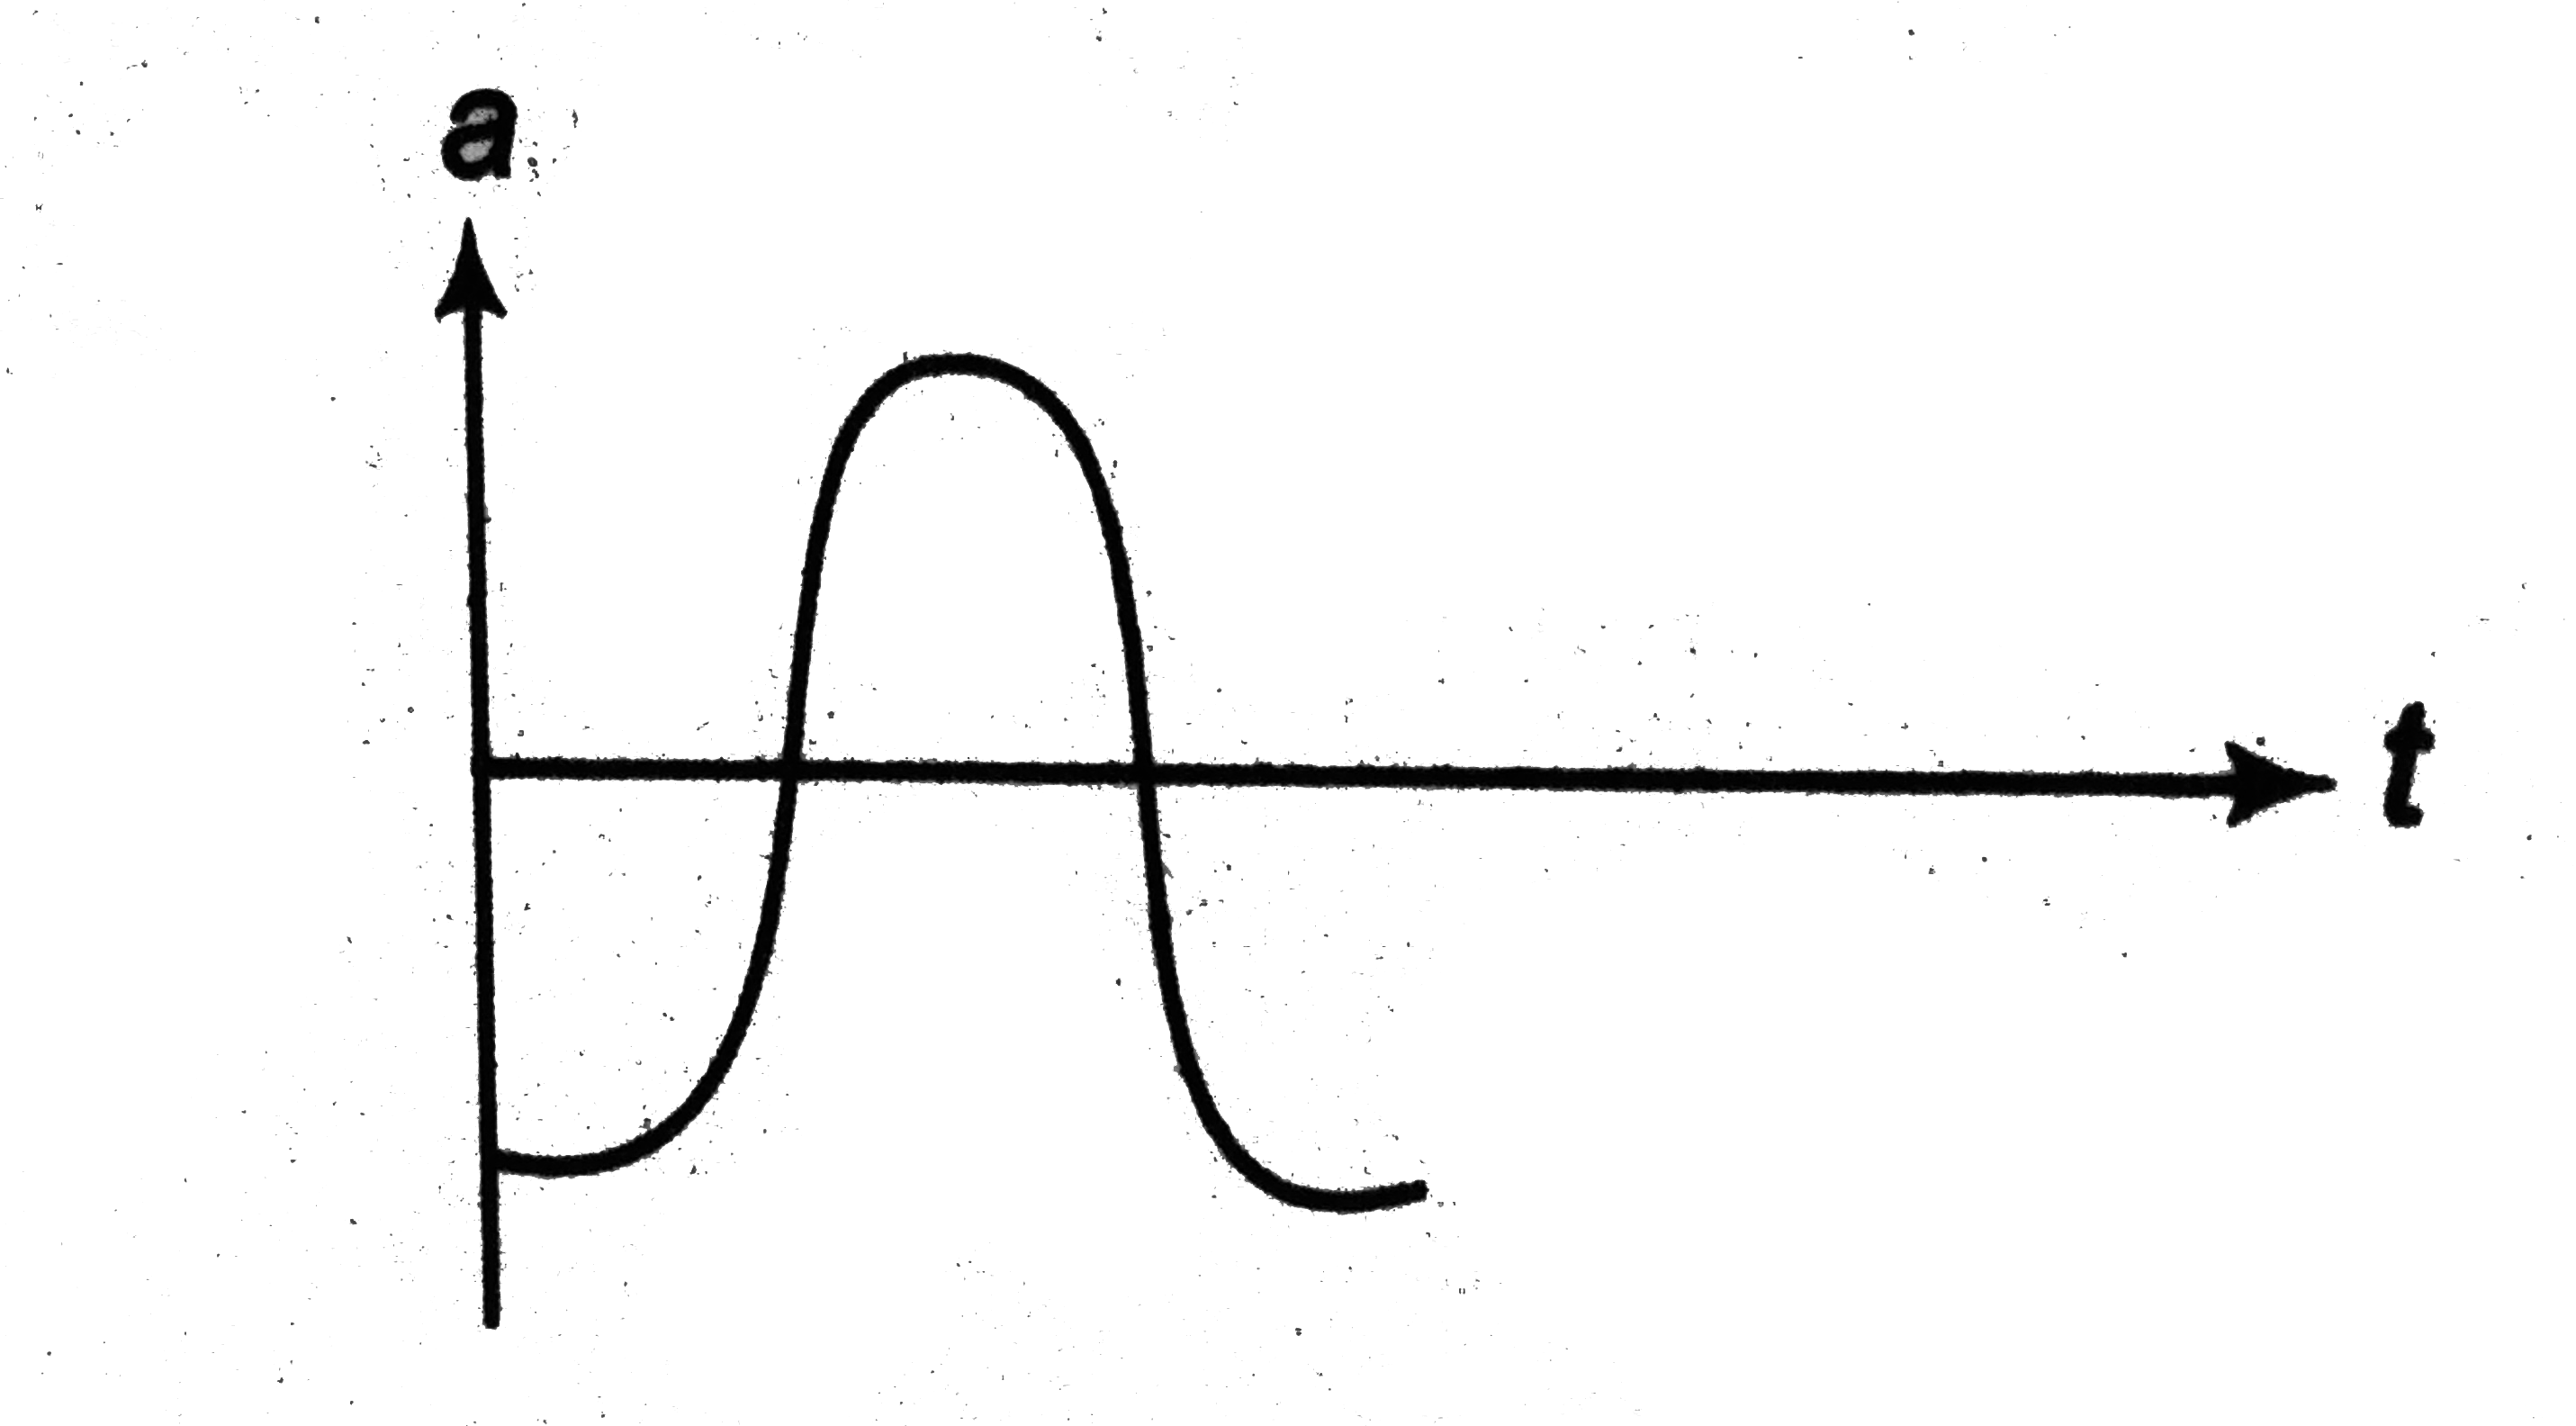
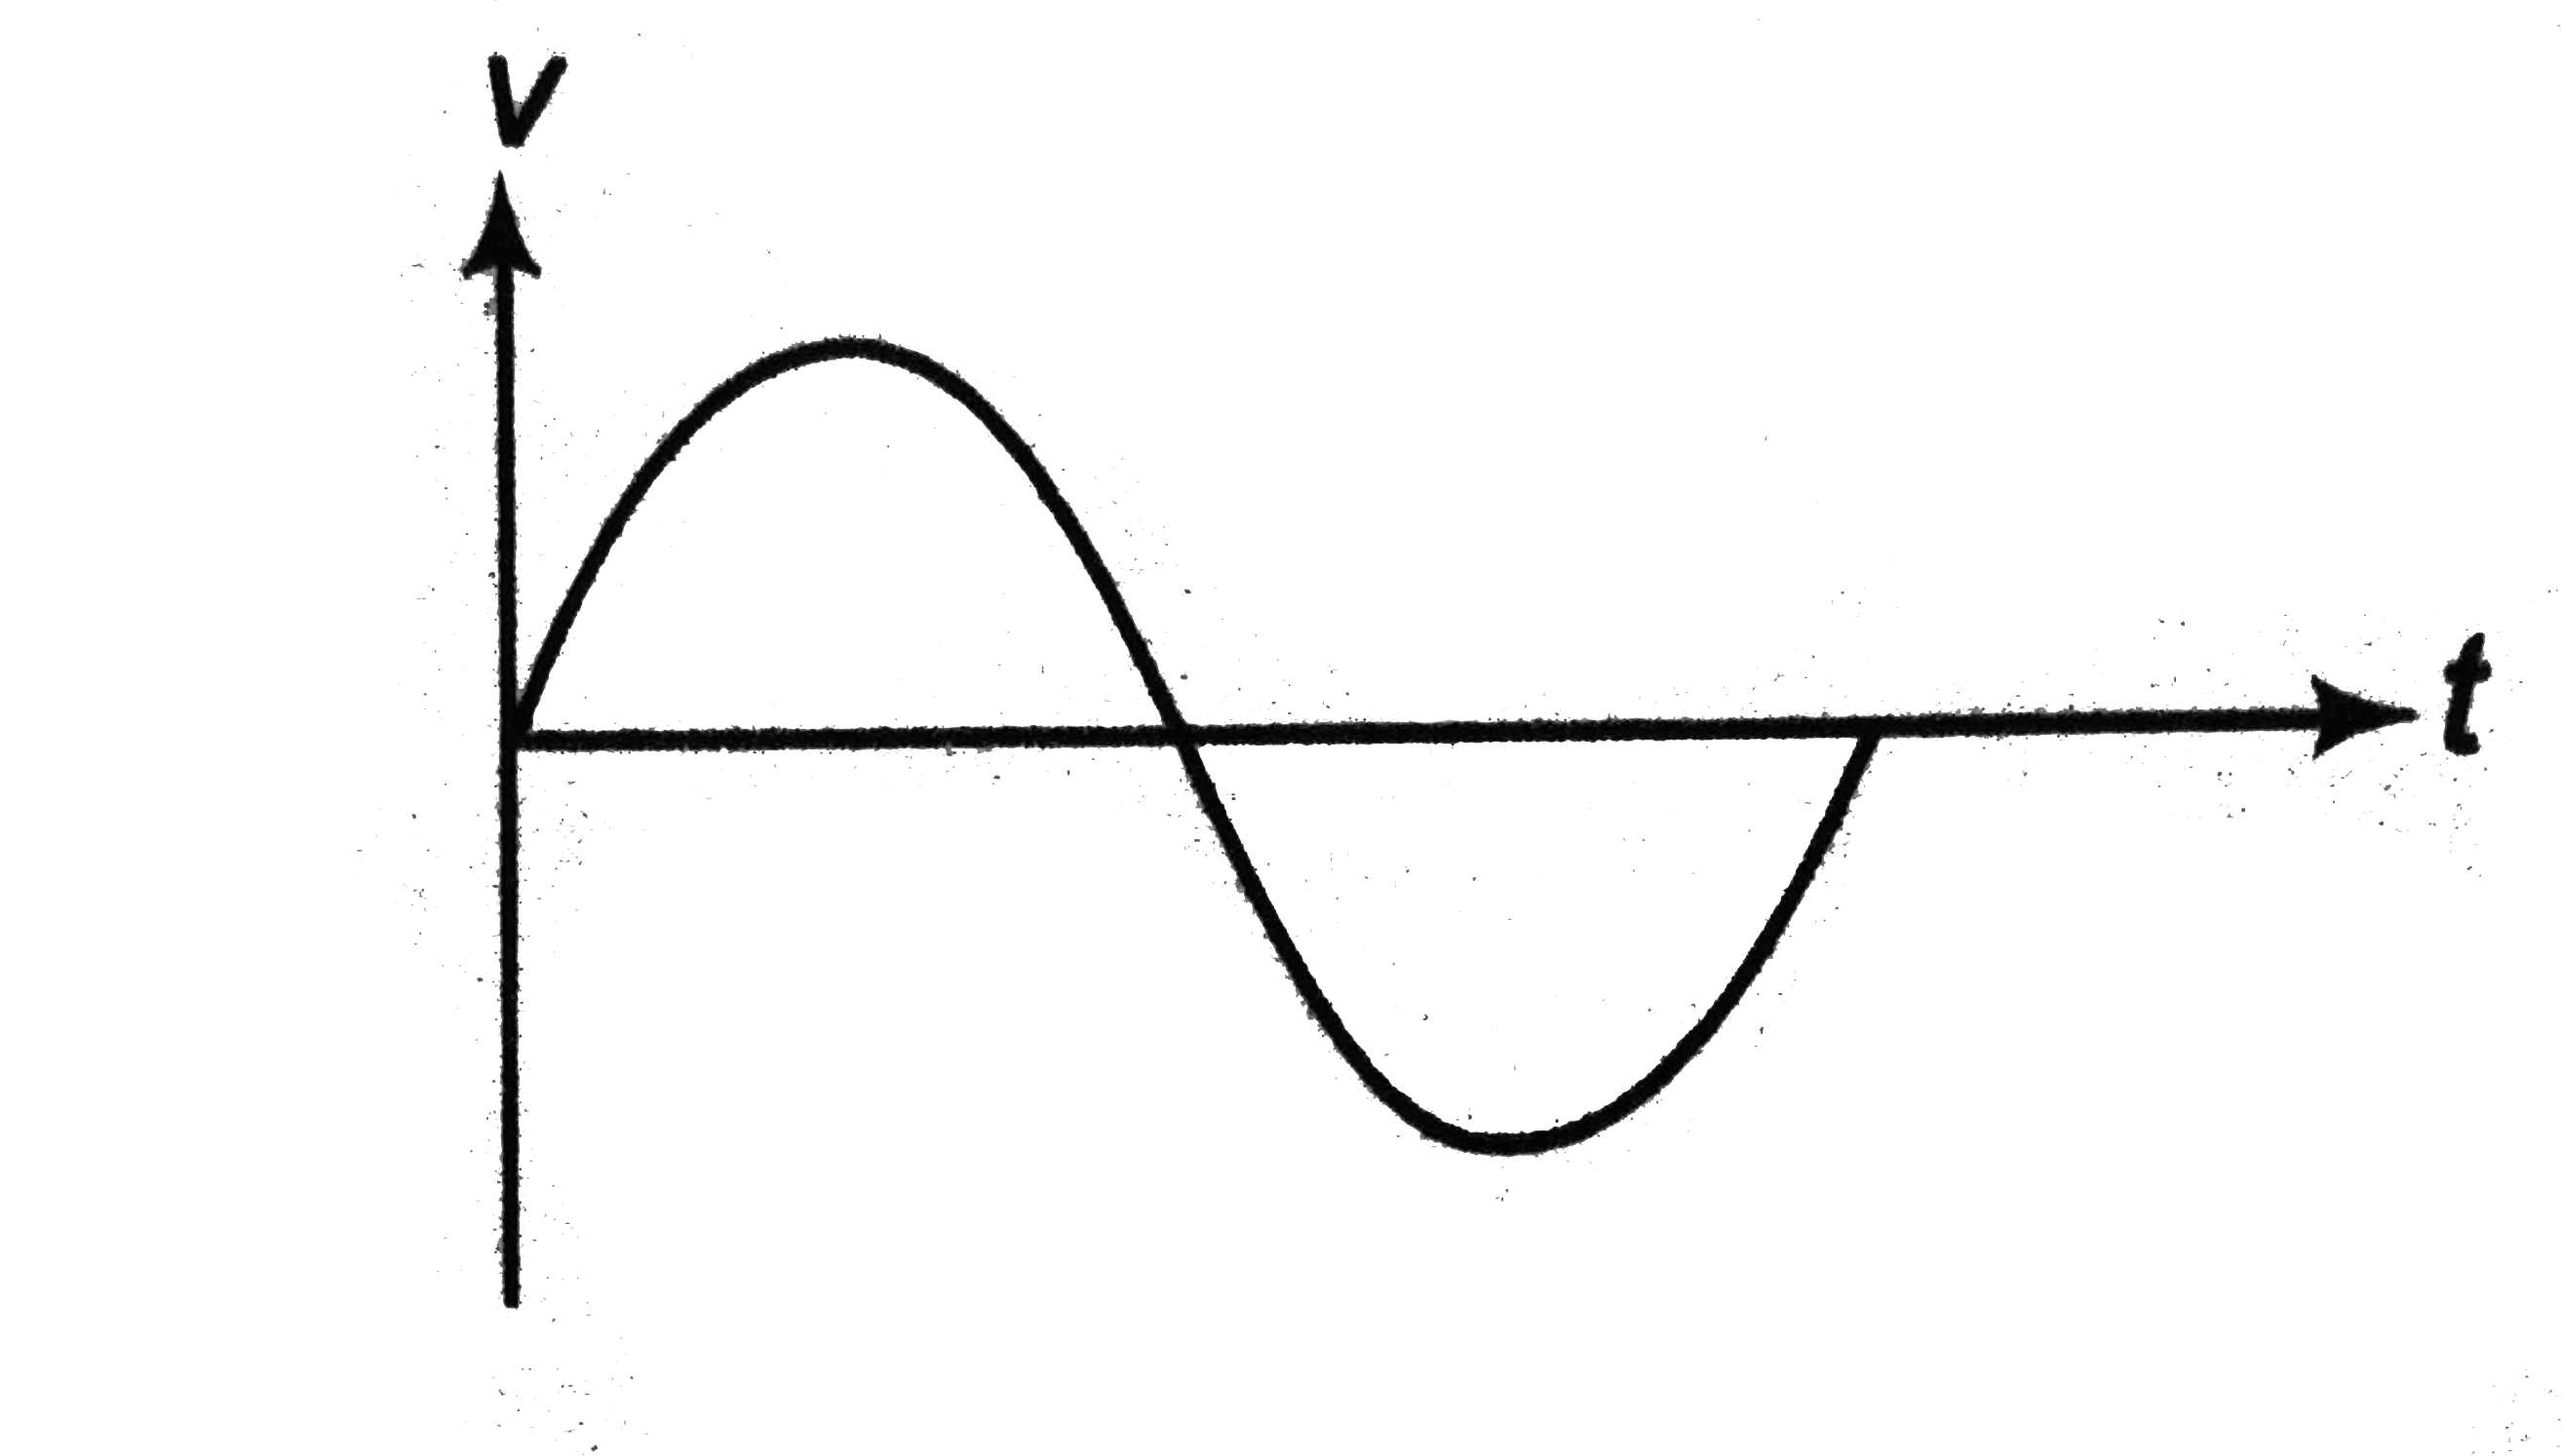
The correct Answer is:A, D
y−t graph is sine graph. Threfore, v−t graph is cos graph and a−t is -sine graph as
vp=∂y∂t and aP=∂2y∂t2
Topper's Solved these Questions
- WAVE MOTIONBook:DC PANDEYChapter:WAVE MOTIONExercise:Level 2 Subjective
Explore 7 Videos
- WAVE MOTIONBook:DC PANDEYChapter:WAVE MOTIONExercise:Subjective Questions
Explore 2 Videos
- WAVE MOTIONBook:DC PANDEYChapter:WAVE MOTIONExercise:Level 2 Single Correct
Explore 5 Videos
- VECTORSBook:DC PANDEYChapter:VECTORSExercise:Medical enrances gallery
Explore 9 Videos
- WORK, ENERGY & POWERBook:DC PANDEYChapter:WORK, ENERGY & POWERExercise:Level 2 Comprehension Based
Explore 2 Videos
Similar Questions
Plot P−V,V−T graph corresponding to the P−T graph for an ideal has shown in figure. Explain your answers.
_S01_065_Q01.png)
View SolutionThe figure represents the instantaneous picture of a transverse harmonic wave traveling along the negative x-axis. Choose the correct alternative(s) related to the movement of the nine points shown in the figure.
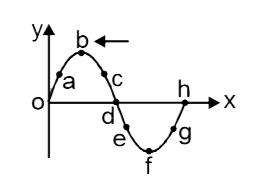
The points moving upward is/are
View Solution
Knowledge Check
Assertion : y−x graph of a transverse wave on a string is as shown in figure. At the given instant point P is moving downwards. Hence, we can say that wave is moving tiwards positive y−direction.<imga≤ocr_imageload∈g=lazysrc=https://d10lpgp6xz60nq.cloudfront.net/physics_images/DCP_V03_C17_E01_034_Q01.pngwh=80%mx-autosty≤=background:white;><br>Reason:Partialvelocityisgivenby<br>vp = -v(dely)/(delx)
AIf both Assertion and Reason are true and the Reason is correct expanation of the Assertion.BIf both Assertion and Reason are true but the Reason is not correct expanation of the Assertion.CIf Assertion is true, but the Reason is false.DIf Assertion is false but the Reason is true.The x−t graph of a particle undergoing simple harmonic motion is shown in figure. Acceleration of particle at t=4/3s is
 A√332π2cm/s2B−π232cm/s2Cπ232cm/s2D−√332π2cm/s2
The acceleration displacement graph of a particle executing simple harmonic motion is shown in figure. The time period of simple harmonic motion is
A4π√3sB2π√3sCThe given graph doesn't represent simple harmonic motionDinformation is insufficient
The figure represents the instantaneous picture of a transverse harmonic wave traveling along the negative x-axis. Choose the correct alternative(s) related to the movement of the nine points shown in the figure.
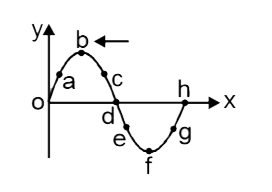
The points moving with maximum speed is/are
View SolutionThe figure represents the instantaneous picture of a transverse harmonic wave traveling along the negative x-axis. Choose the correct alternative(s) related to the movement of the nine points shown in the figure.
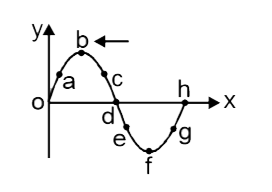
The points moving downwards is/are
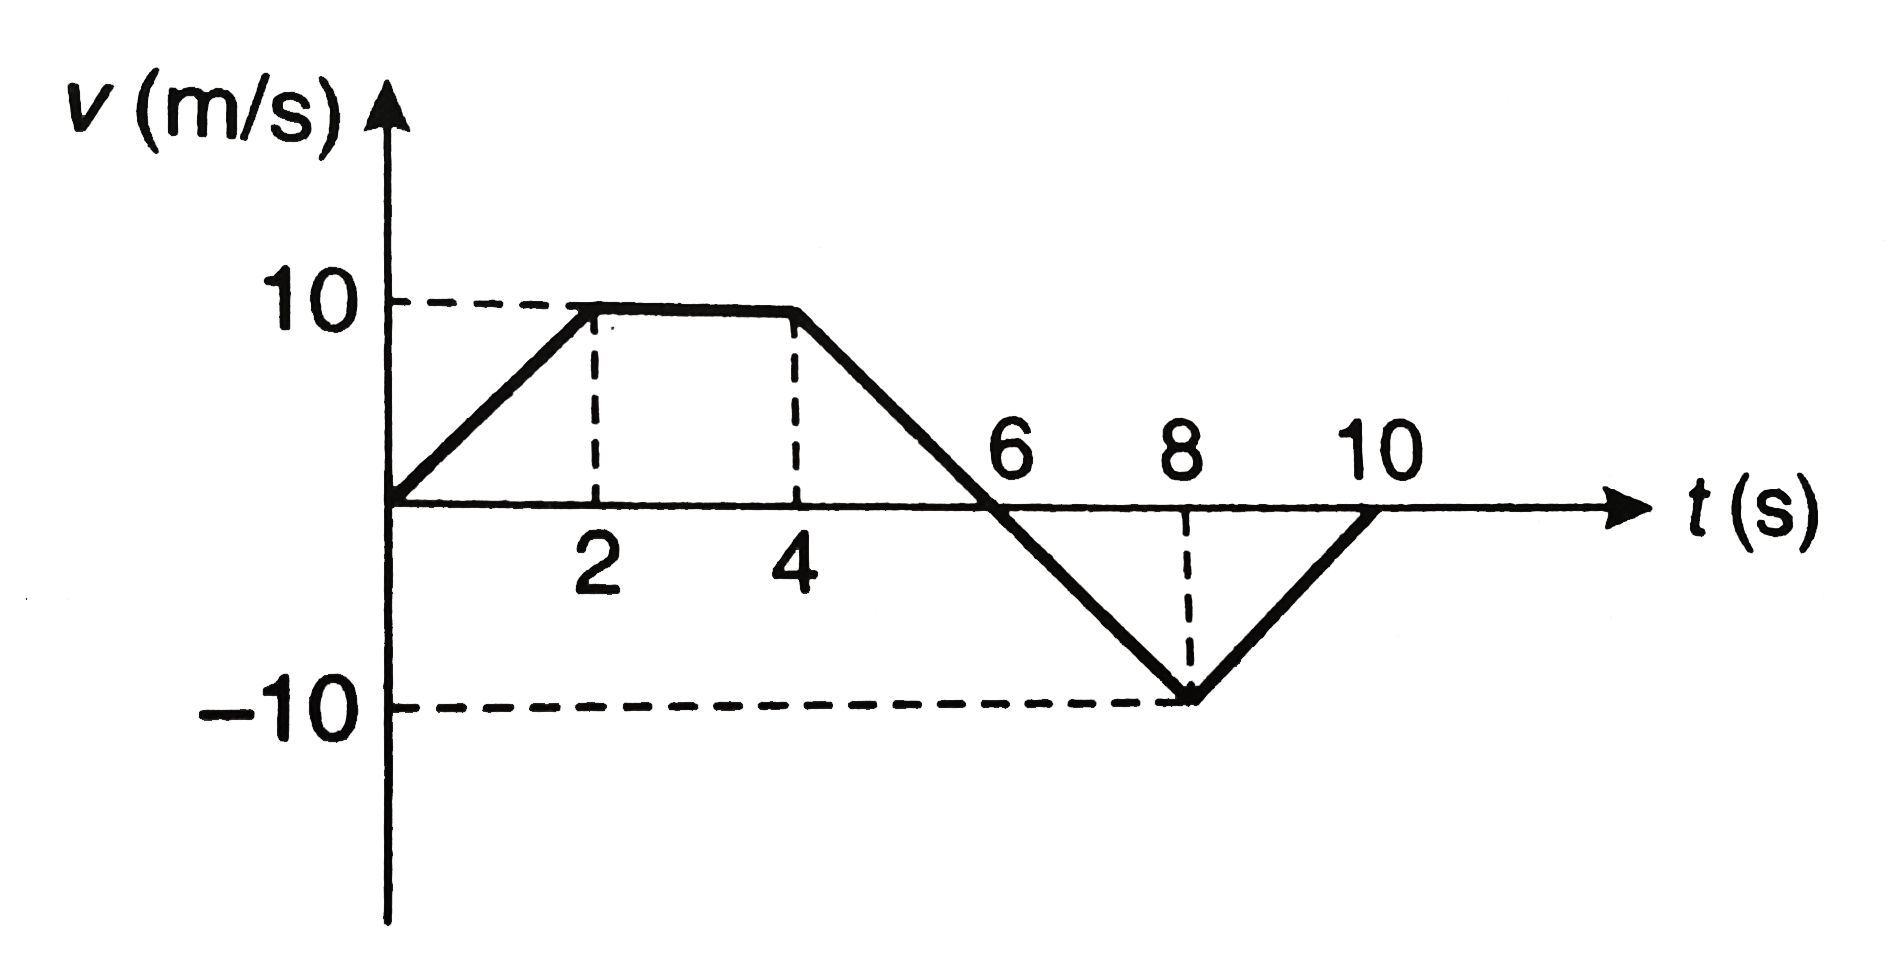
View SolutionVelocity-time graph of a particle moving in a straight line is shown in figure. At time t=0,s=−10m. Plot corresponding a-t and s-t graphs.
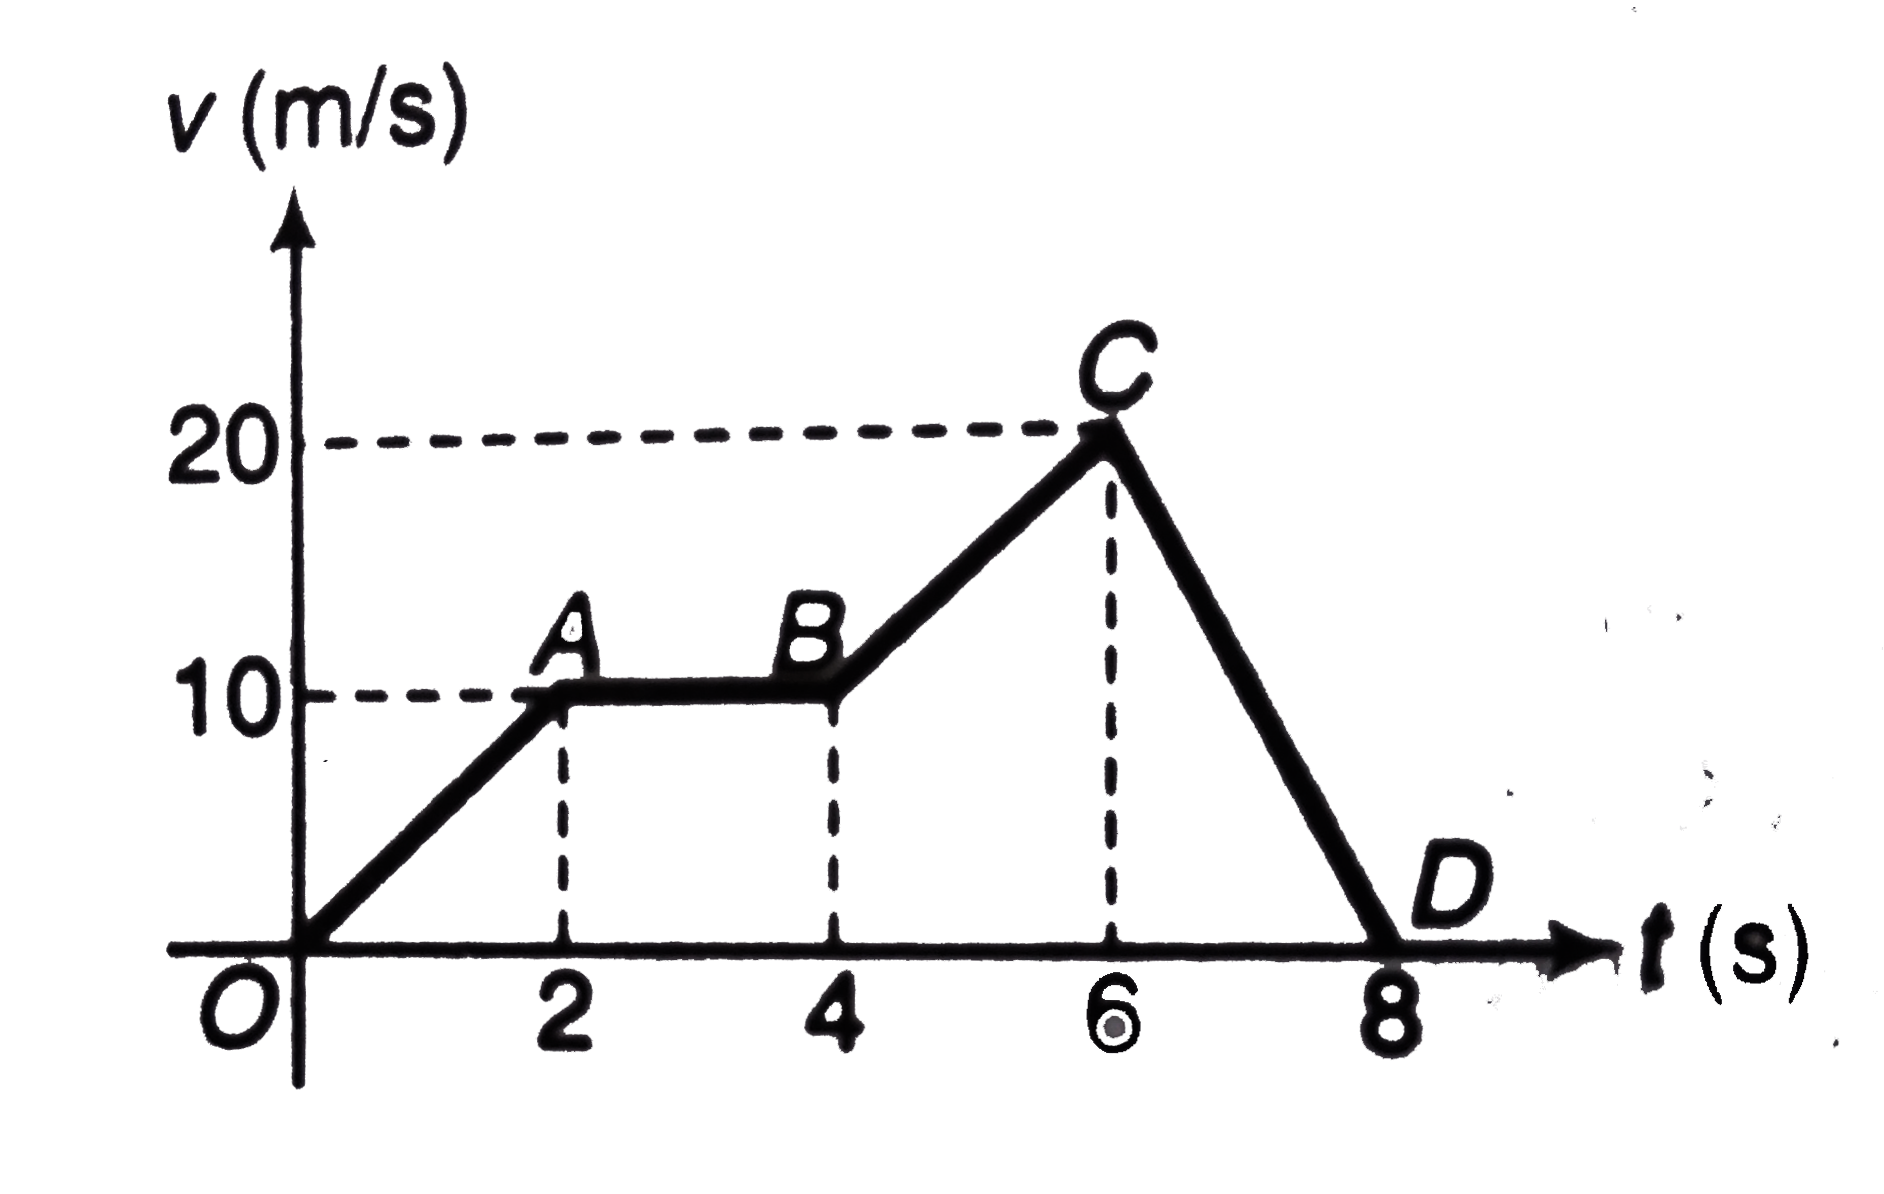
View SolutionVelocity-time graph of a particle moving in a straight line is shown in figure. Plot the corresponding displacement-time graph of the particle if at time t=0, displacement s=0.
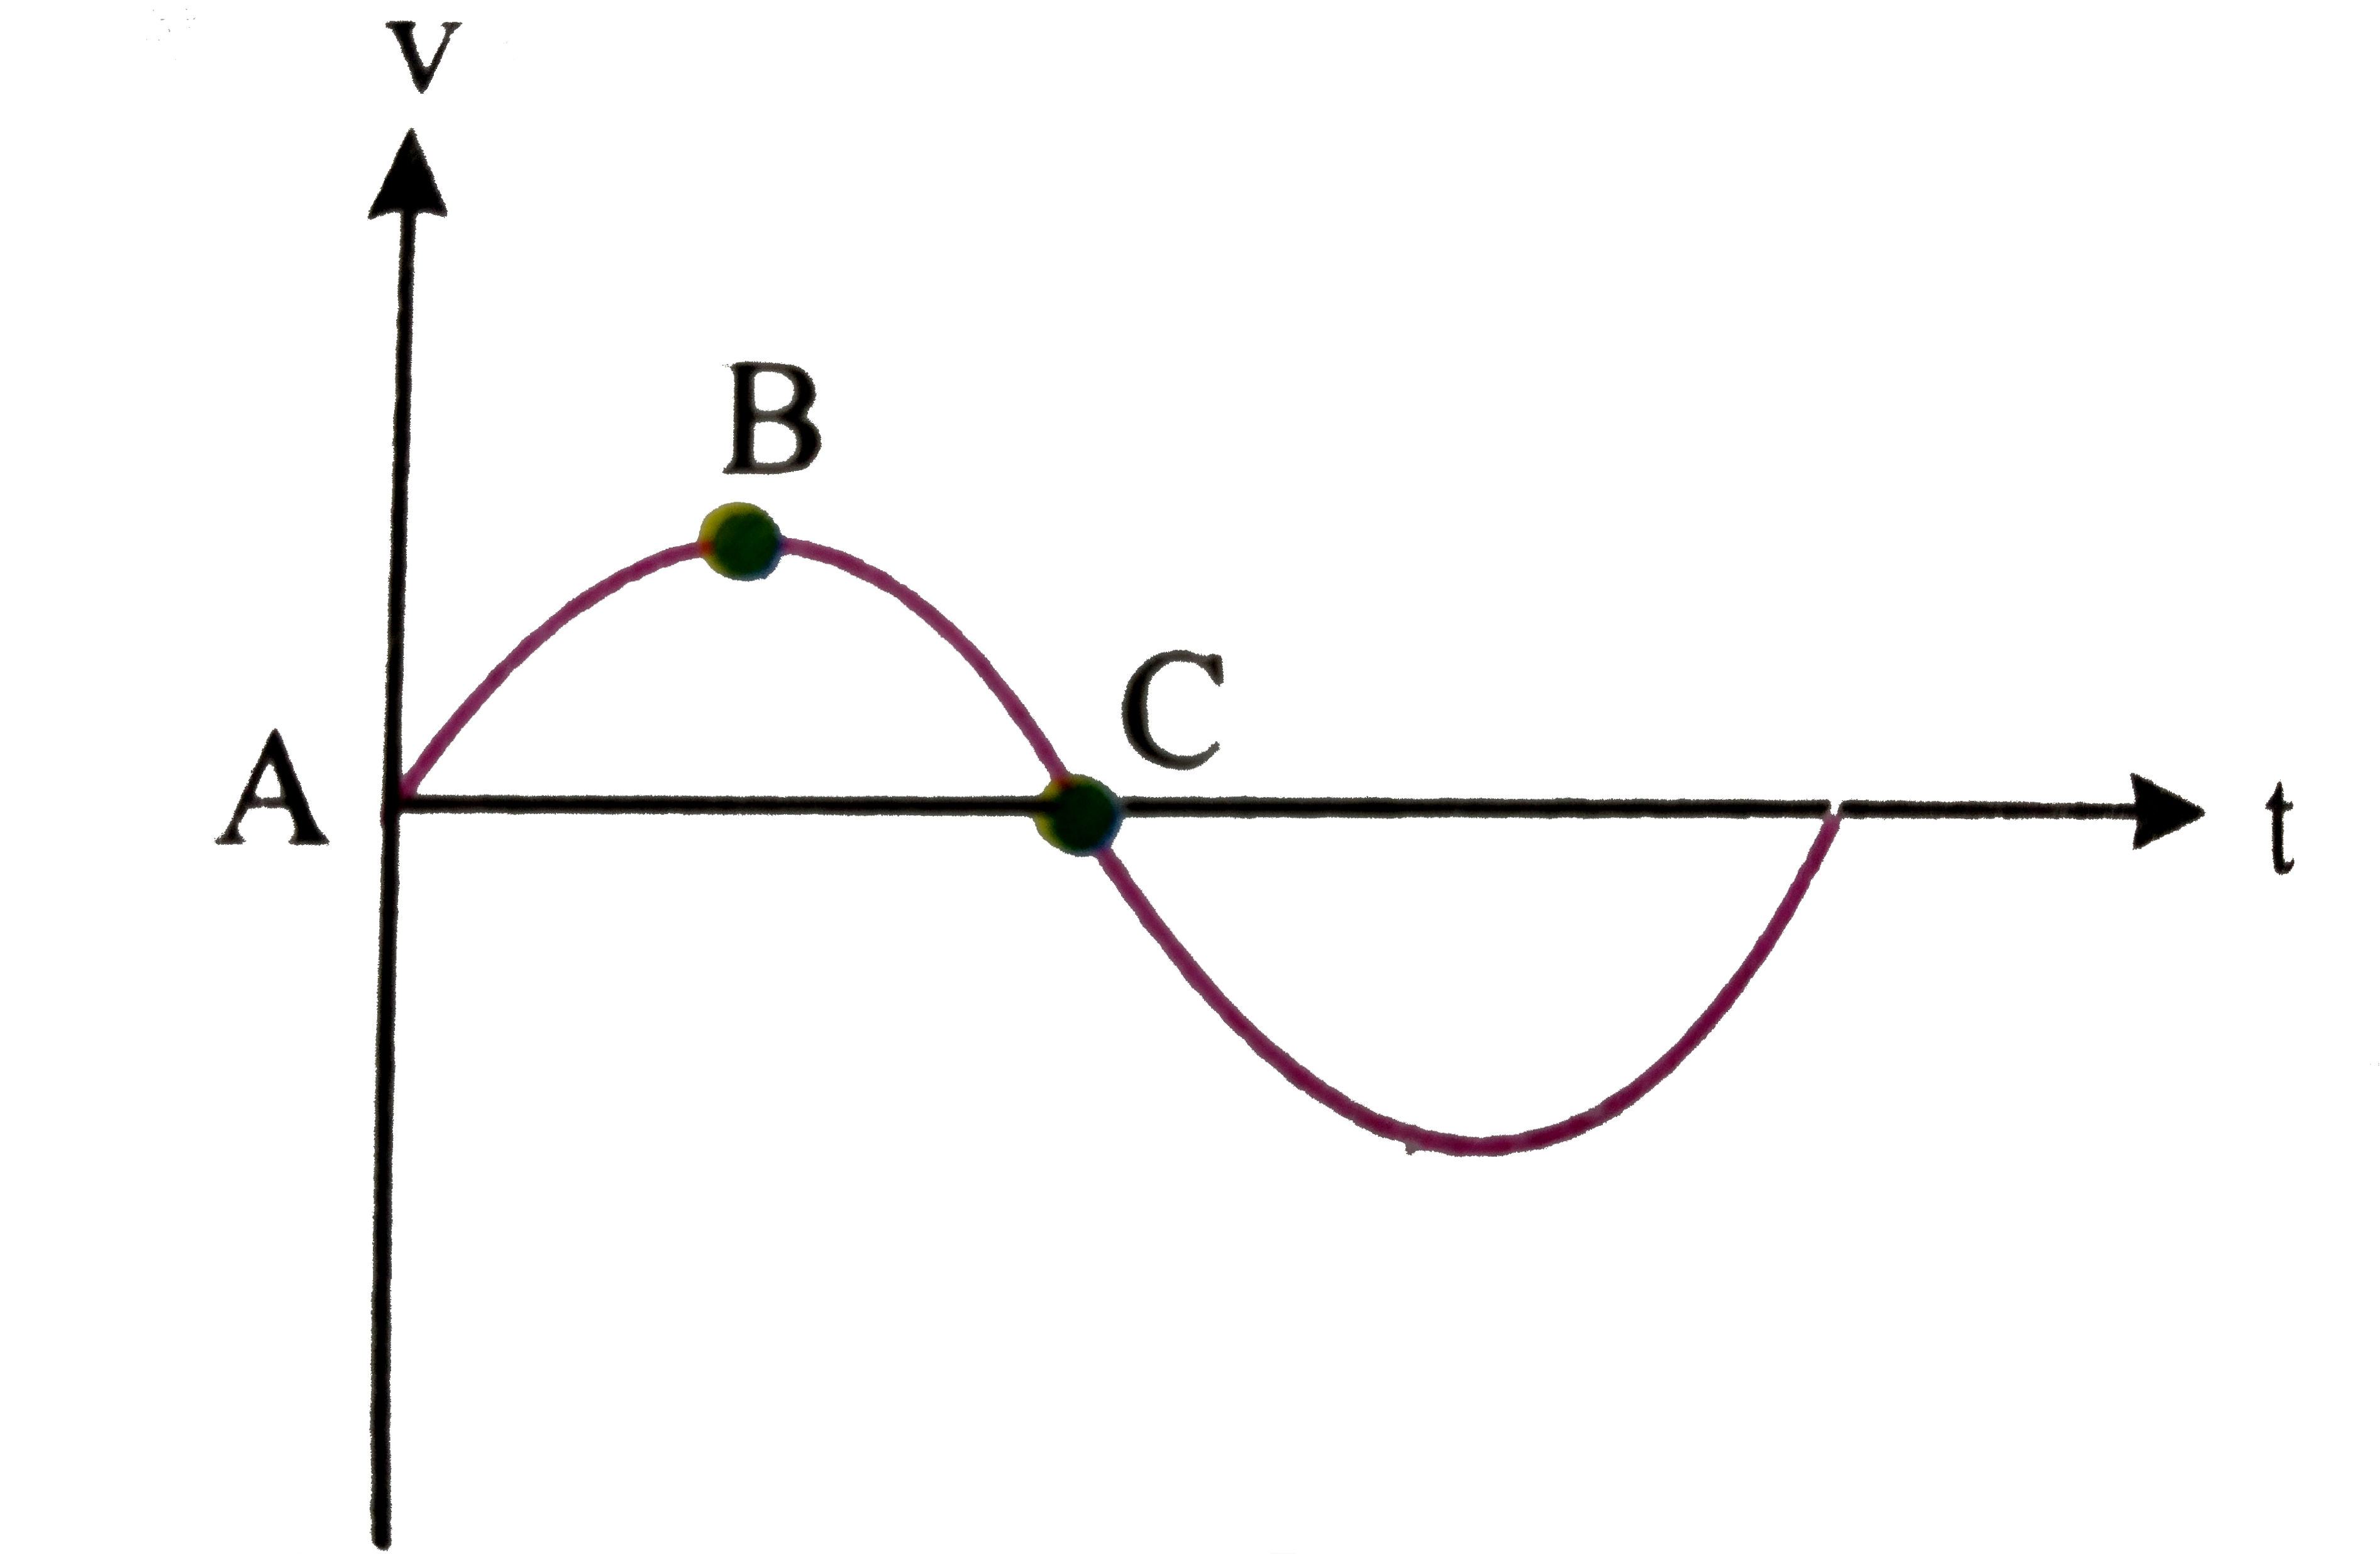
View Solutionv−t graph of a particle in SHM is as shown is figure. Choose the wrong option.
View Solution