Dispersion of light is shown in the following diagram, select the CORRECT one.
A

B

C

D

Text Solution
The correct Answer is:A
|
Updated on:21/07/2023
Topper's Solved these Questions
- BOOK - TARGET PUBLICATIONCHAPTER - REFRACTION OF LIGHT EXERCISE - CRITICAL THINKING53videos
REFRACTION OF LIGHT
- BOOK - TARGET PUBLICATIONCHAPTER - REFRACTION OF LIGHT EXERCISE - COMPETITIVE THINKING80videos
REFRACTION OF LIGHT
- BOOK - TARGET PUBLICATIONCHAPTER - RAY OPTICSEXERCISE - EVALUATION TEST14videos
RAY OPTICS
- BOOK - TARGET PUBLICATIONCHAPTER - SCALARS AND VECTORSEXERCISE - Evaluation Test19videos
SCALARS AND VECTORS
Similar Questions
Knowledge Check
- Question 1 - Select One
Examine the type of aestivation shown in the following diagram and select the correct answer
 AA-Twisted, B - Imbricate, C- Vexillary, D-ValvateBA - Imbricate,B-Vexillary,C-Valvate, D-TwistedCA-Vexillary, B-Valvate,C-Twisted, D-ImbricateDA-Valvate, B-Twisted, C-Imbricate,D-Vexillary
 - Question 2 - Select One
Reproduction in bacteria is shown in following diagram . Select the correct match.
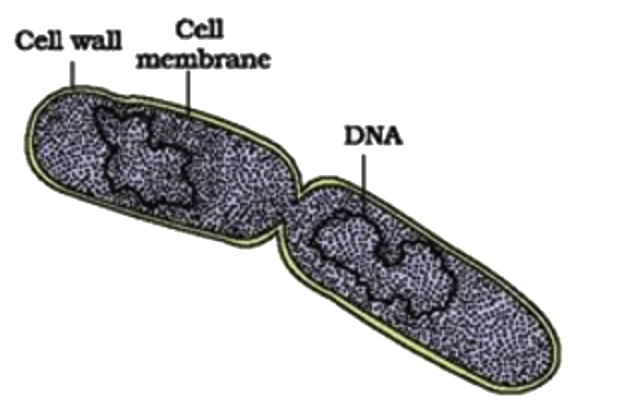 AMode of ReproductionConditionsBuddigFavourableBMode of ReproductionConditionsBinary fission FavourableCMode of ReproductionConditionsSpore formation UnfavourableDMode of ReproductionConditionsBuddingUnfavourable
 - Question 3 - Select One or More
With the help of following phase diagram, select the correct statements.
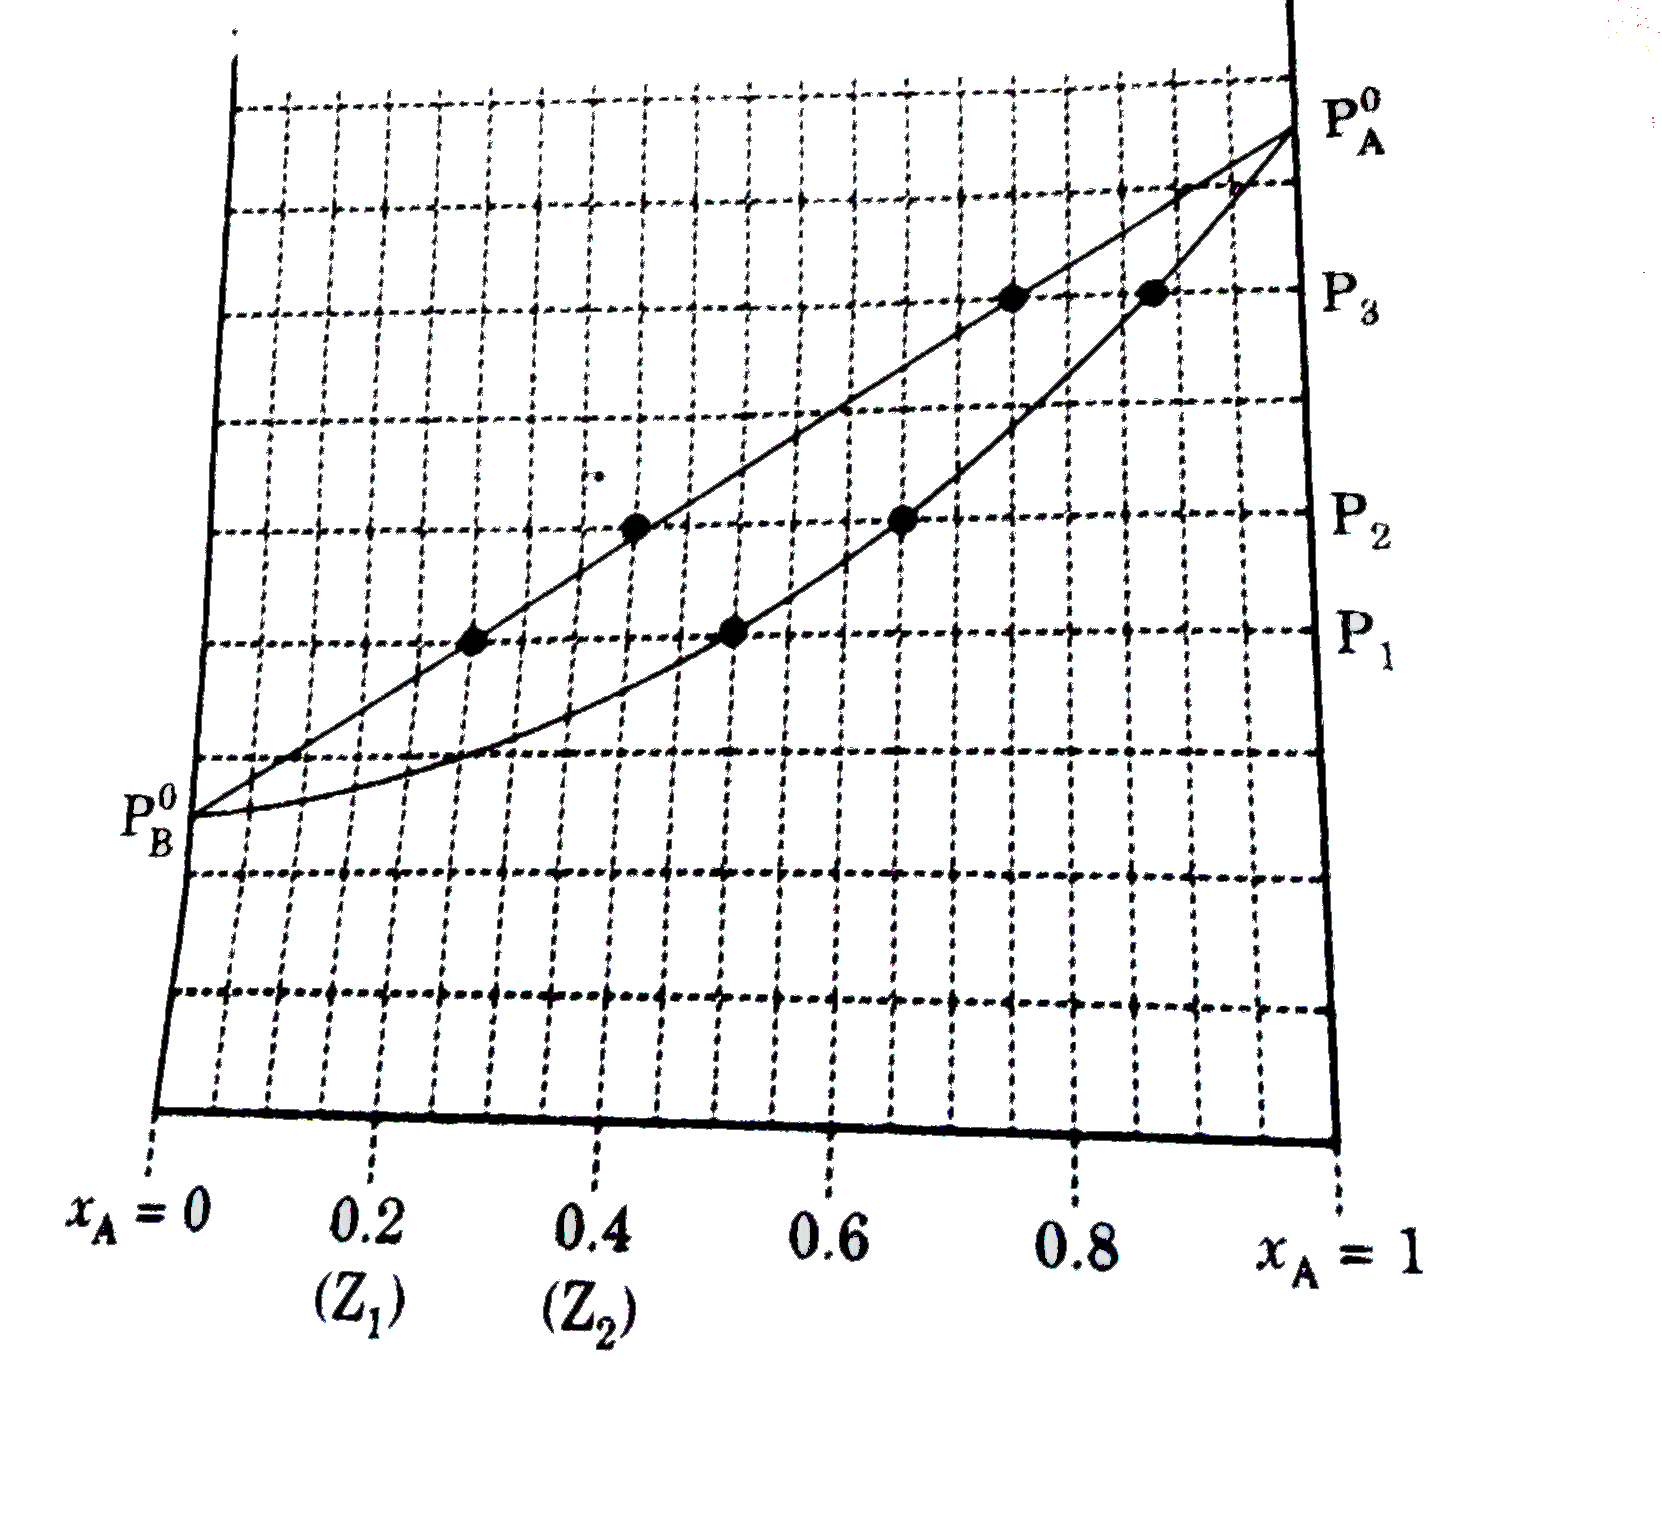 AMole fraction of B in vapour at pressure P1 for solution Z2 is 0.5BMole fraction of A in liquid at presure P3 for solution Z2 is 0.4CMole fraction of B in liquid at pressure P1 for solution Z2 is 0.75DMole fraction of B in liquid at pressure P2 for solution Z1 is 0.4
Identify the following diagram and select the option with correct labels :
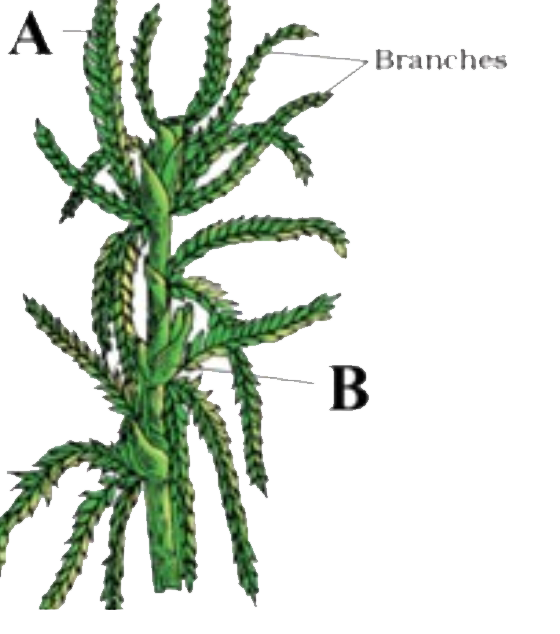 View Solution
Identify the following diagram and select the option with correct labels :
 View Solution
The following diagrams show possible ways of population dispersion .
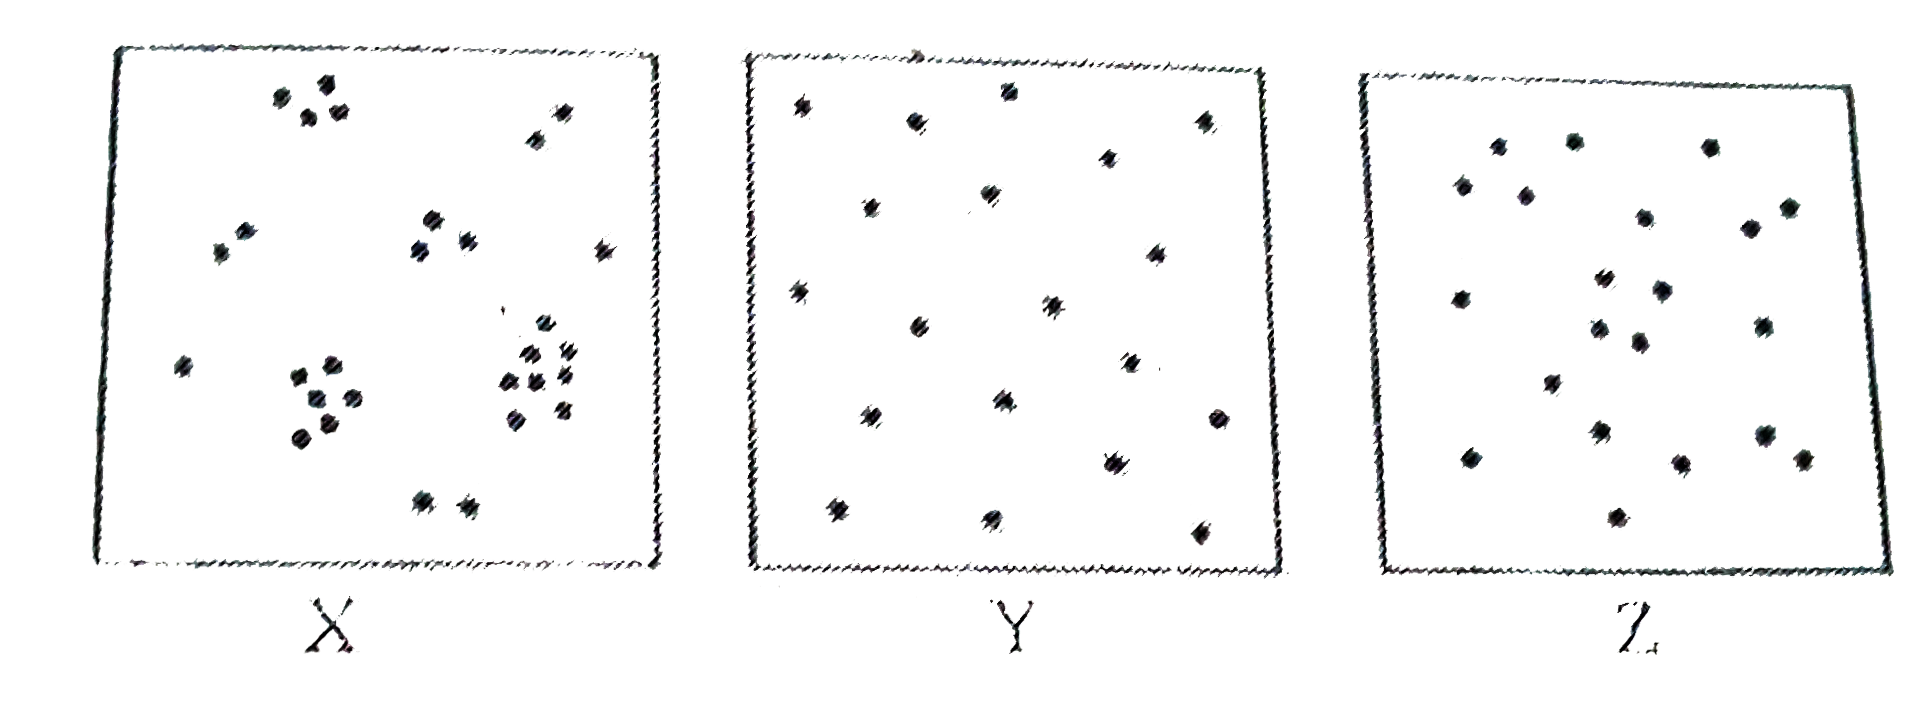
Which one of the following is the most common pattern of dispersion of individuals in a population?View SolutionThe P-V diagram for an ideal gas is shown in figure.
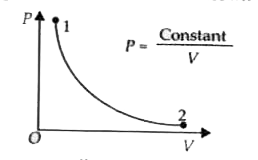
Out of the following diagrams which one represents the T-P diagram ?View SolutionTwo stages of insulin (Stage P and Stage Q) are shown in the diagram. Select the correct statement:
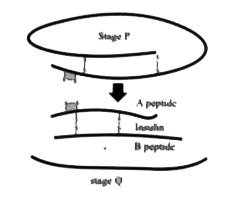 View Solution

