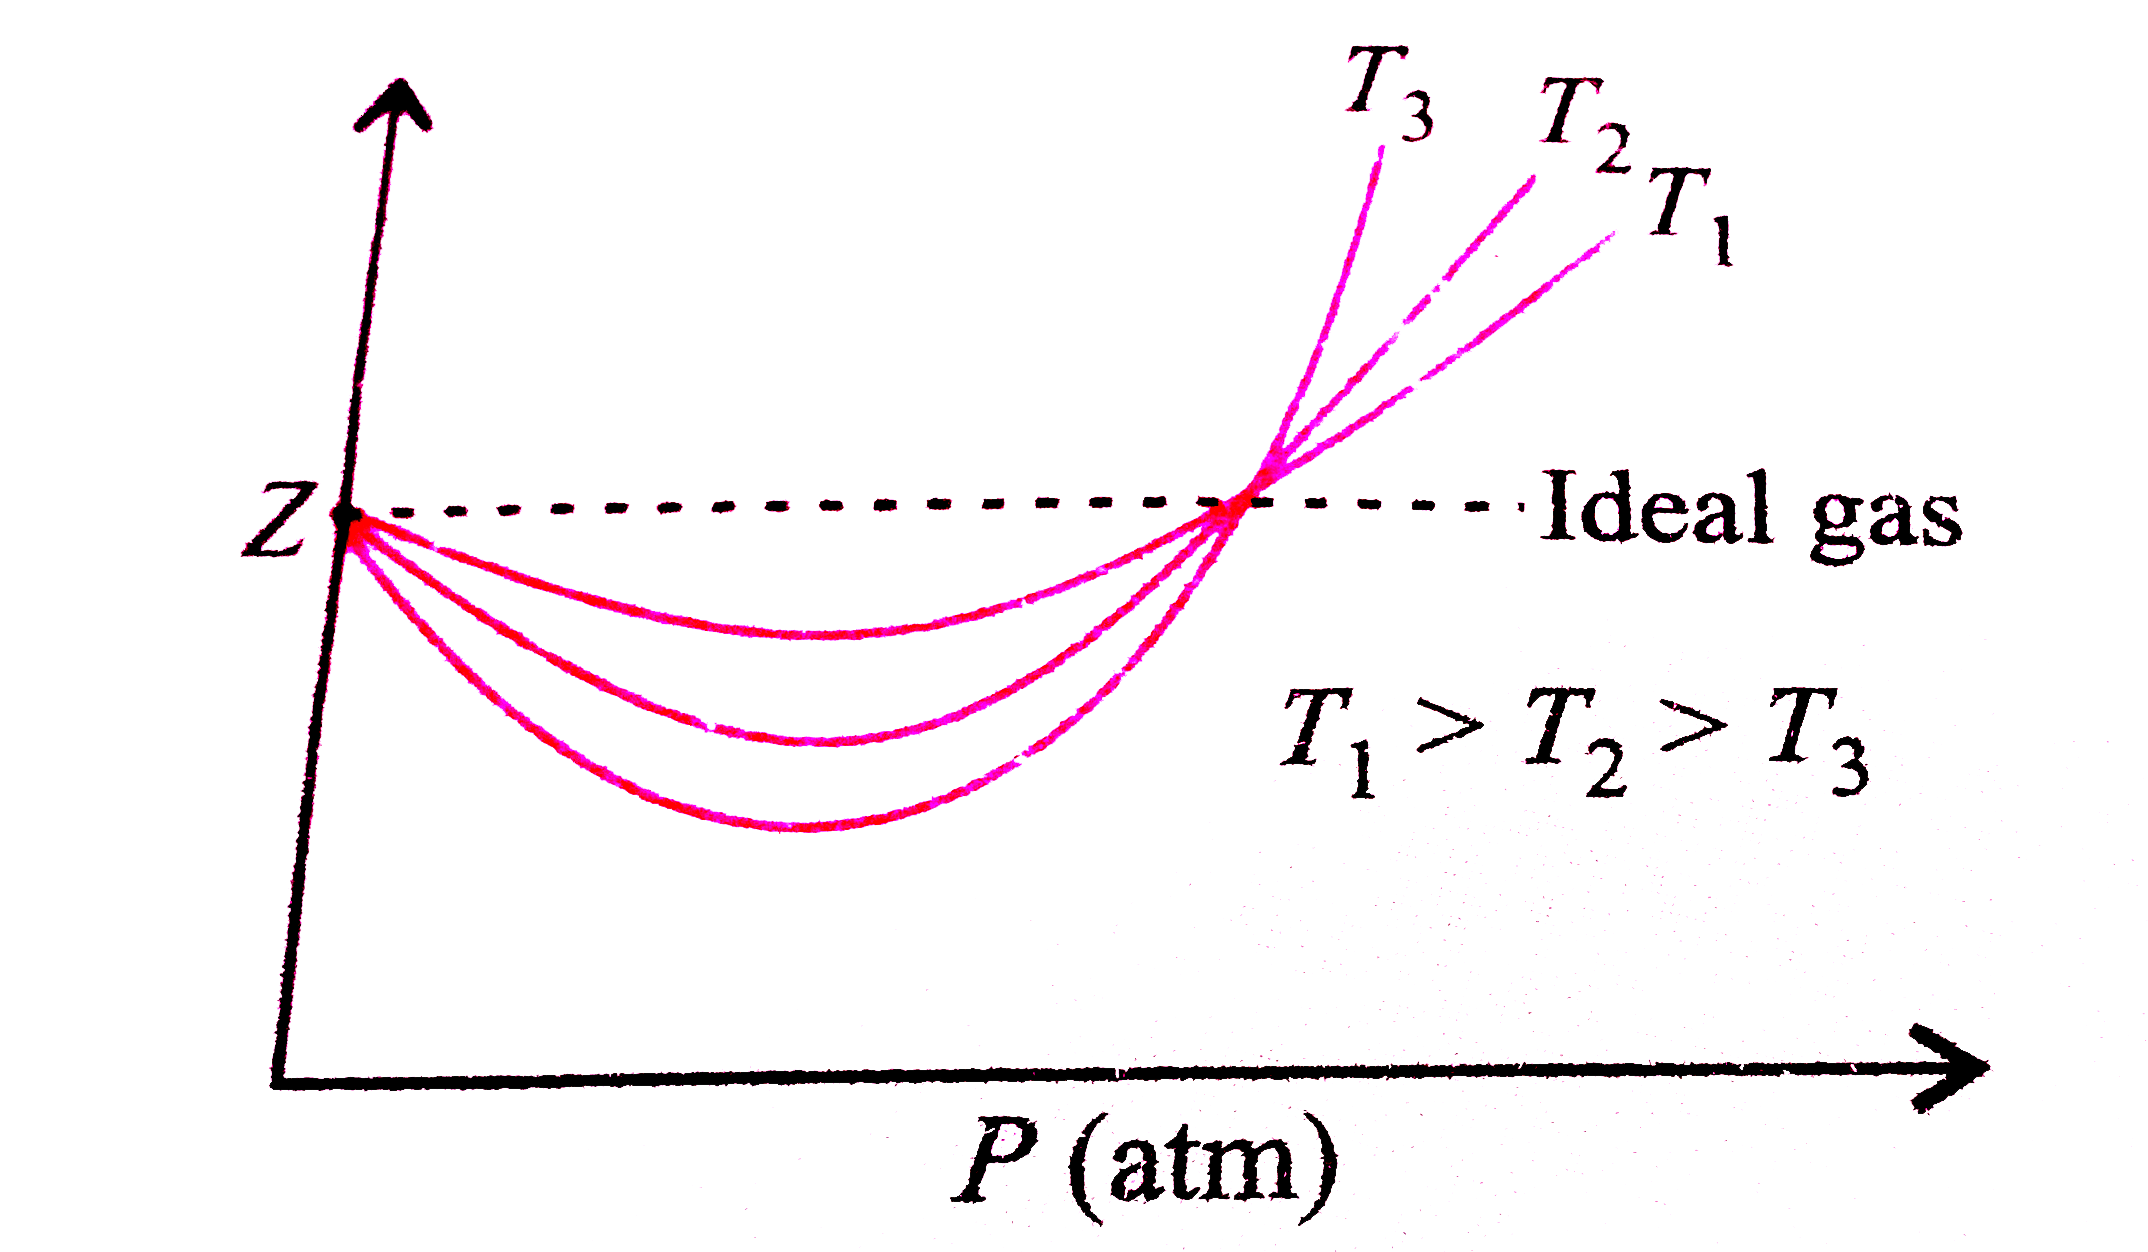
Draw a graph to show the deviation of real gas from Boyle's law.
To draw a graph showing the deviation of a real gas from Boyle's law, we will follow these steps:
1. Understand Boyle's Law:
- Boyle's Law states that at a constant temperature, the volume (V) of a gas is inversely proportional to its pressure (P). This can be mathematically expressed as PV=k, where k is a constant.
2. Graph Setup:
- Set up a Cartesian coordinate system where the vertical axis (Y-axis) represents pressure (P) and the horizontal axis (X-axis) represents volume (V).
3. Plotting Ideal Gas Behavior:
- For an ideal gas, the relationship PV=k results in a rectangular hyperbola. This means that as the volume increases, the pressure decreases, and vice versa.
- Draw a smooth curve that represents this relationship, which will be the ideal gas curve. Label this curve as "Ideal Gas".
4. Understanding Real Gas Behavior:
- Real gases deviate from ideal behavior, especially at low pressures and high temperatures. The deviation occurs due to the presence of intermolecular forces and the volume occupied by gas molecules.
- At high pressures, real gases behave similarly to ideal gases, but as the pressure decreases, the deviation becomes more pronounced.
5. Plotting Real Gas Behavior:
- Draw a second curve that starts close to the ideal gas curve at high pressures but diverges away from it as pressure decreases. This curve should be labeled as "Real Gas".
- The area between the two curves represents the deviation of the real gas from ideal gas behavior.
6. Labeling the Graph:
- Clearly label the axes (Pressure on Y-axis and Volume on X-axis).
- Indicate the curves for Ideal Gas and Real Gas.
- Optionally, you can add annotations to highlight the regions of deviation.
Final Graph:
- The graph should show two curves: one for the ideal gas (rectangular hyperbola) and one for the real gas (which diverges from the ideal gas curve at lower pressures).
- Boyle's Law states that at a constant temperature, the volume (V) of a gas is inversely proportional to its pressure (P). This can be mathematically expressed as PV=k, where k is a constant.
- Set up a Cartesian coordinate system where the vertical axis (Y-axis) represents pressure (P) and the horizontal axis (X-axis) represents volume (V).
- For an ideal gas, the relationship PV=k results in a rectangular hyperbola. This means that as the volume increases, the pressure decreases, and vice versa.
- Draw a smooth curve that represents this relationship, which will be the ideal gas curve. Label this curve as "Ideal Gas".
- Real gases deviate from ideal behavior, especially at low pressures and high temperatures. The deviation occurs due to the presence of intermolecular forces and the volume occupied by gas molecules.
- At high pressures, real gases behave similarly to ideal gases, but as the pressure decreases, the deviation becomes more pronounced.
- Draw a second curve that starts close to the ideal gas curve at high pressures but diverges away from it as pressure decreases. This curve should be labeled as "Real Gas".
- The area between the two curves represents the deviation of the real gas from ideal gas behavior.
- Clearly label the axes (Pressure on Y-axis and Volume on X-axis).
- Indicate the curves for Ideal Gas and Real Gas.
- Optionally, you can add annotations to highlight the regions of deviation.
- The graph should show two curves: one for the ideal gas (rectangular hyperbola) and one for the real gas (which diverges from the ideal gas curve at lower pressures).
Topper's Solved these Questions
- PROPERTIES OF MATTERBook:ICSEChapter:PROPERTIES OF MATTERExercise:MODULE 3 (KINETIC THEORY OF GASES ) VERY SHORT ANSWER QUESTIONS
Explore 11 Videos
- PROPERTIES OF MATTERBook:ICSEChapter:PROPERTIES OF MATTERExercise:MODULE 3 (KINETIC THEORY OF GASES ) FROM GAS LAW AND EQUATION OF STATE
Explore 12 Videos
- PROPERTIES OF MATTERBook:ICSEChapter:PROPERTIES OF MATTERExercise:MODULE 3 (KINETIC THEORY OF GASES ) LONG ANSWER QUESTIONS
Explore 9 Videos
- OSCILLATIONS Book:ICSEChapter:OSCILLATIONS Exercise:SELECTED PROBLEMS (OSCILLATION IN A TUNNEL BORED THROUGH THE EARTH)
Explore 2 Videos
- SAMPLE QUESTION PAPER - 01 Book:ICSEChapter:SAMPLE QUESTION PAPER - 01 Exercise:SECTION - D
Explore 12 Videos
Similar Questions
Knowledge Check
Boyle.s Law is
AP1V1=P2V2BP2V1=P1V2CV1T1=V2T2DV1T1=V2T2
Boyle's temperature or Boyle point is the temperature at which a real gas starts behaving like an ideal gas over a particular range of pressure. A graph is plotted between compressibility factor Z and pressure P.

What is the deviation of real gas from ideal behaviour in terms of compressibility factor , Z ?
View SolutionWhat are ideal and real gases? What is the cause of deviation of real gases from the ideal gas behaviour ?
View SolutionDraw the plot log P vs log V for Boyle's law.
View SolutionAccording to Boyle's law
View SolutionEquation for Boyle's law is
View SolutionHow does the angle of deviation formed by a prism change with the increase in the angle of incidence ?
Draw a graph showing the variation in the angle of deviation with the angle of incidence at a prism surface.
View SolutionState Boyle.s Law.
View Solution