Draw a schematic of a graph of the applied force versus resulting elongation of a metallic wire. Show the elastic limit on this graph. What feature of this graph is related to the value of Young's modulus of material of wire?Solution in Punjabi
Step by step video & image solution for Draw a schematic of a graph of the applied force versus resulting elongation of a metallic wire. Show the elastic limit on this graph. What feature of this graph is related to the value of Young's modulus of material of wire? by Physics experts to help you in doubts & scoring excellent marks in Class 11 exams.
Updated on:21/07/2023Topper's Solved these Questions
Similar Questions
Discuss stress-strain graph.
View SolutionA bend in a level road has radius of 100 m.Find the maximum speed with which a car turning this bend may have without skidding ,if the coefficient of friction between the tyres and road is 0.8.
View SolutionDistinguish between streamline and turbulent flow of a liquid.
View Solution
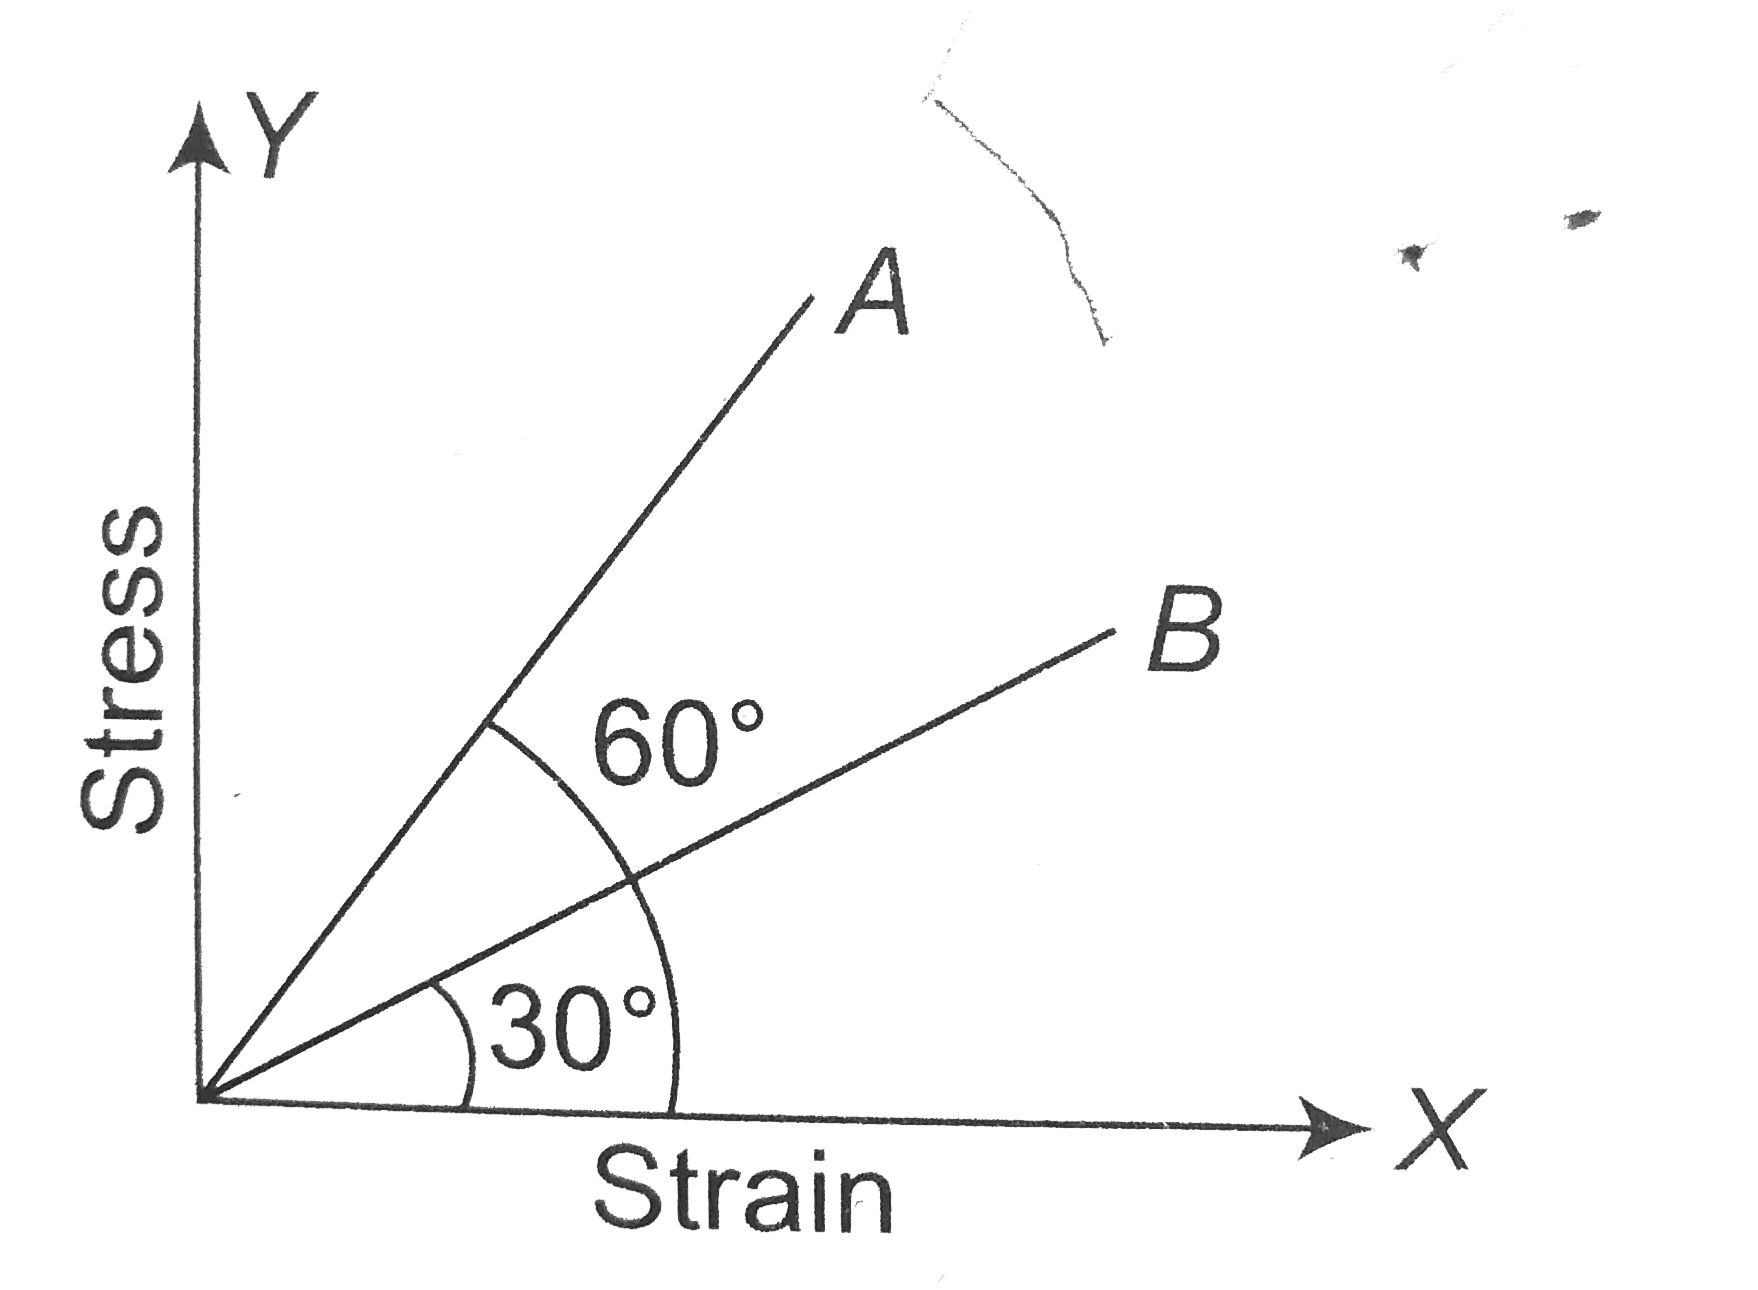
The stress versus strain graphs for wires of two materials A and B are as shown in the figure. If YA and YB are the Young's moduli of the materials then
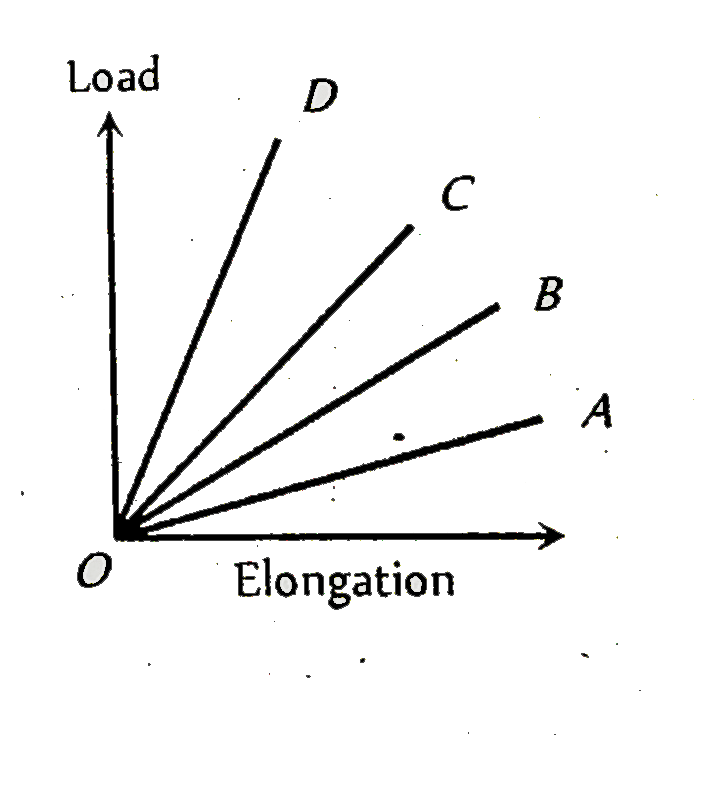
View SolutionThe load versus elongation graph for four wires of the same material and same length is shown in the figure. The hinnest wire is represented by the line
View SolutionThe load versus elongation graph for four wires of the same material is shown in the figure. The thickest wire is represented by

View Solutionधातु के तार से लटकाये गये भार तथा लम्बाई में वृद्धि के बीच ग्राफ खींचिए तथा ग्राफ पर प्रत्यास्थता की सीमा को अंकित कीजिए | इस ग्राफ का कौन-सा भाग तार के पदार्थ के यंग गुणांक से सम्बन्ध रखता है ?
View SolutionThe load versus elongation graph of four wires of same length and the same material as shown in the figure. The thinest wire is represented by the line
View SolutionThe graph between applied force and change in the length of wire within elastic limit is a
View SolutionThe graph between applied force and change in the length of wire within elastic limit is a
View SolutionGraph between the applied force and the change in length of a wire within elastic limit is a
View SolutionThe stress versus strain graphs for wires of two materials A and B are as shown in the figure. If Y_A and Y_B are the Young's modulii of the materials, then
View SolutionGraph between the applied force and the change in length of a wire within elastic limit is a
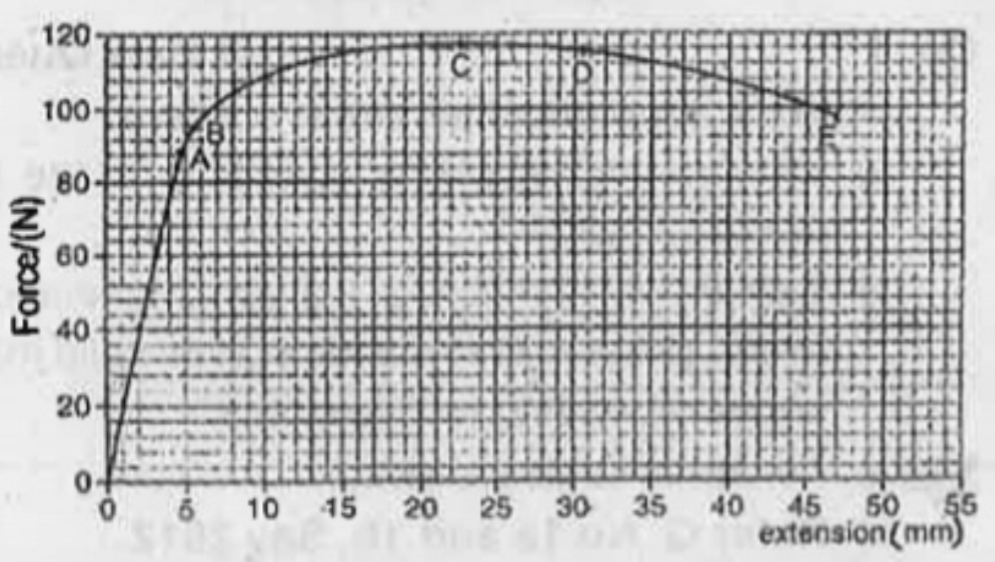
View SolutionThe graph below shows how the force applied to a metal wire is related to the extension of the wire. The wire has an unstretched length of 2.30m and an area of cross section of 3.90×10⁻⁷m2. Determine the Young's modulus Y of the material.

View SolutionThe stress versus strain graphs for wires of two materials A and B are as shown in the figure. If YAandYB are the Young's modulli of the materials, then

View SolutionThe load versus elongation graph for four wires of the same material is shown in the figure. The thickest wire is represented by

View Solution
