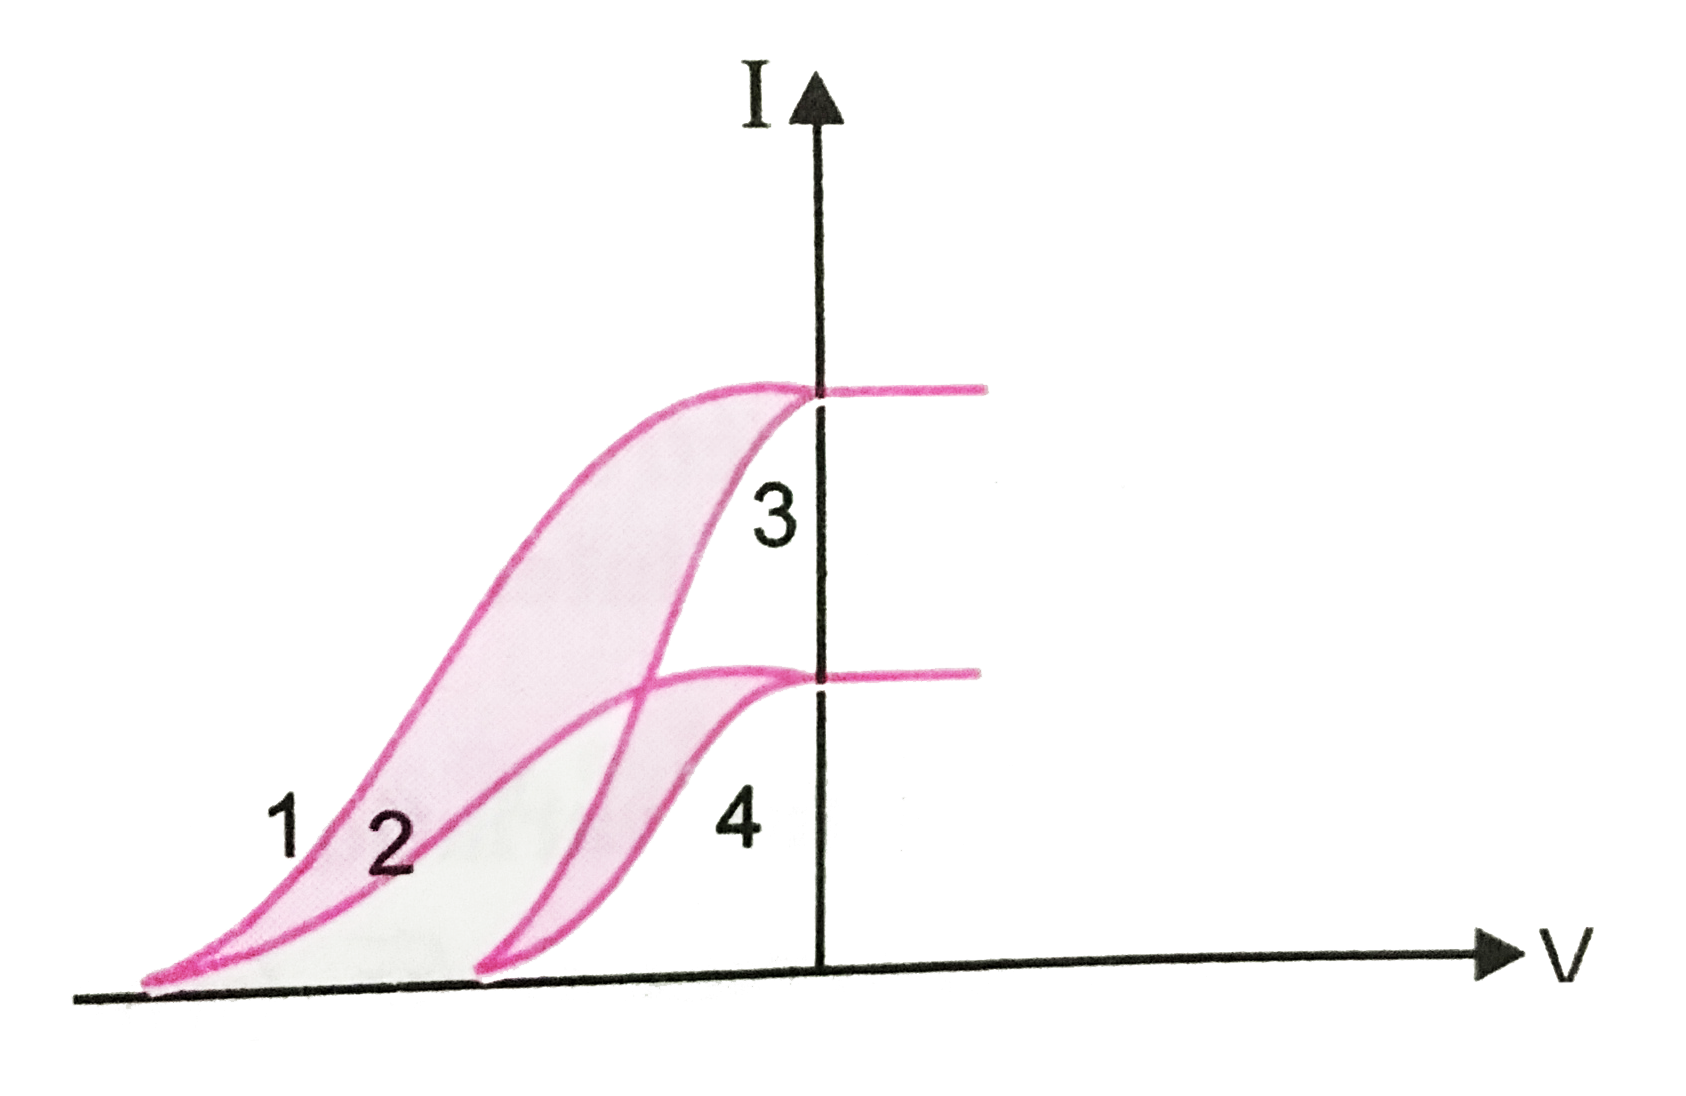
Draw graphs showing variation of photoelectric current with applied voltage for three incident radiations of equal frequency and different intensities. Mark the graph for the radiation of higher intensity.
Graphs have been shown in figure.
Here I3>I2>I1.

Topper's Solved these Questions
- BOOK - U-LIKE SERIESCHAPTER - DUAL NATURE OF RADIATION AND MATTEREXERCISE - SHORT ANSWER QUESTIONS27videos
DUAL NATURE OF RADIATION AND MATTER
- BOOK - U-LIKE SERIESCHAPTER - DUAL NATURE OF RADIATION AND MATTEREXERCISE - LONG ANSWER QUESTIONS19videos
DUAL NATURE OF RADIATION AND MATTER
- BOOK - U-LIKE SERIESCHAPTER - DUAL NATURE OF RADIATION AND MATTEREXERCISE - ASSERTION REASON TYPE QUESTIONS5videos
DUAL NATURE OF RADIATION AND MATTER
- BOOK - U-LIKE SERIESCHAPTER - CURRENT ELECTRICITY EXERCISE - SELF ASSESSMENT TEST (SECTION C )3videos
CURRENT ELECTRICITY
- BOOK - U-LIKE SERIESCHAPTER - ELECTRIC CHARGES AND FIELDS EXERCISE - SELF ASSESSMENT TEST (SECTION-B) (VERY SHORT ANSWER QUESTIONS)4videos
ELECTRIC CHARGES AND FIELDS
Similar Questions
Darw graphs showing variation of photoelctric current with applied voltage for two incident radiations of equal frequecny and different intensities. Mark the graph for the radiaiton of higher intensity.
View SolutionDarw graphs showing variation of photoelctric current with applied voltage for two incident radiations of equal frequecny and different intensities. Mark the graph for the radiaiton of higher intensity.
View SolutionDarw graphs showing variation of photoelctric current with applied voltage for two incident radiations of equal frequecny and different intensities. Mark the graph for the radiaiton of higher intensity.
View SolutionPlot a graph showing the variation of photoelectric current with anode potential for two light beam of same wavelength but different intensity.
View SolutionHow does the photoelectric current vary with the intensity of incident radiation?
View SolutionDraw a plot showing the variation of photoelectric current versus the intensity of incident radiation on a given photosensitive surface.
View SolutionDraw a plot showing the variation of photoelectric current versus the intensity of incident radiation on a given photosenstive surface.
View SolutionDraw a plot showing the variation of photoelectric current versus the intensity of incident radiation on a given photosenstive surface.
View SolutionDraw suitable graphs to show the variation of photoelectric current with collector plate potential for
(i) a fixed frequency but different intensities I1>I2>I3 of radiation.
(ii) a fixed intensity but different frequencies v1>v2>v3 of radiation.View SolutionThe graph of Fig. shows the variation of photoelectric current (I) versus applied voltage (V) for the two different photosensitive materials for two different intensities of the incident radiation. Identify the pairs of curves that correspond to different materials but same intensity of incident radiation.
 View Solution

