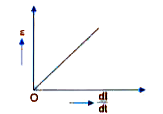
Draw the graph showing variation of the value of the induced emf as a function of rate of change of current flowing through an ideal inductor.
Topper's Solved these Questions
- CBSE EXAMINATION PAPER 2020 BOOK - U-LIKE SERIESCHAPTER - CBSE EXAMINATION PAPER 2020 EXERCISE - SECTION B
1 Videos
- CBSE EXAMINATION PAPER 2020 BOOK - U-LIKE SERIESCHAPTER - CBSE EXAMINATION PAPER 2020 EXERCISE - SECTION C
10 Videos
- CBSE EXAMINATION PAPER 2020 BOOK - U-LIKE SERIESCHAPTER - CBSE EXAMINATION PAPER 2020 EXERCISE - SECTION A (Fill in the blanks with appropriate answer )
6 Videos
- ATOMSBOOK - U-LIKE SERIESCHAPTER - ATOMSEXERCISE - SELF ASSESSMENT TEST (SECTION C)
2 Videos
- CBSE EXAMINATION PAPER 2020 (SOLVED)BOOK - U-LIKE SERIESCHAPTER - CBSE EXAMINATION PAPER 2020 (SOLVED)EXERCISE - SECTION D
11 Videos
Similar Questions
Knowledge Check
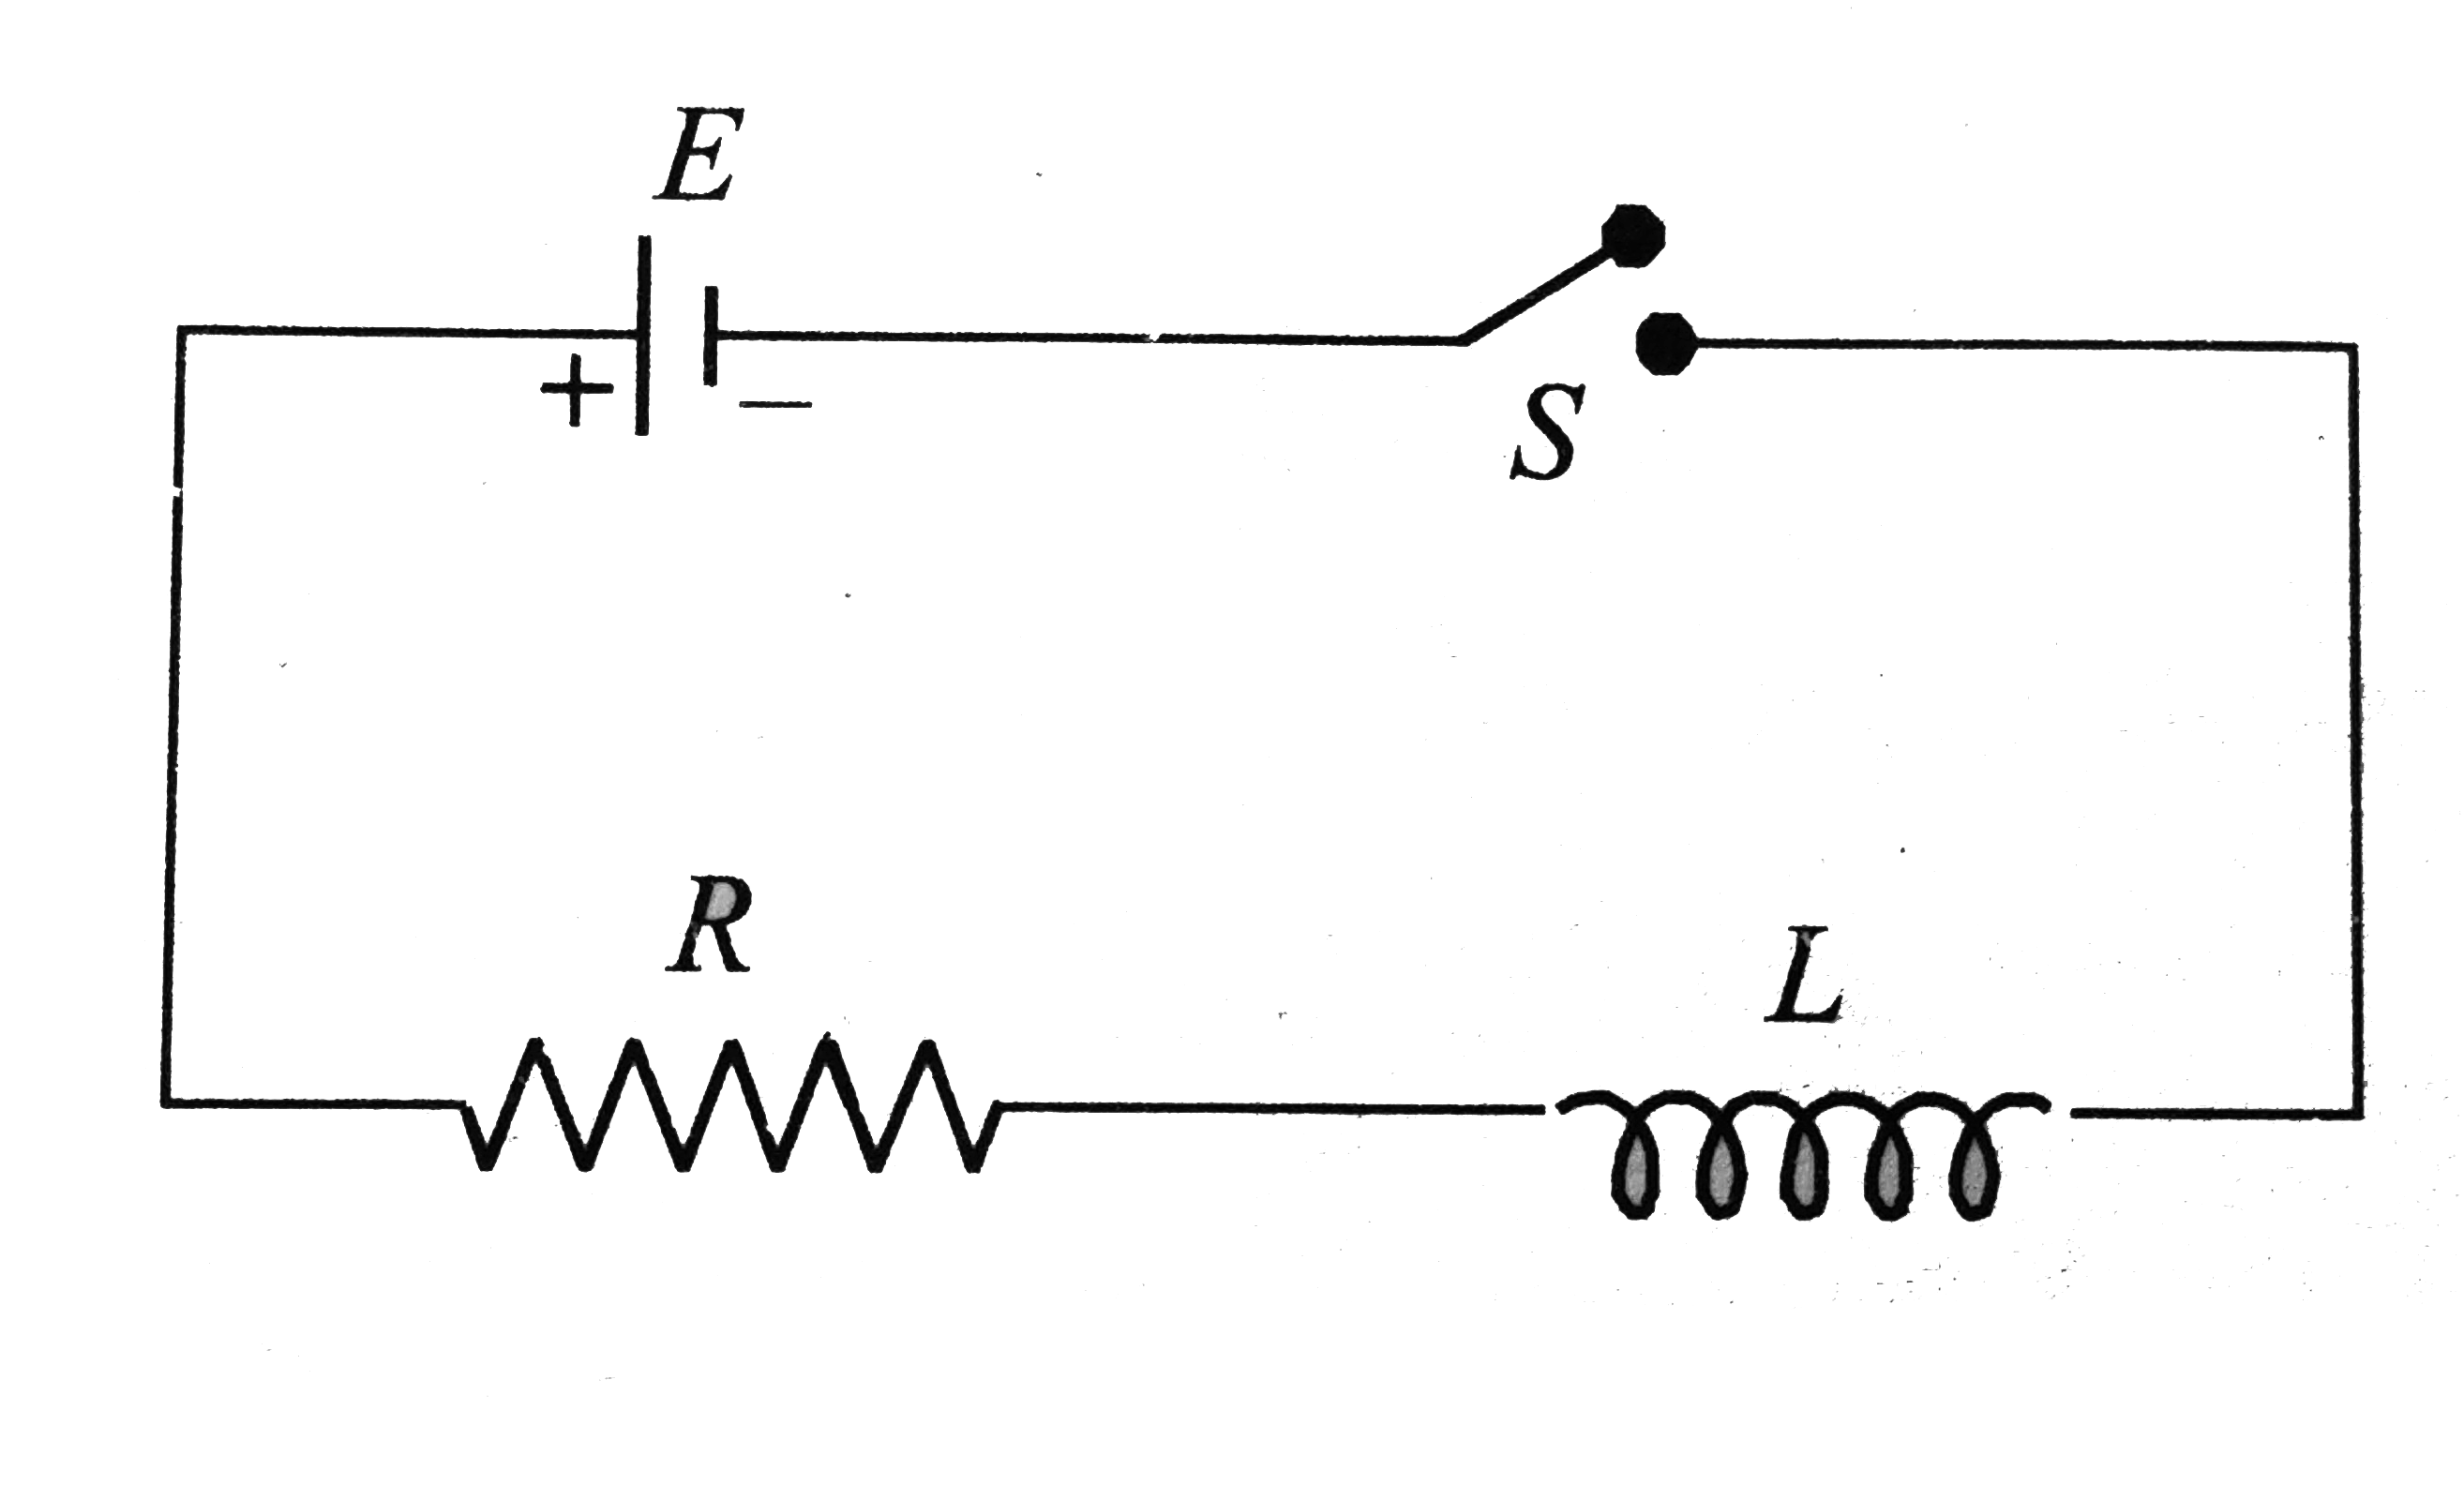
Switch S of the circuit shows in Fig is closed at t=0. If e denotes the induced emf in L and I is the current flowing through the circuit the circuit at time t, which of the following graphs is//are correct?
 A
A B
B C
C D
D
Draw a graph showing the variation of decay rate with number of active nuclei.
View SolutionDraw a graph showing the variation of decay rate with number of active nuclei.
View SolutionThe current through two inductors of self inductance 12 mH and 30 mH is increasing with time at the same rate. Draw graphs showing the variation of the (a ) e.m.f. induced with the rate of change of current in each inductor. (b) enargy stored in each inductor with the current flowing through it.
Compare the energy stored in the coils if power dissipated in the coil is same.
View Solution(a) The current through two inductors, of self-inductance 12 mH and 30 mH respectively, is increasing with time at the same rate. Draw graphs showing the variation of the
(i) emf induced with the rate of change of current in each inductance,
(ii) energy stored in each inductor with the current flowing through it.
(b) Compare the energy stored in the coils if the power dissipated in the coils is the same.
View SolutionSketch a graph showing the variation of reactance of an inductor with frequency of the applied voltage
View SolutionSwitch S of the circuit shows in Fig. is closed at t=0. If e denotes the induced emf in L and i the current flowing through the circuit at time t, then which of the following graphs correctly represents the variation of e with i?

View Solution

