Fig. shows the velocity time graph of a particle. Does it represent one dimensional motion?
No. As can be seen from the figure the particle has two velocities v1 and v2 at the same time t1 in the opposite directions.

Topper's Solved these Questions
- DYNAMICSBOOK - ICSECHAPTER - DYNAMICSEXERCISE - SHORT ANSWER QUESTIONS
93 Videos
- DYNAMICSBOOK - ICSECHAPTER - DYNAMICSEXERCISE - VERY SHORT ANSWER QUESTIONS
60 Videos
- DYNAMICSBOOK - ICSECHAPTER - DYNAMICSEXERCISE - ADDITIONAL SOLVED PROBLEMS
138 Videos
- DIMENSIONSBOOK - ICSECHAPTER - DIMENSIONSEXERCISE - SELECTED PROBLEMS (FROM CONVERSIONS OF ONE SYSTEMS OF UNITS INTO ANOTHER)
9 Videos
- FRICTIONBOOK - ICSECHAPTER - FRICTIONEXERCISE - Selected problems
30 Videos
Similar Questions
Knowledge Check
Figure shows the position time graph for a particle in one dimensional motion. What is the displacement of the particle in first 4 seconds ?
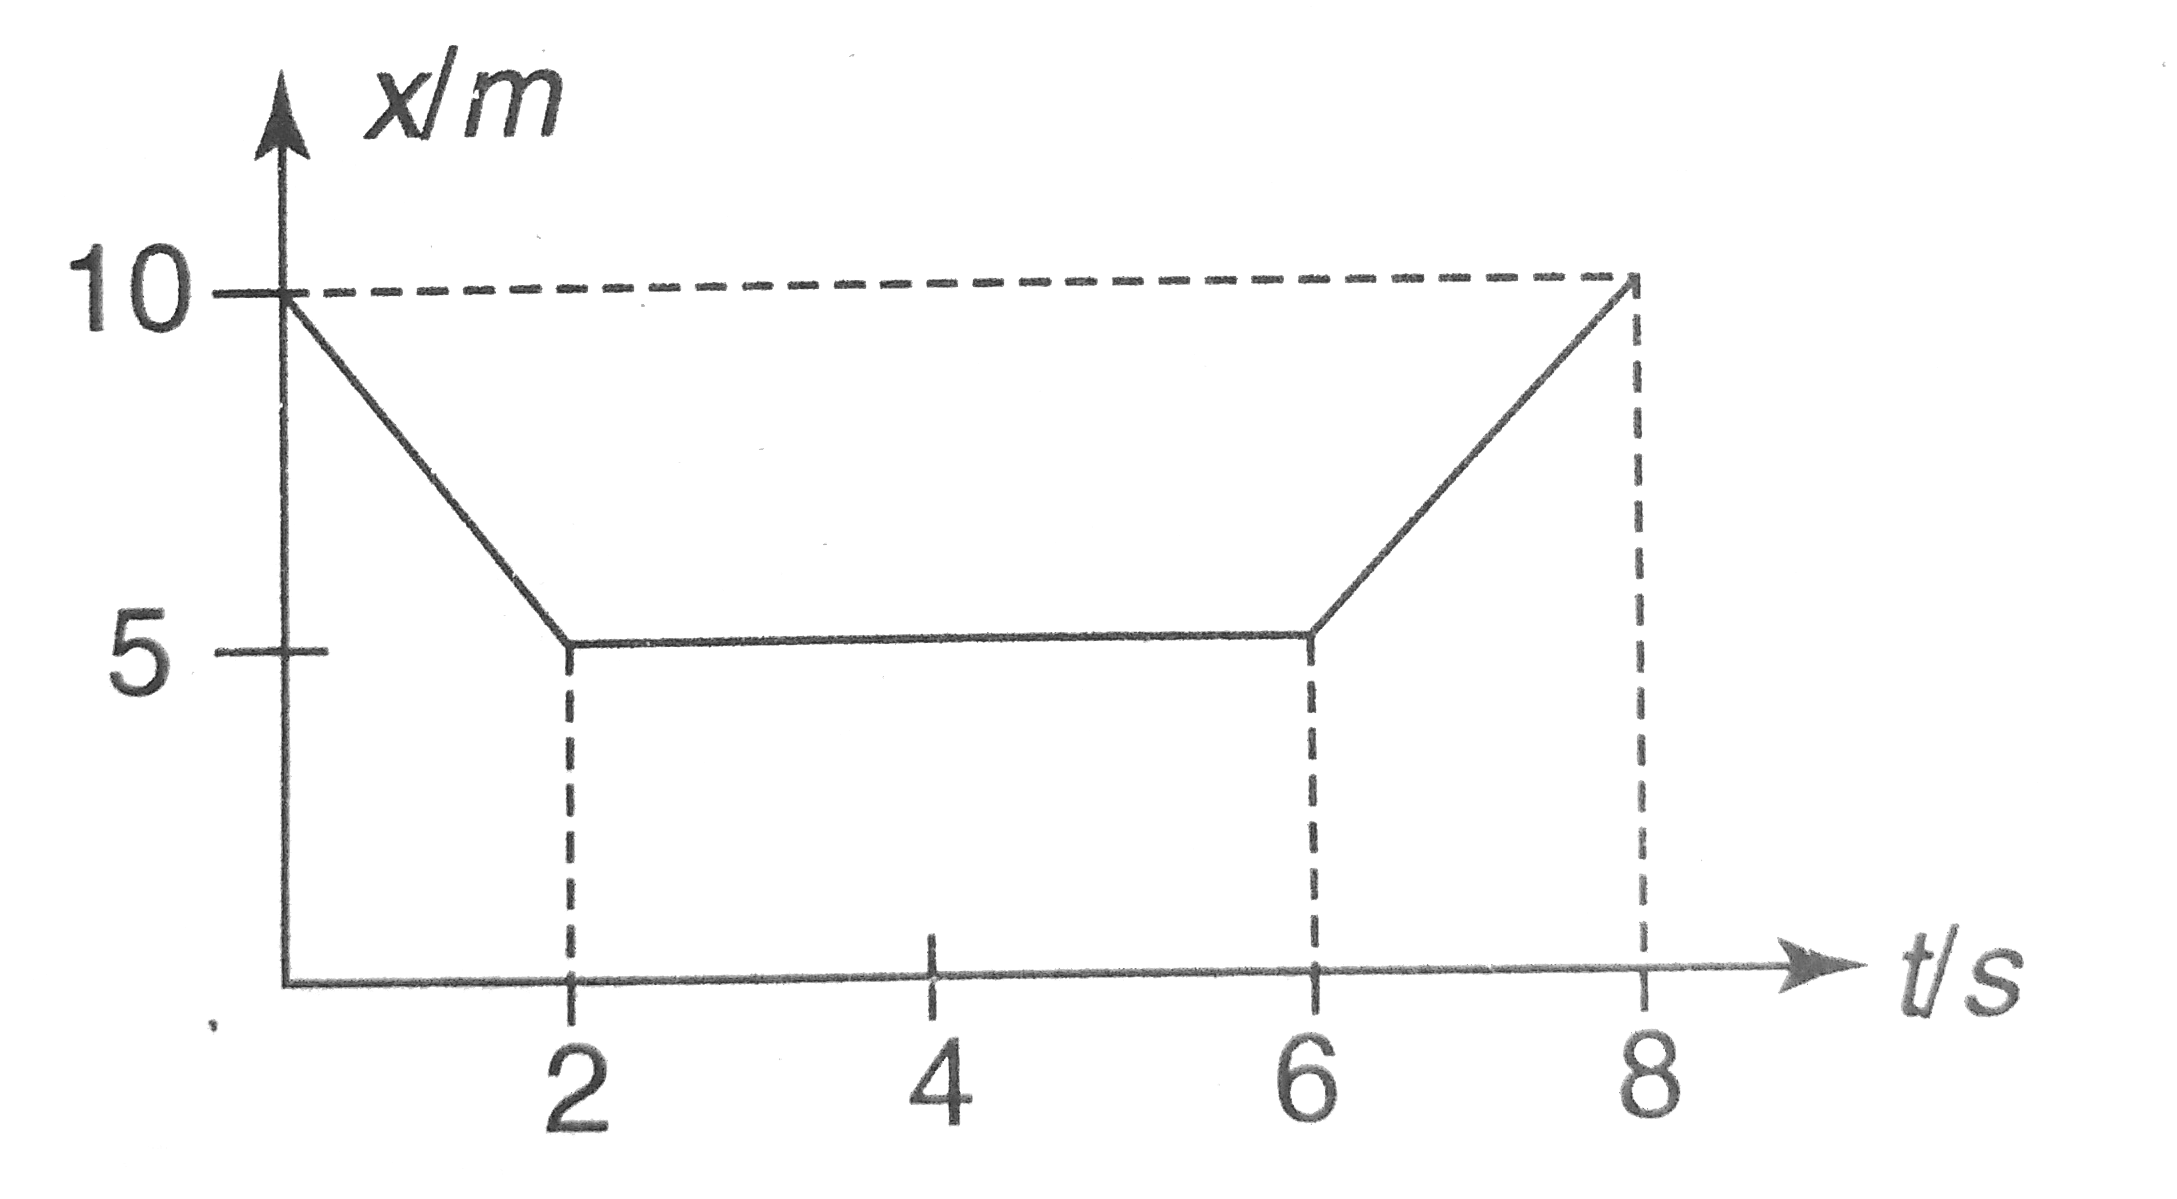 A5 mB−5mCzeroD15 m
Figure shows the position the graph for a particle in one dimensional motion. Which of the graphs in fugure represent the variation in the velocity of the particle with time ?
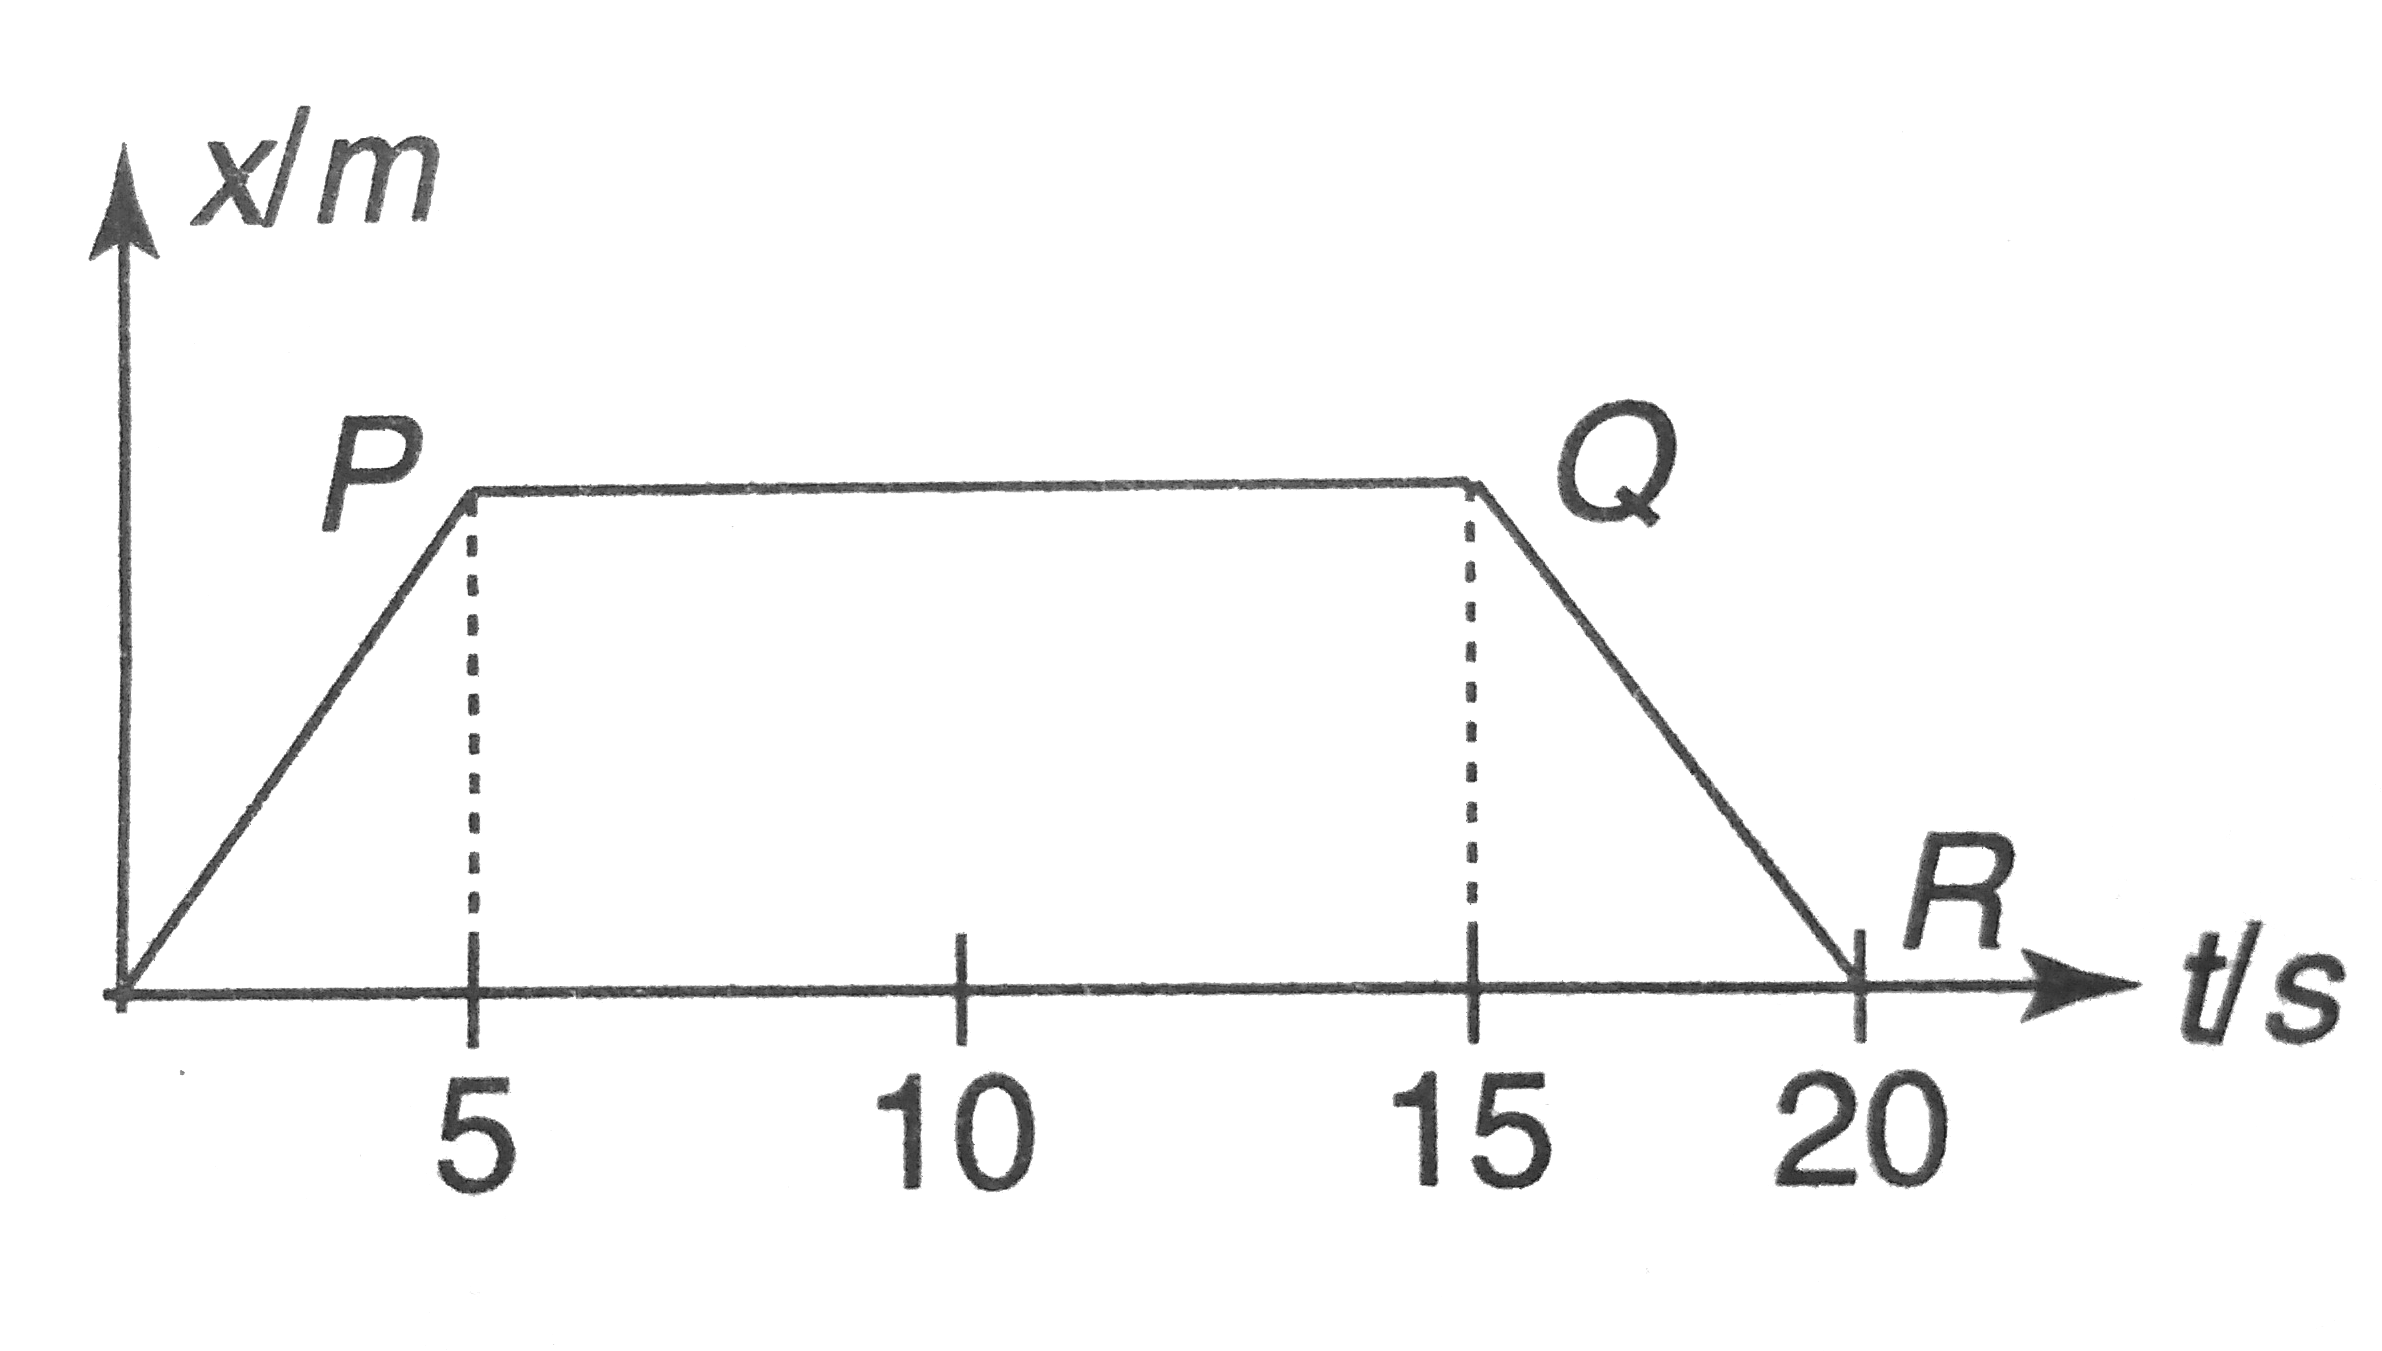 A
A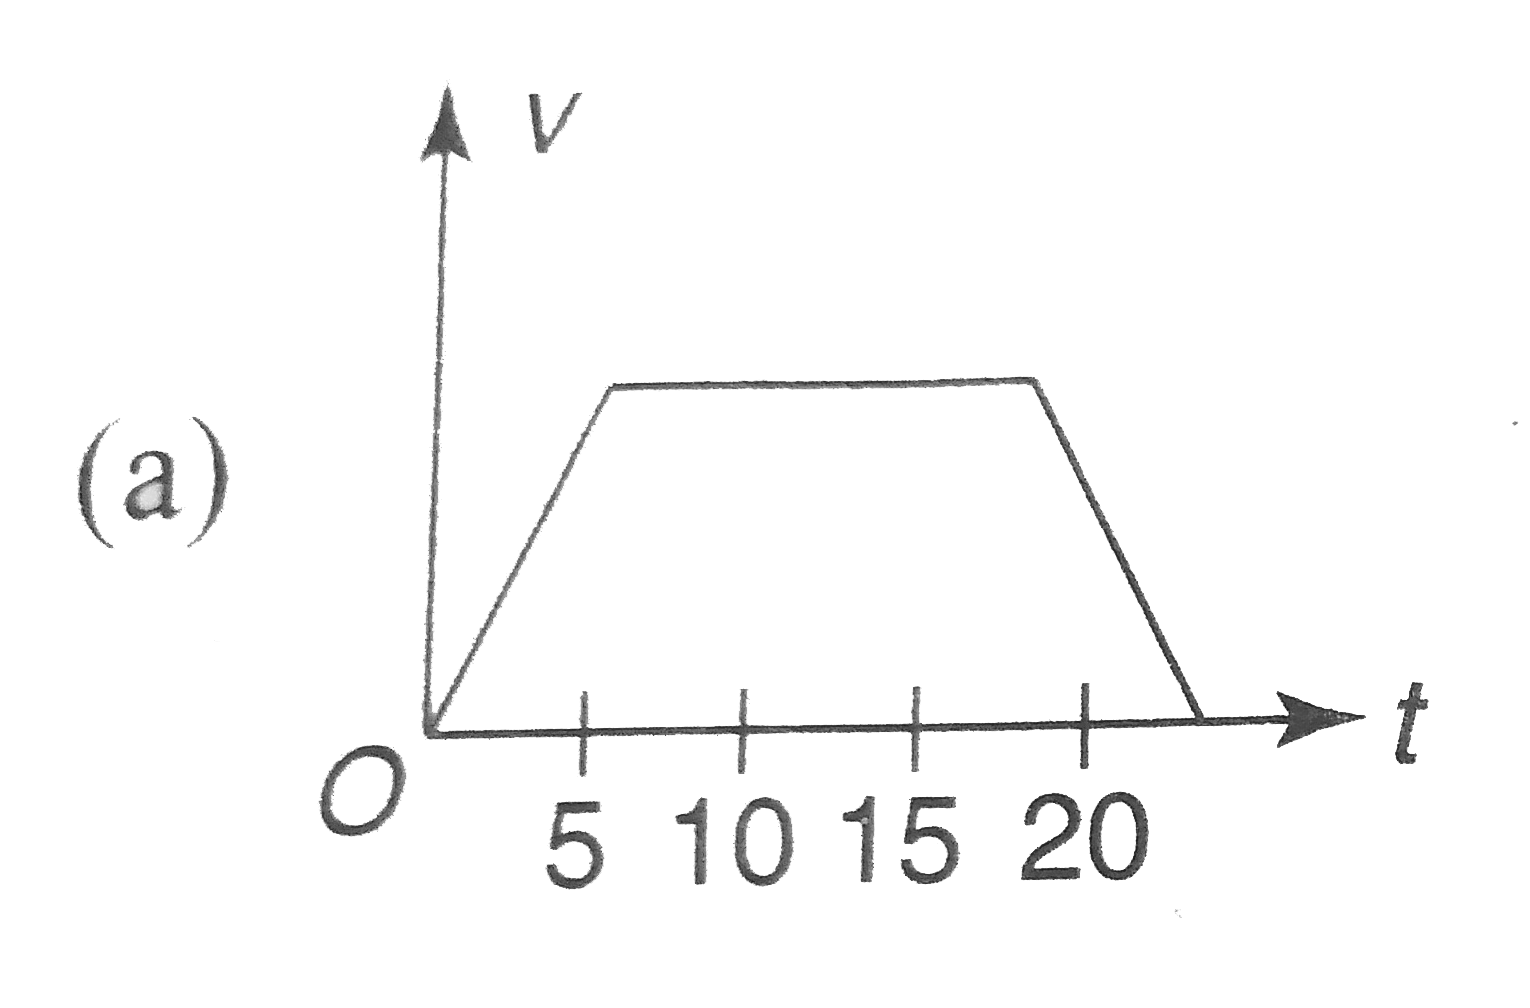 .B
.B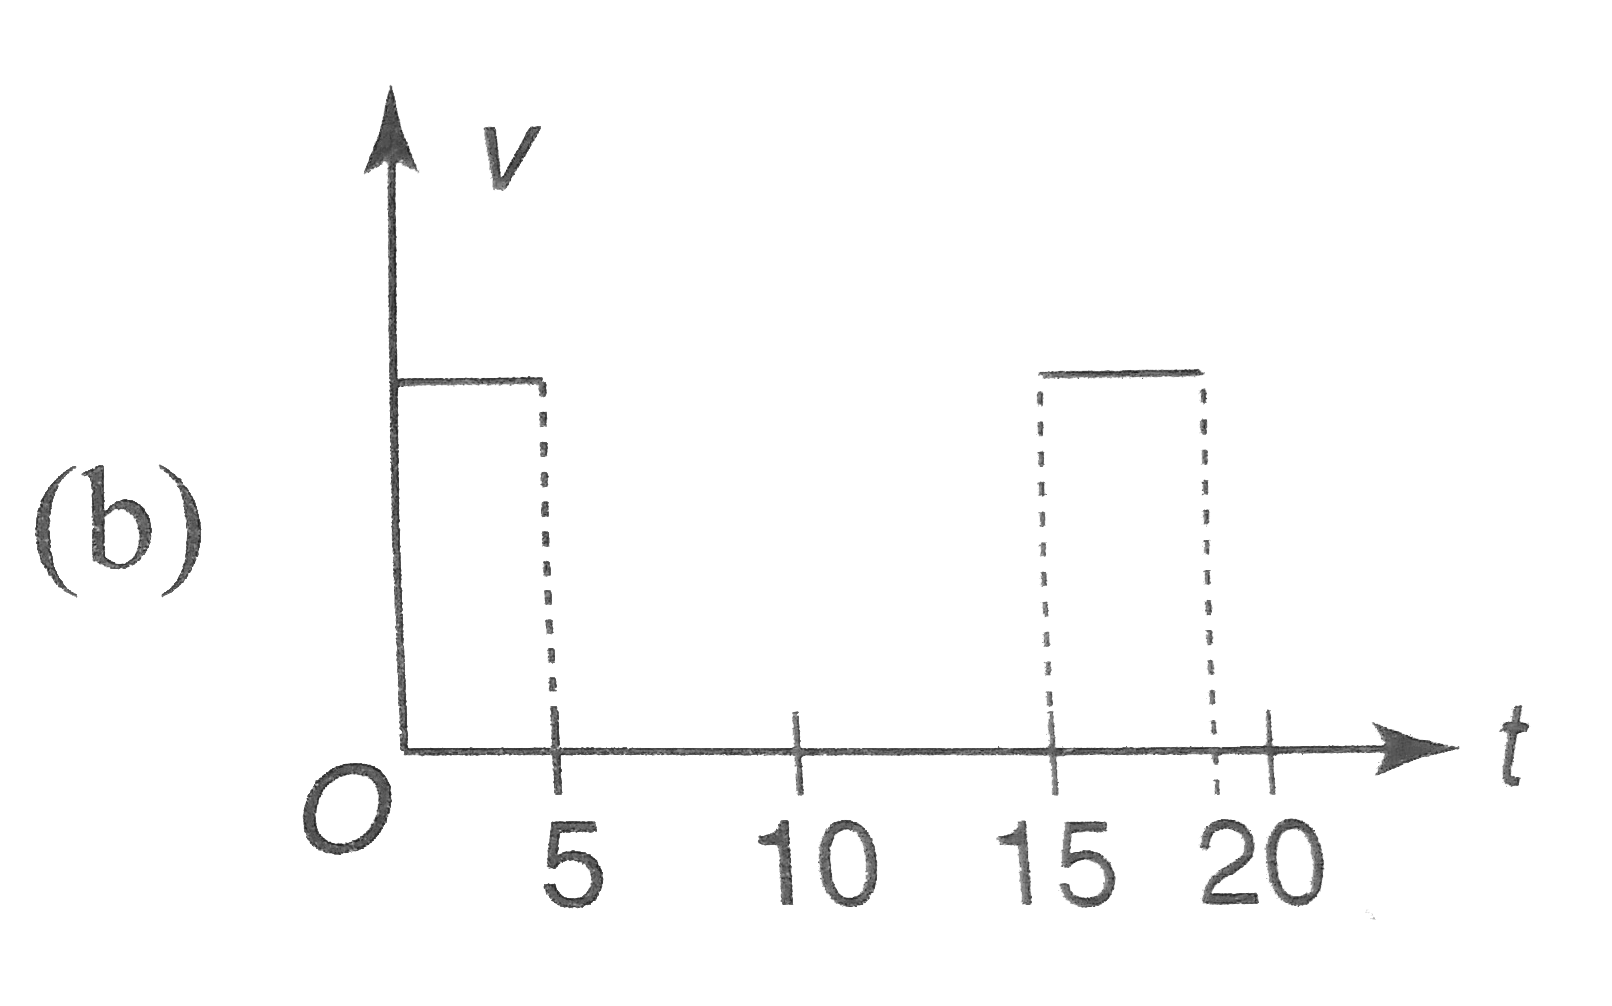 .C
.C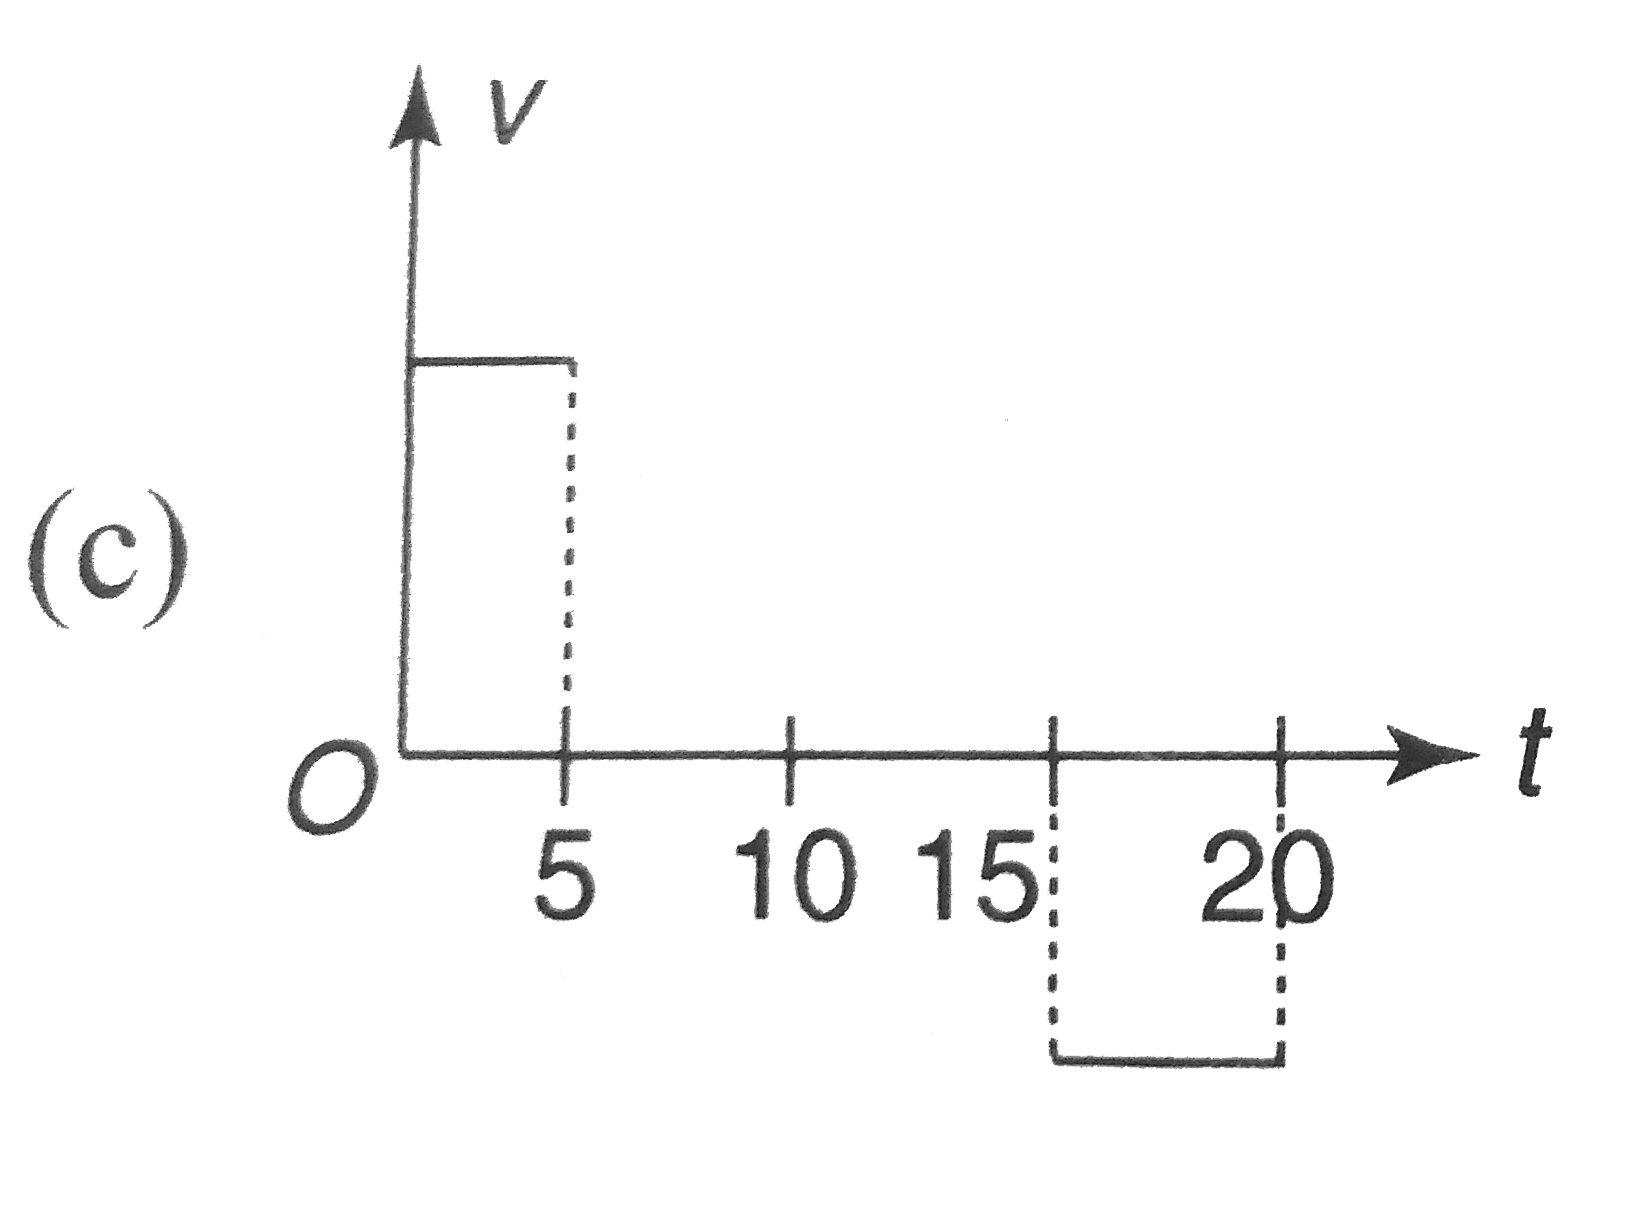 .D
.D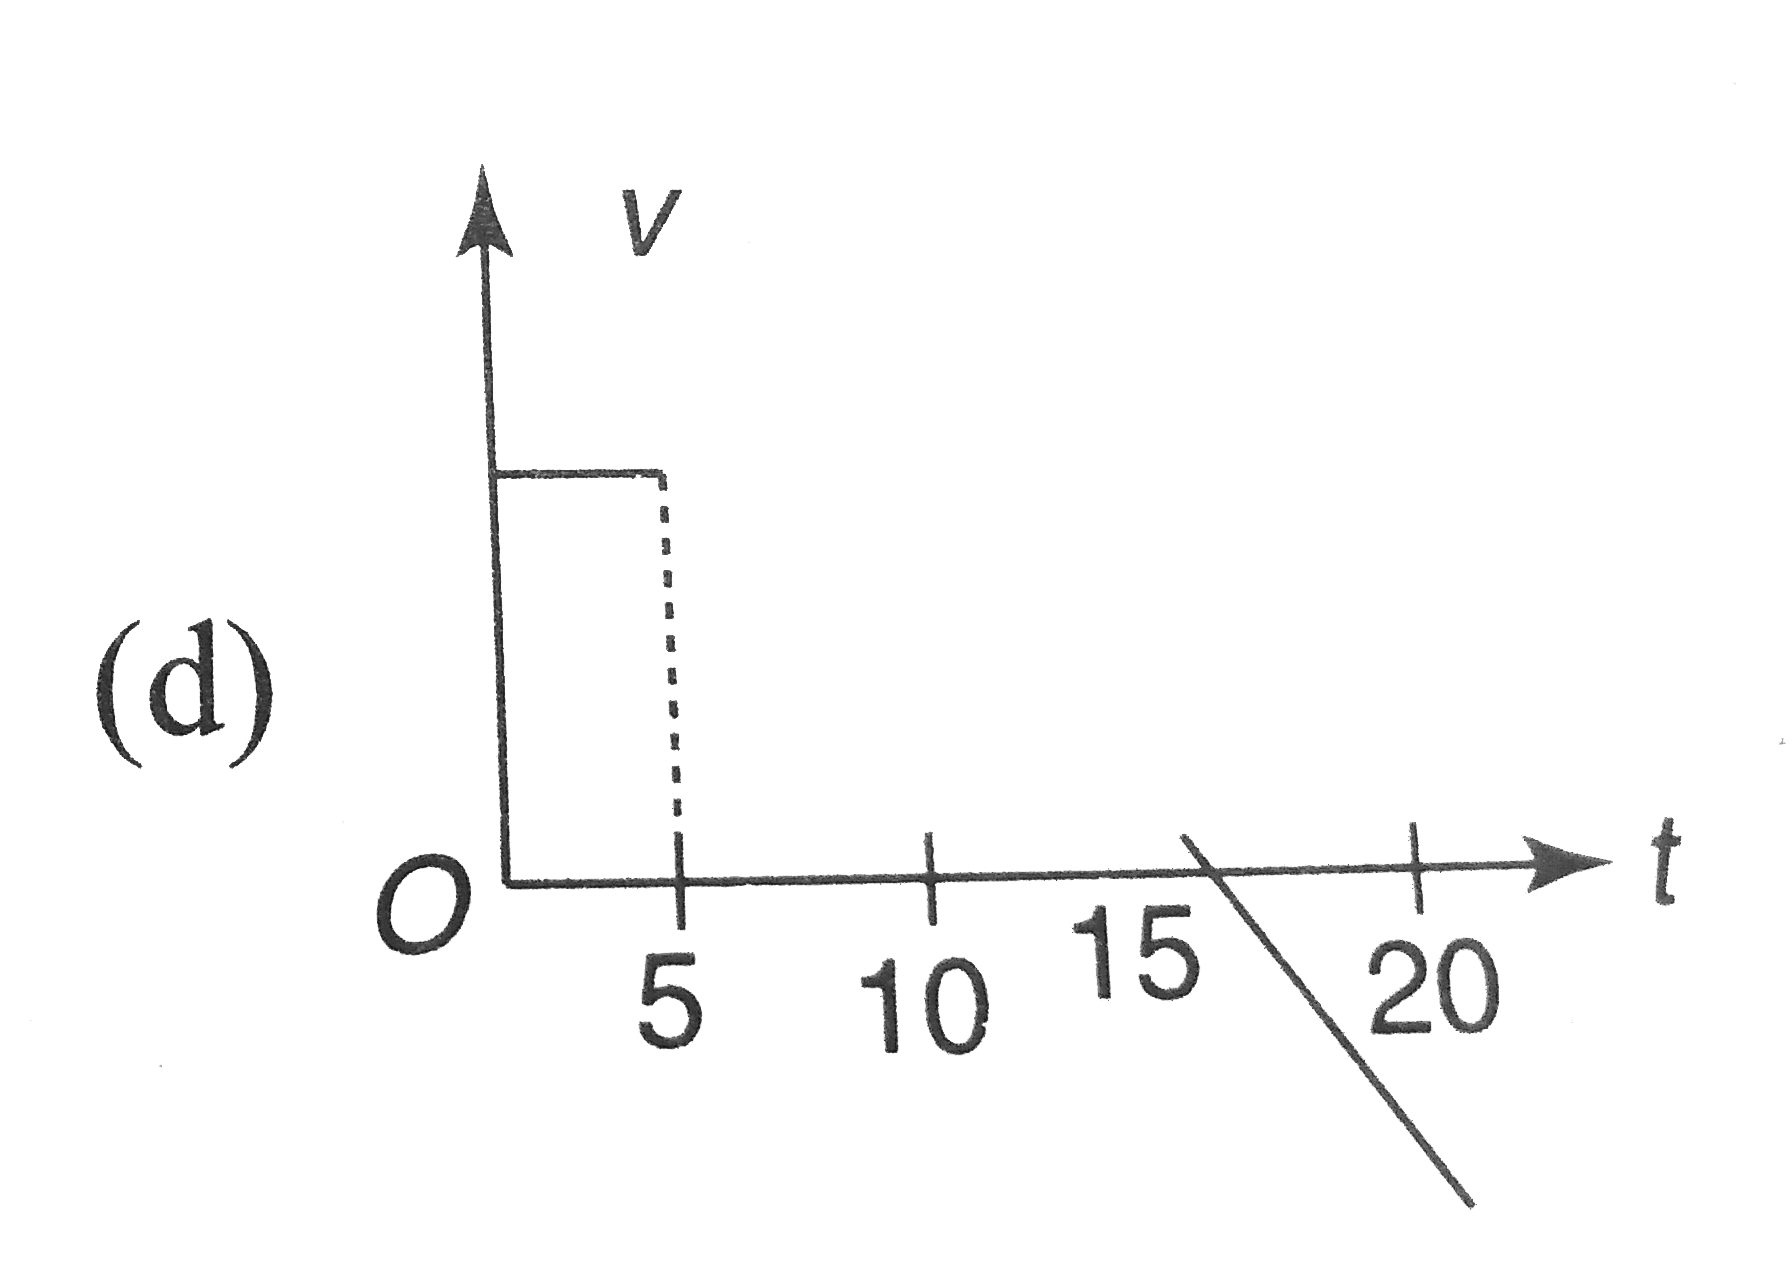 .
.The velocity-time graph of particle comes out to be a non-linear curve. The motion is
Auniform velocity motionBuniformly accelerated motionCnon-uniform accelerated motionDNothing can be said about the motion
Figure below shows the velocity-time graph of a one dimensional motion. Which of the following characteristic of the particle is represented by the shaded area?

View SolutionFigure below shows the velocity-time graph of a one dimensional motion. Which of the following characteristic of the particle is represented by the shaded area?

View SolutionThe velocity-time graph of a particle in one-dimensional motion is shown in the figure. Which of the following formulae is correct for describing the motion of the particle over the time interval t1 to t2?
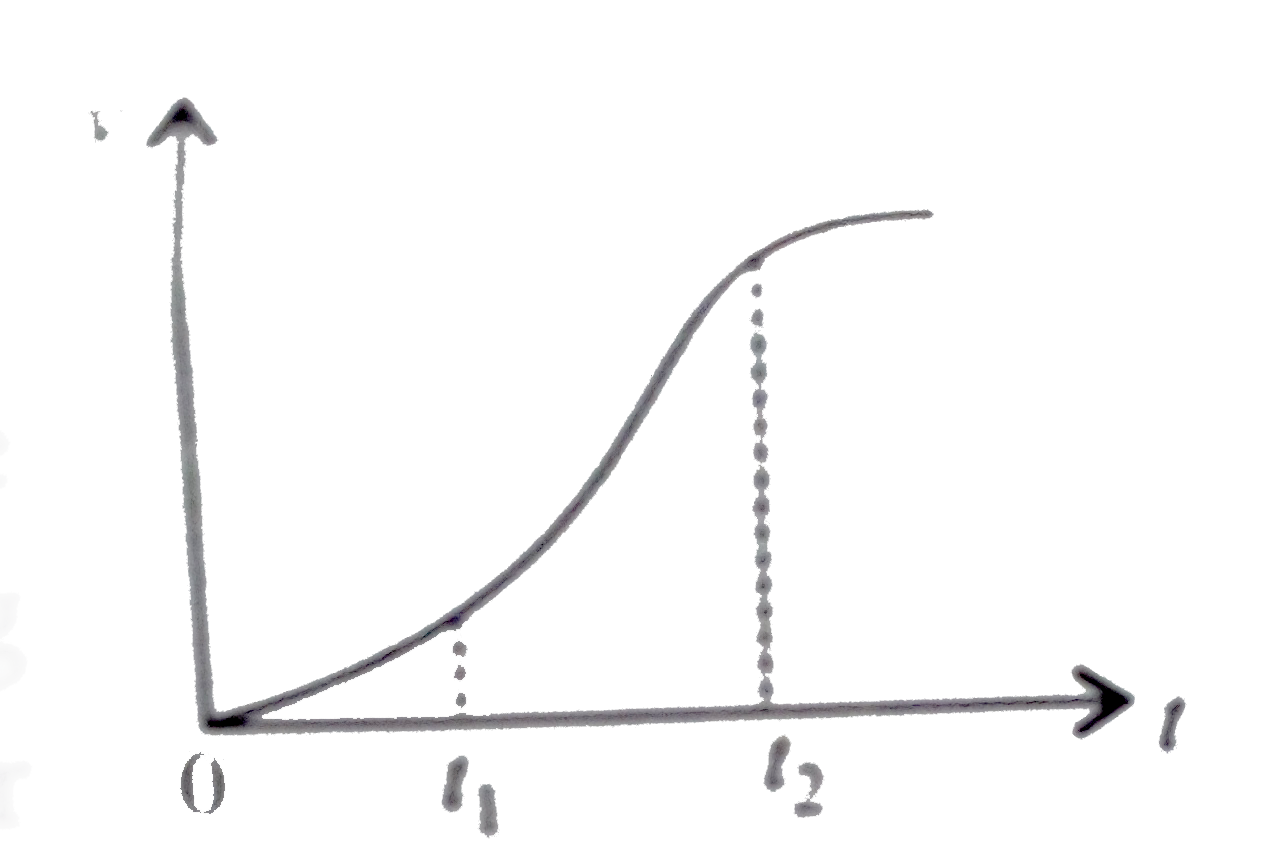
View SolutionThe velocity-time graph of a particle in one-dimensional motion is shown in the figure. Which of the following formulae is correct for describing the motion of the particle over the time interval t1 to t2?

View SolutionThe diagram shows the velocity-time graph for a particle moving in a straight line. The sum of the two shaded areas represents :
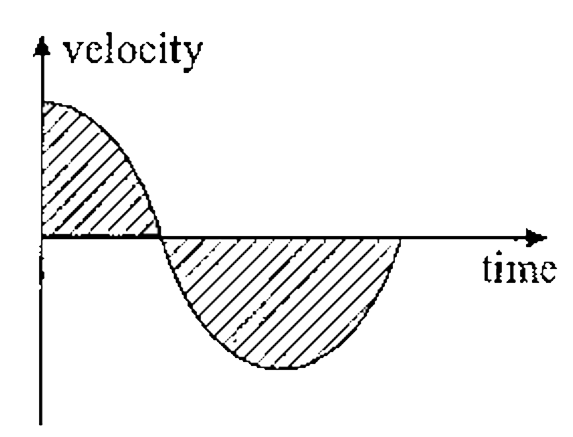
View Solution
