Figure shows four p-V diagrams . Which of these curves represent isothermal and adiabatic process?

A
D and C
B
A and C
C
A and B
D
B and D
Text Solution
The correct Answer is:A
In curves A and B , pressure and volume both increases . Therfore , temperature must rise and heat nust be supplied /work is done. Therefore,A and B cannot be required curves. Out of C and D , slope of smaller. Therore , D is isothermal curve and C is adiabatic curve.
|
Topper's Solved these Questions
- KINETIC THEORY OF GASES ANDRADIATIONBOOK - MHTCET PREVIOUS YEAR PAPERS AND PRACTICE PAPERSCHAPTER - KINETIC THEORY OF GASES ANDRADIATIONEXERCISE - Exercise 2
50 Videos
- KINETIC THEORY OF GASES ANDRADIATIONBOOK - MHTCET PREVIOUS YEAR PAPERS AND PRACTICE PAPERSCHAPTER - KINETIC THEORY OF GASES ANDRADIATIONEXERCISE - MHT CET Corner
40 Videos
- KINETIC THEORY OF GASES ANDRADIATIONBOOK - MHTCET PREVIOUS YEAR PAPERS AND PRACTICE PAPERSCHAPTER - KINETIC THEORY OF GASES ANDRADIATIONEXERCISE - MHT CET Corner
40 Videos
- INTERFERENCE AND DIFFRACTION OF LIGHT BOOK - MHTCET PREVIOUS YEAR PAPERS AND PRACTICE PAPERSCHAPTER - INTERFERENCE AND DIFFRACTION OF LIGHT EXERCISE - MHT CET Corner
24 Videos
- MAGNETIC EFFECT OF ELECTRIC CURRENTBOOK - MHTCET PREVIOUS YEAR PAPERS AND PRACTICE PAPERSCHAPTER - MAGNETIC EFFECT OF ELECTRIC CURRENTEXERCISE - MHT CET CORNER
20 Videos
Similar Questions
Knowledge Check
Figure shows four PV diagrams. Which of these curves represent isothermal and adiabatic processes?
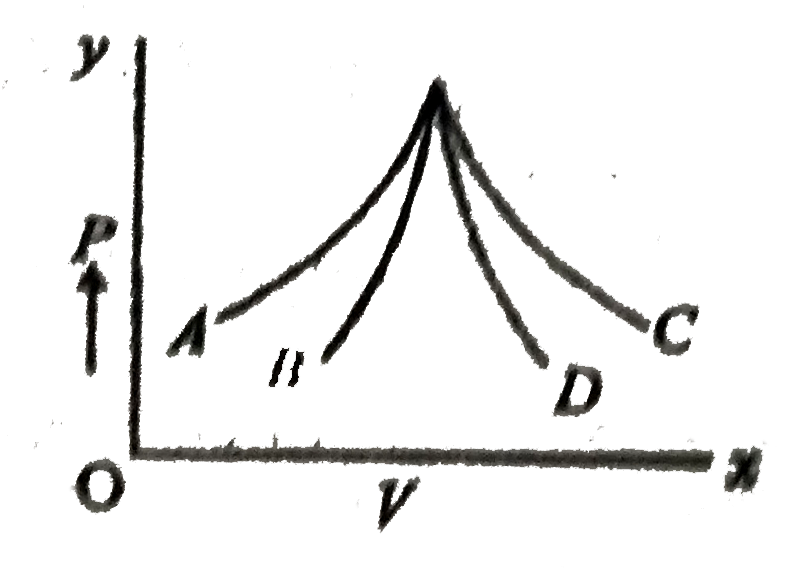 AC and DBA and CCA and BDB and D
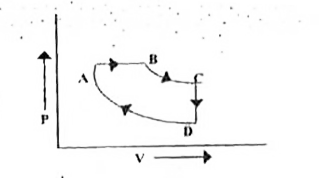
A cyclic process ABCD is shown in the figure P-V diagram. Which of the following curves represent the same process?
 A
A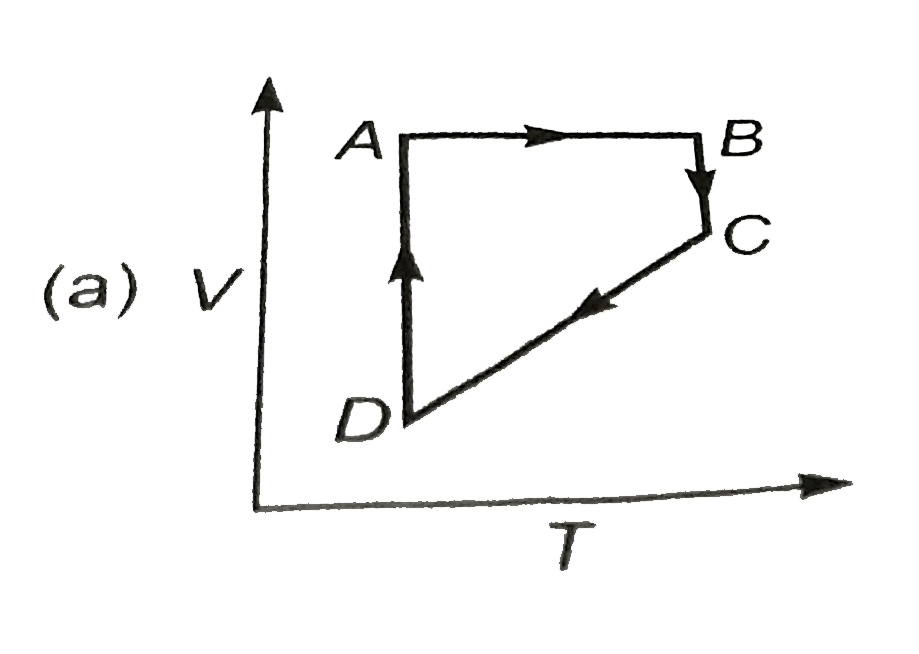 B
B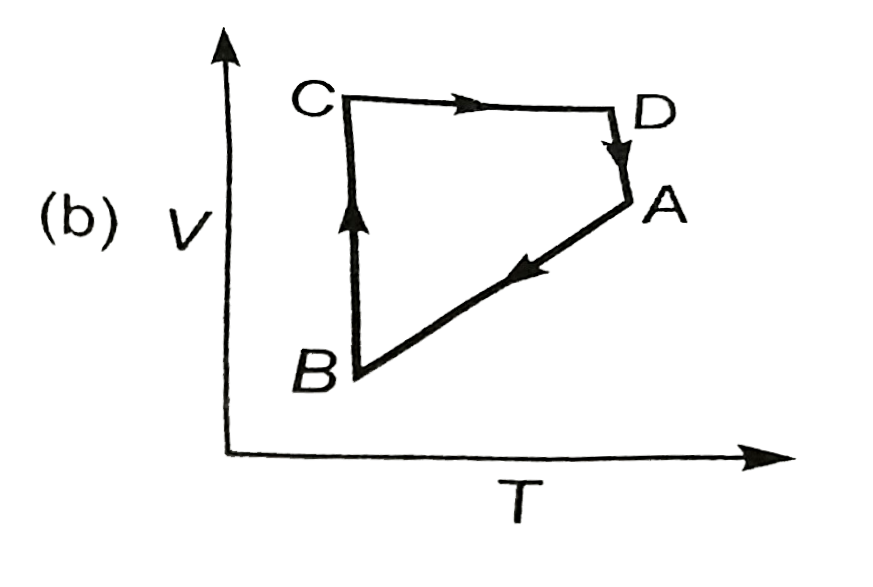 C
C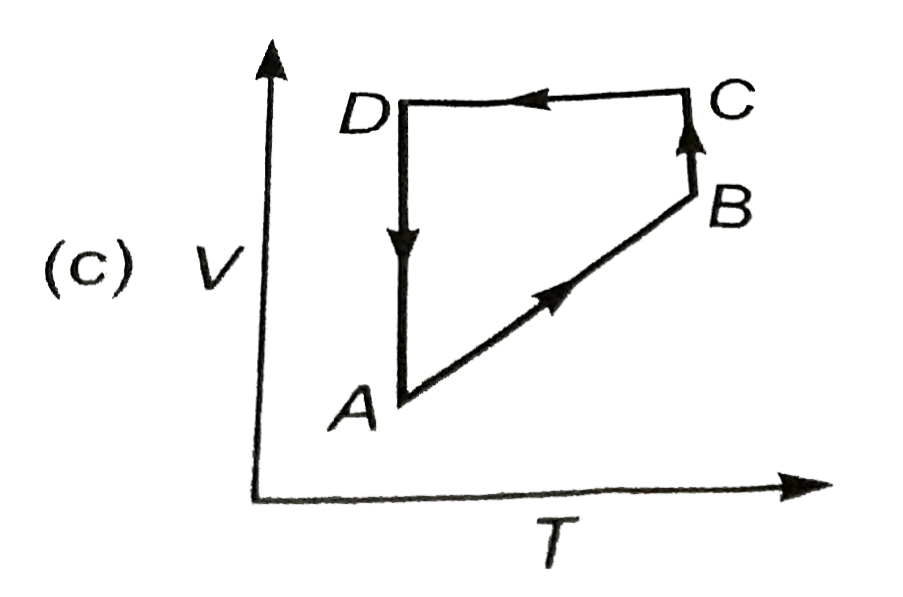 D
D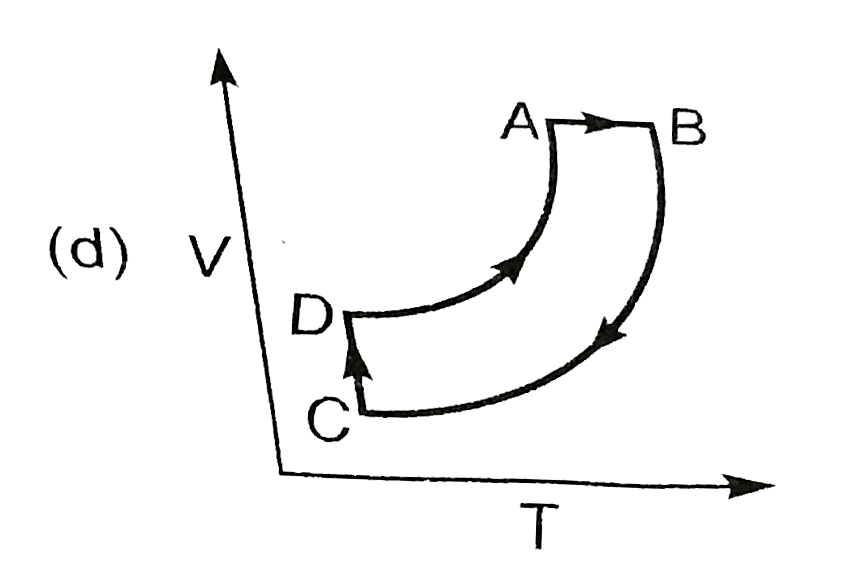
A cyclic process ABCD is shown in the figure P - V diagram. Which of the following curves represent the same process
 A
A B
B C
C D
D
A cyclic process ABCD is shown in the figure P-V diagram. Which of the following curves represent the same process?

View Solution
A cyclic process ABCD is shown in the p-V diagram. Which of the following curves represent the same process?
View Solution
A cyclic process ABCD is shown in the p-V diagram. Which of the following curves represent the same process?
View SolutionWhich of the following P-V curve best represents. As isothermal process?
View SolutionWhich of the following P-V curve best represents. As isothermal process?
View Solution
