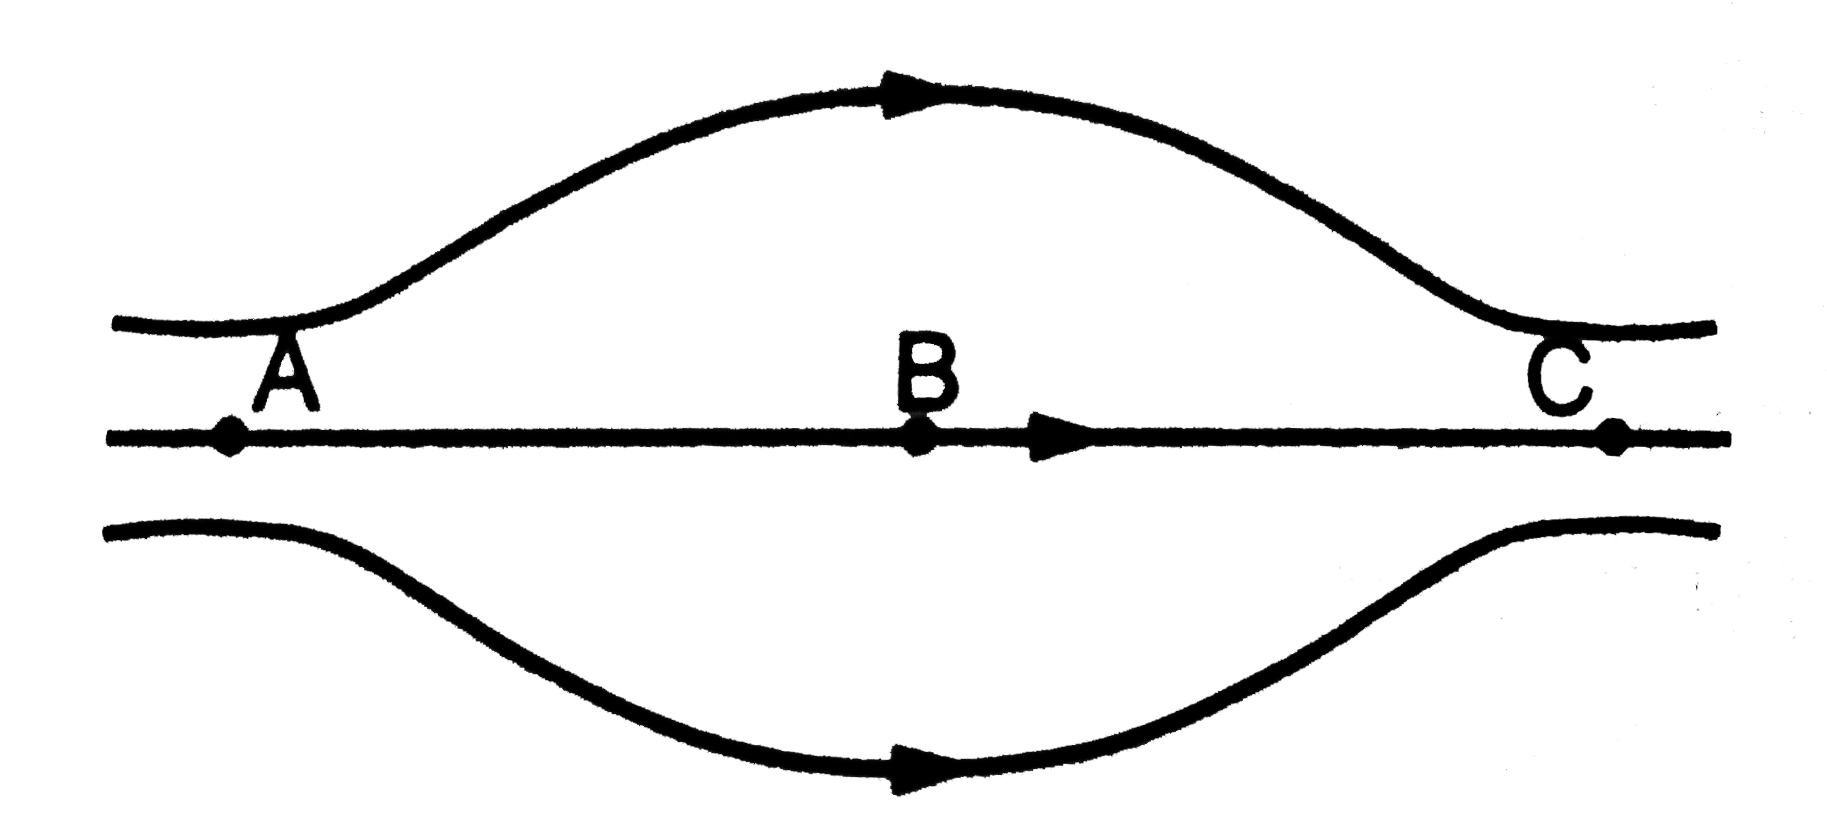
Figure shows the electric field lines around an electric dipole. Which of the arrows best represents the electric field at point P ?


The correct Answer is:A
Step by step video & image solution for Figure shows the electric field lines around an electric dipole. Which of the arrows best represents the electric field at point P ? by Physics experts to help you in doubts & scoring excellent marks in Class 11 exams.
Updated on:21/07/2023Topper's Solved these Questions
- ELECTROSTATICSBOOK - DC PANDEY ENGLISHCHAPTER - ELECTROSTATICSEXERCISE - JEE Advanced
44 Videos
- ELECTROSTATICSBOOK - DC PANDEY ENGLISHCHAPTER - ELECTROSTATICSEXERCISE - Comprehension
36 Videos
- ELASTICITYBOOK - DC PANDEY ENGLISHCHAPTER - ELASTICITYEXERCISE - Medical entrances s gallery
21 Videos
- EXPERIMENTSBOOK - DC PANDEY ENGLISHCHAPTER - EXPERIMENTSEXERCISE - Subjective
15 Videos
Similar Questions
Knowledge Check
The Electric field at a point is
Aalways continuousBcontinuous if there is no charge at that pointCdiscontinuous if there is a charge at that pointDboth (b) and ( c) are correct
Figure shows electric field lines in which an electric dipole p is placed as shown. Which of the following statements is correct ?
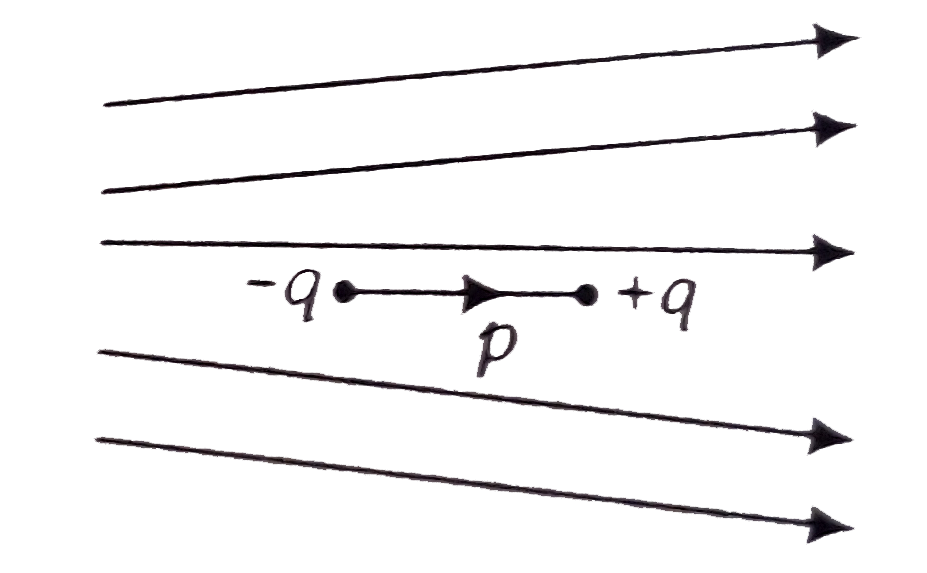
View SolutionFigure shows electric field lines in which an electric dipole p is placed as shown. Which of the following statements is correct ?

View SolutionFigure shows electric field lines in which an electric dipole →P is placed as shown. Which of the following statements is correct?

View SolutionFigure shows the electric field lines around three point charges A,B and C. Which of the following charges are positive?
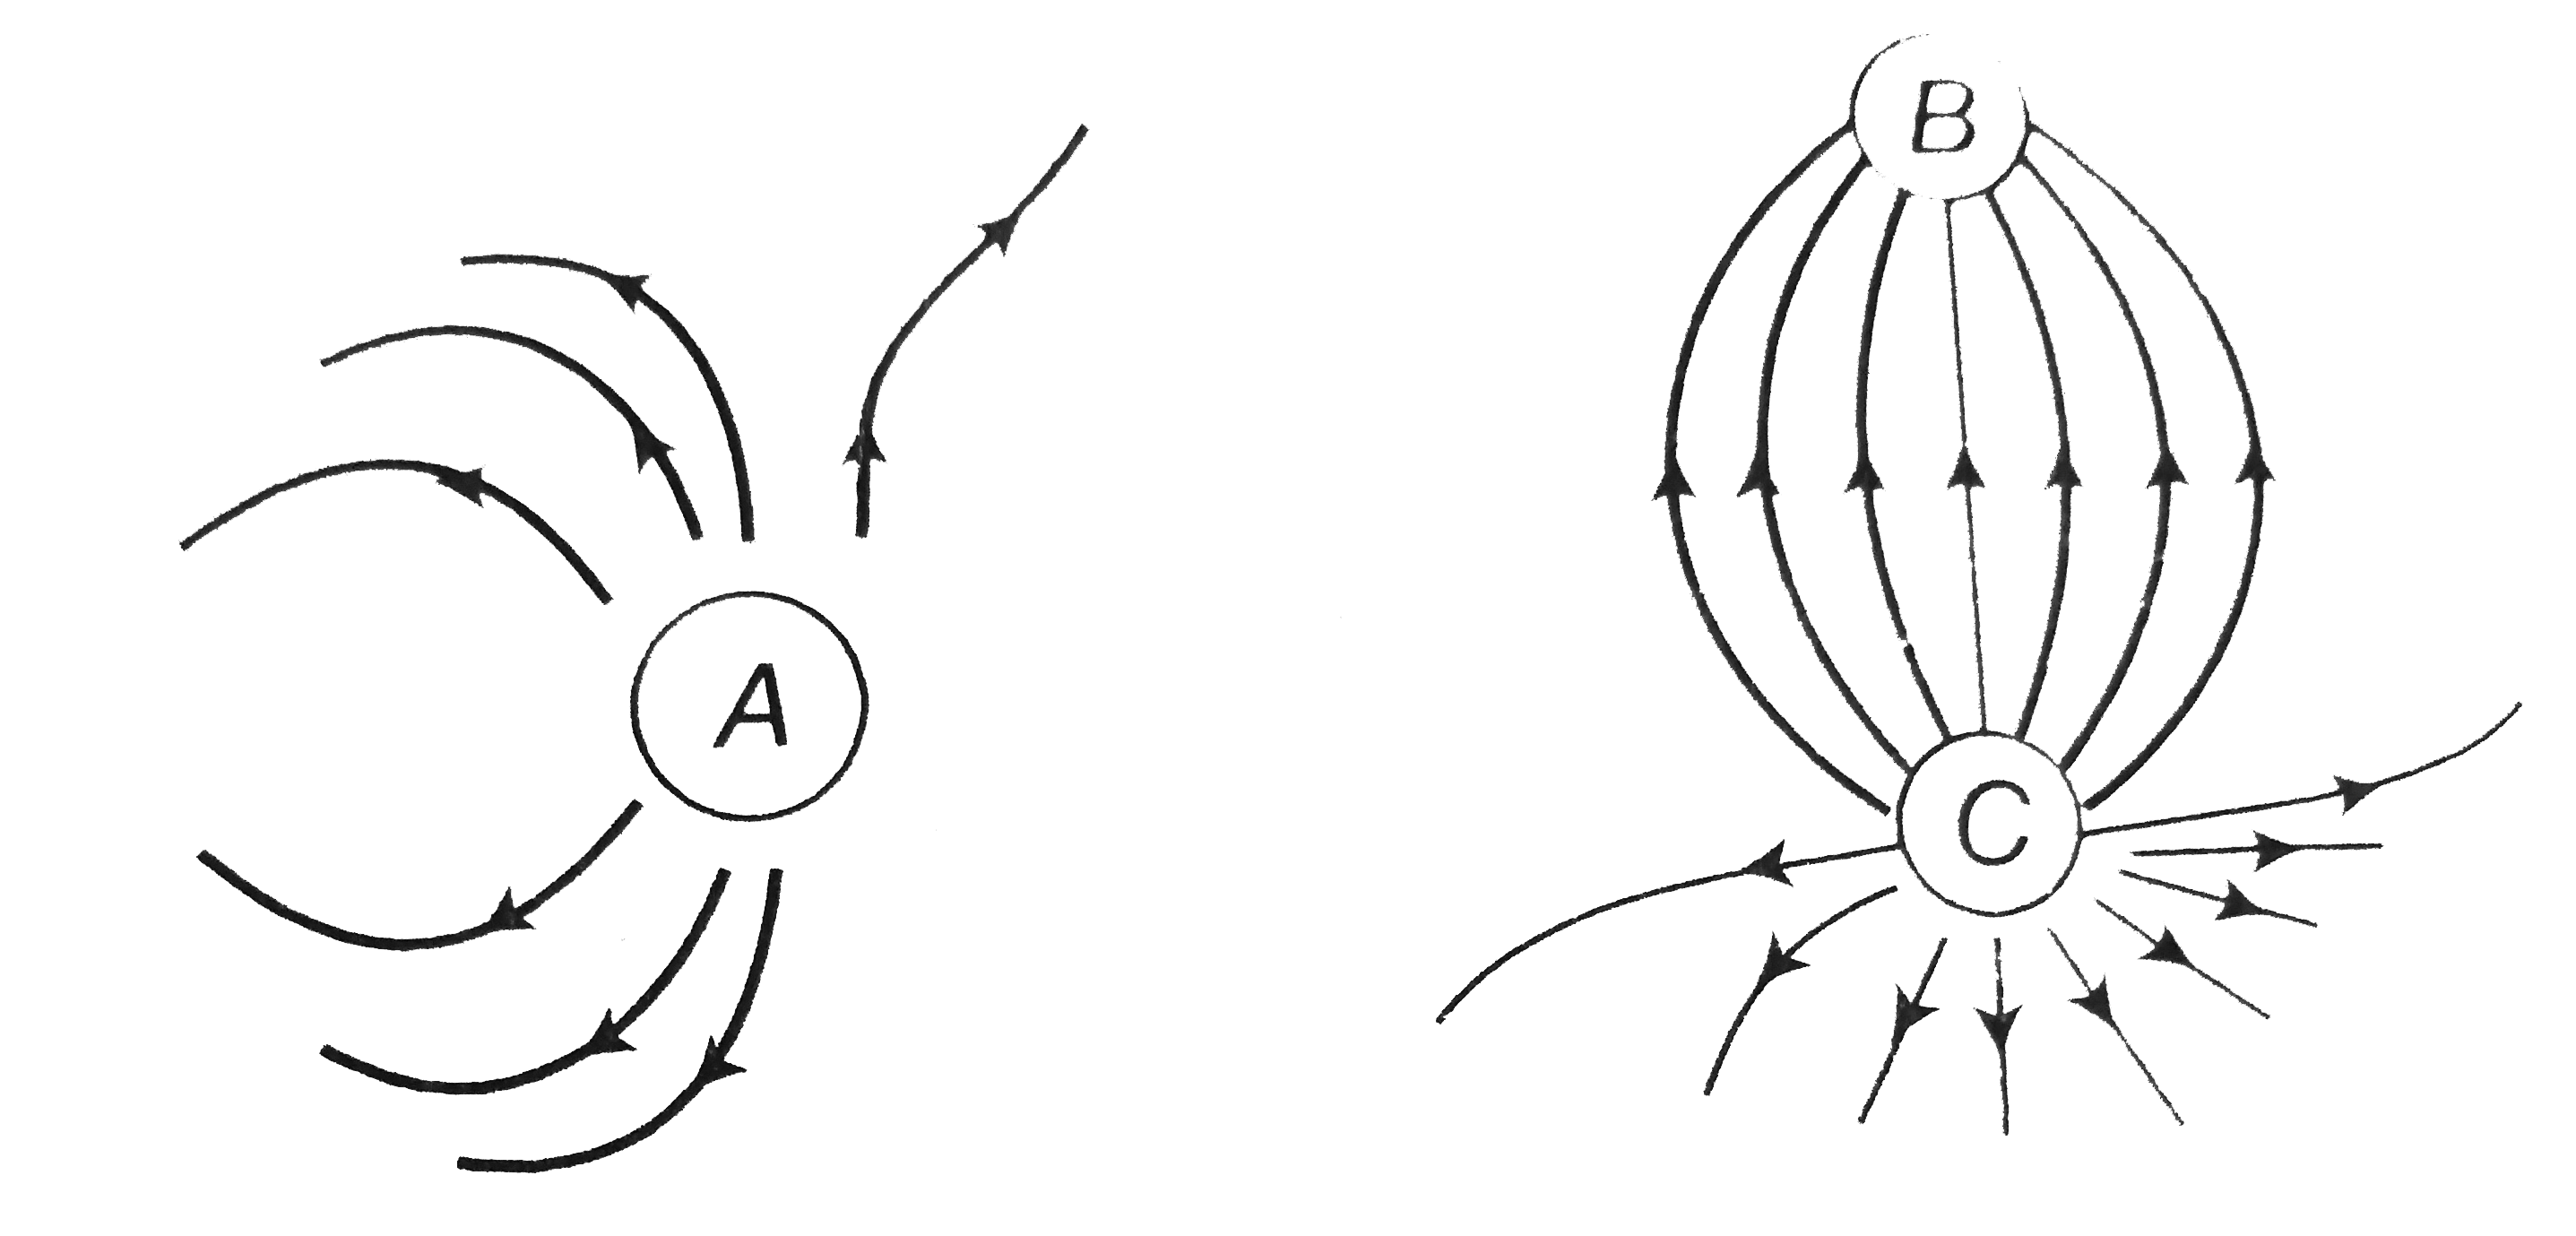
View SolutionThe figure shows some of the electric field lines corresponding to an electric field. The figure suggests
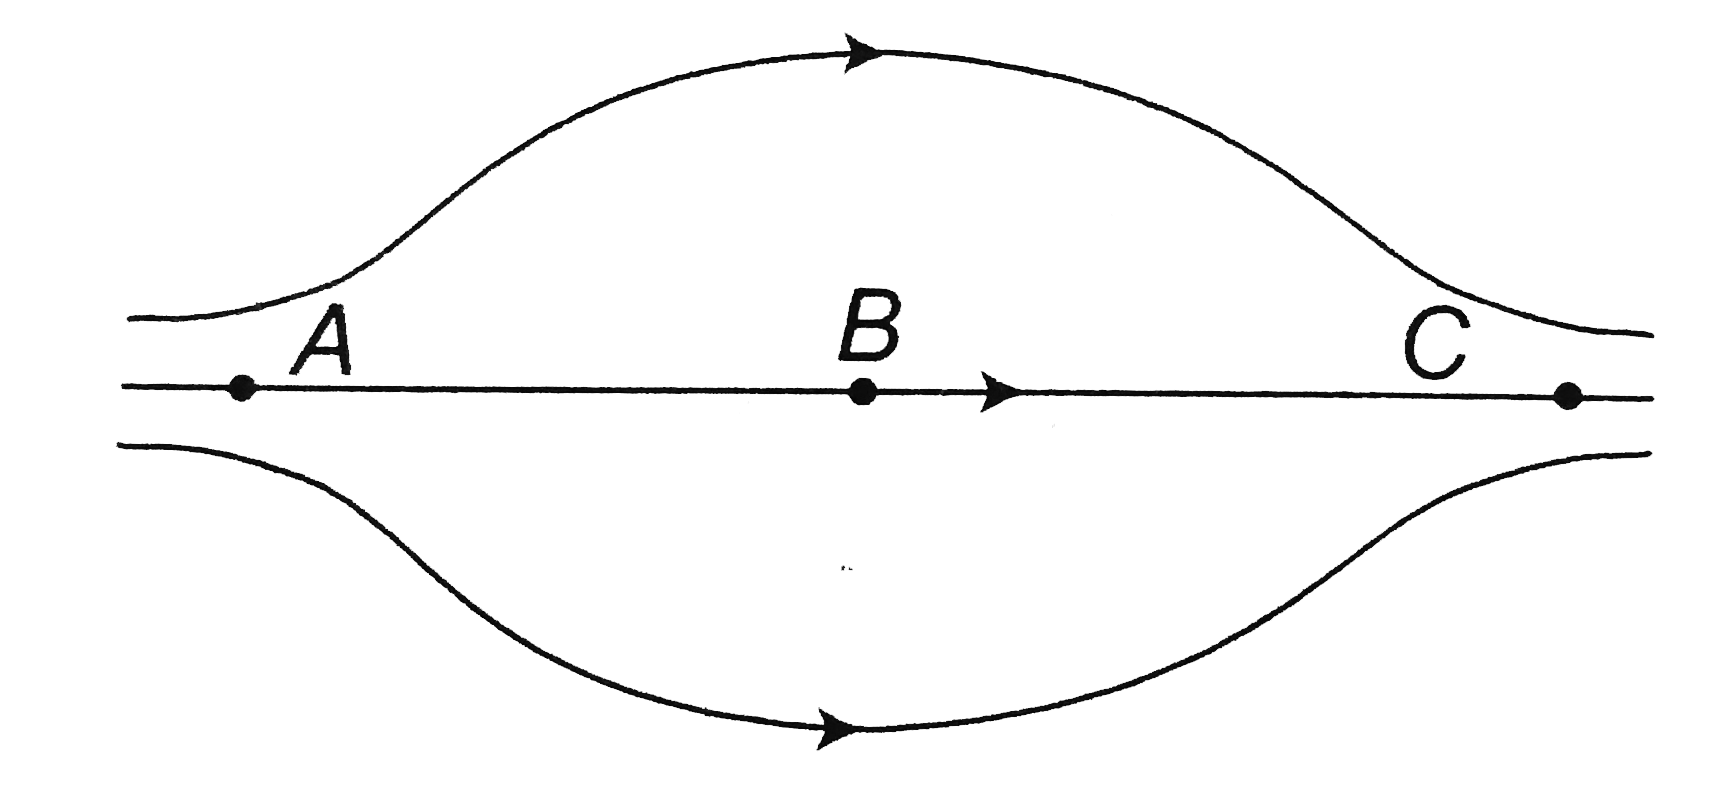
View SolutionFor the following electric field lines, the the electric field is
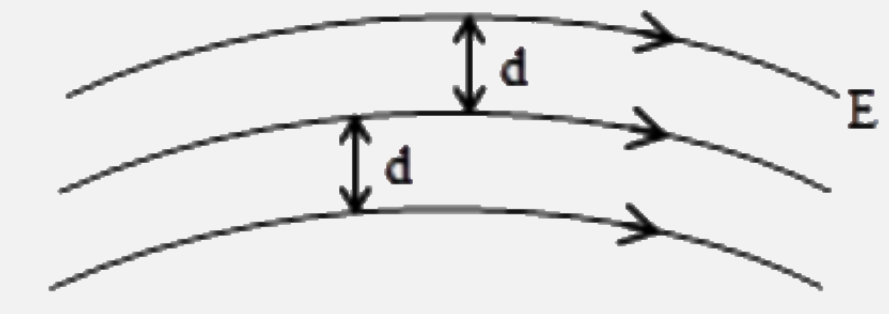
View SolutionThe diagram shows the electric field lines produced by an electrostalic focusing device.
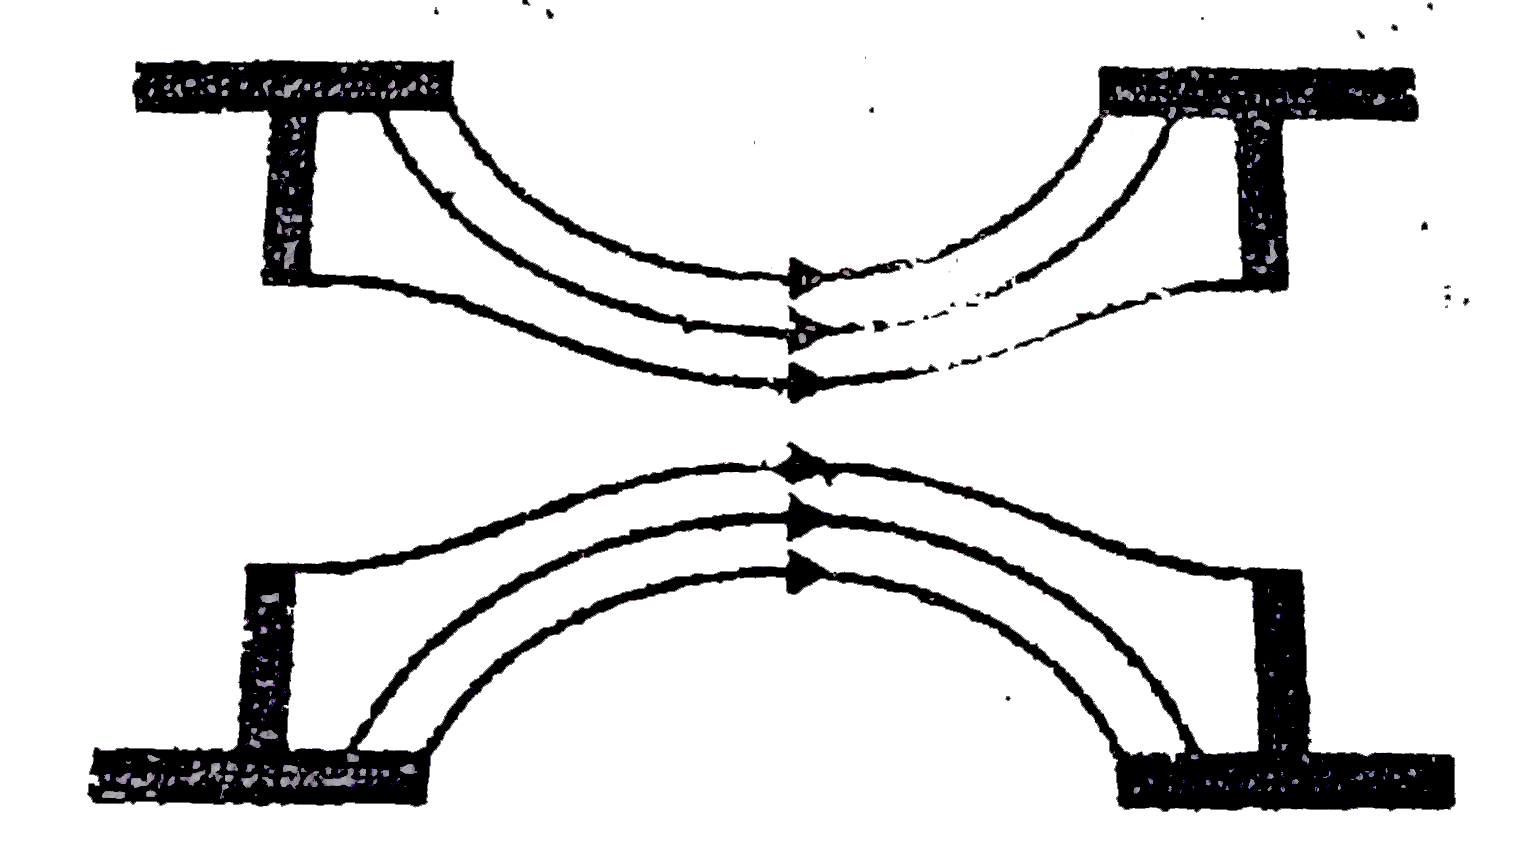
Which one of the following diagrams best shows the corresponding equipotential lines? The electric field are shown as broken lines on each of the diagrams.
View Solution

