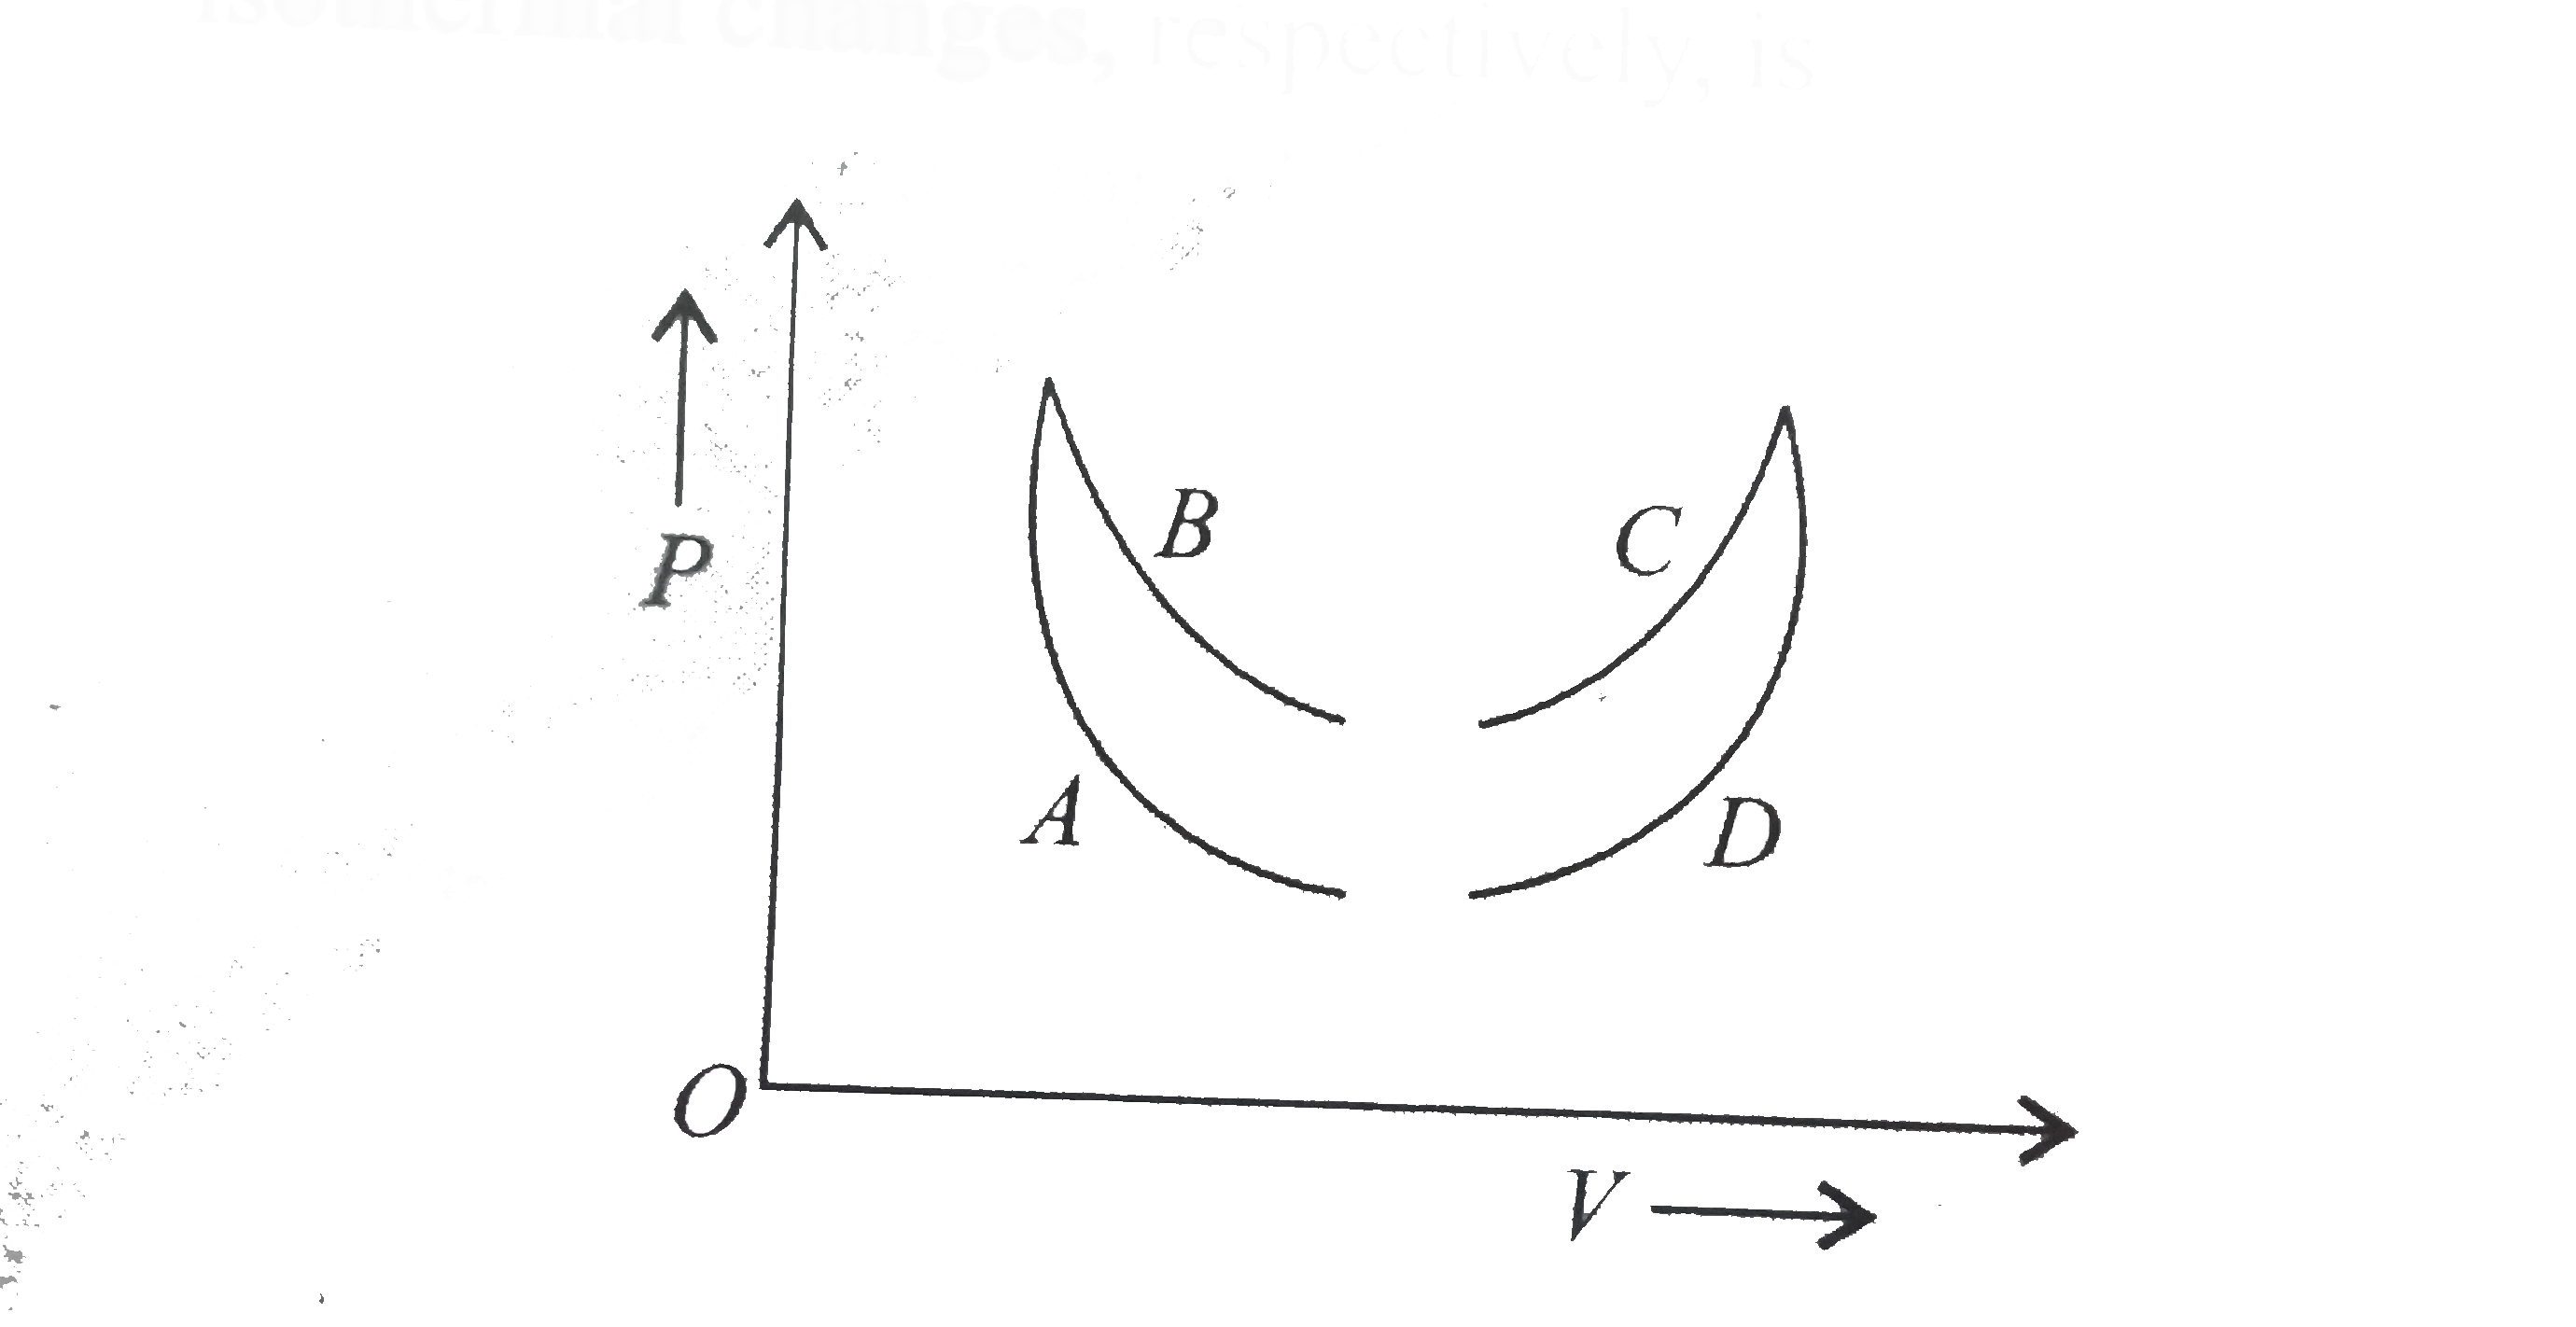
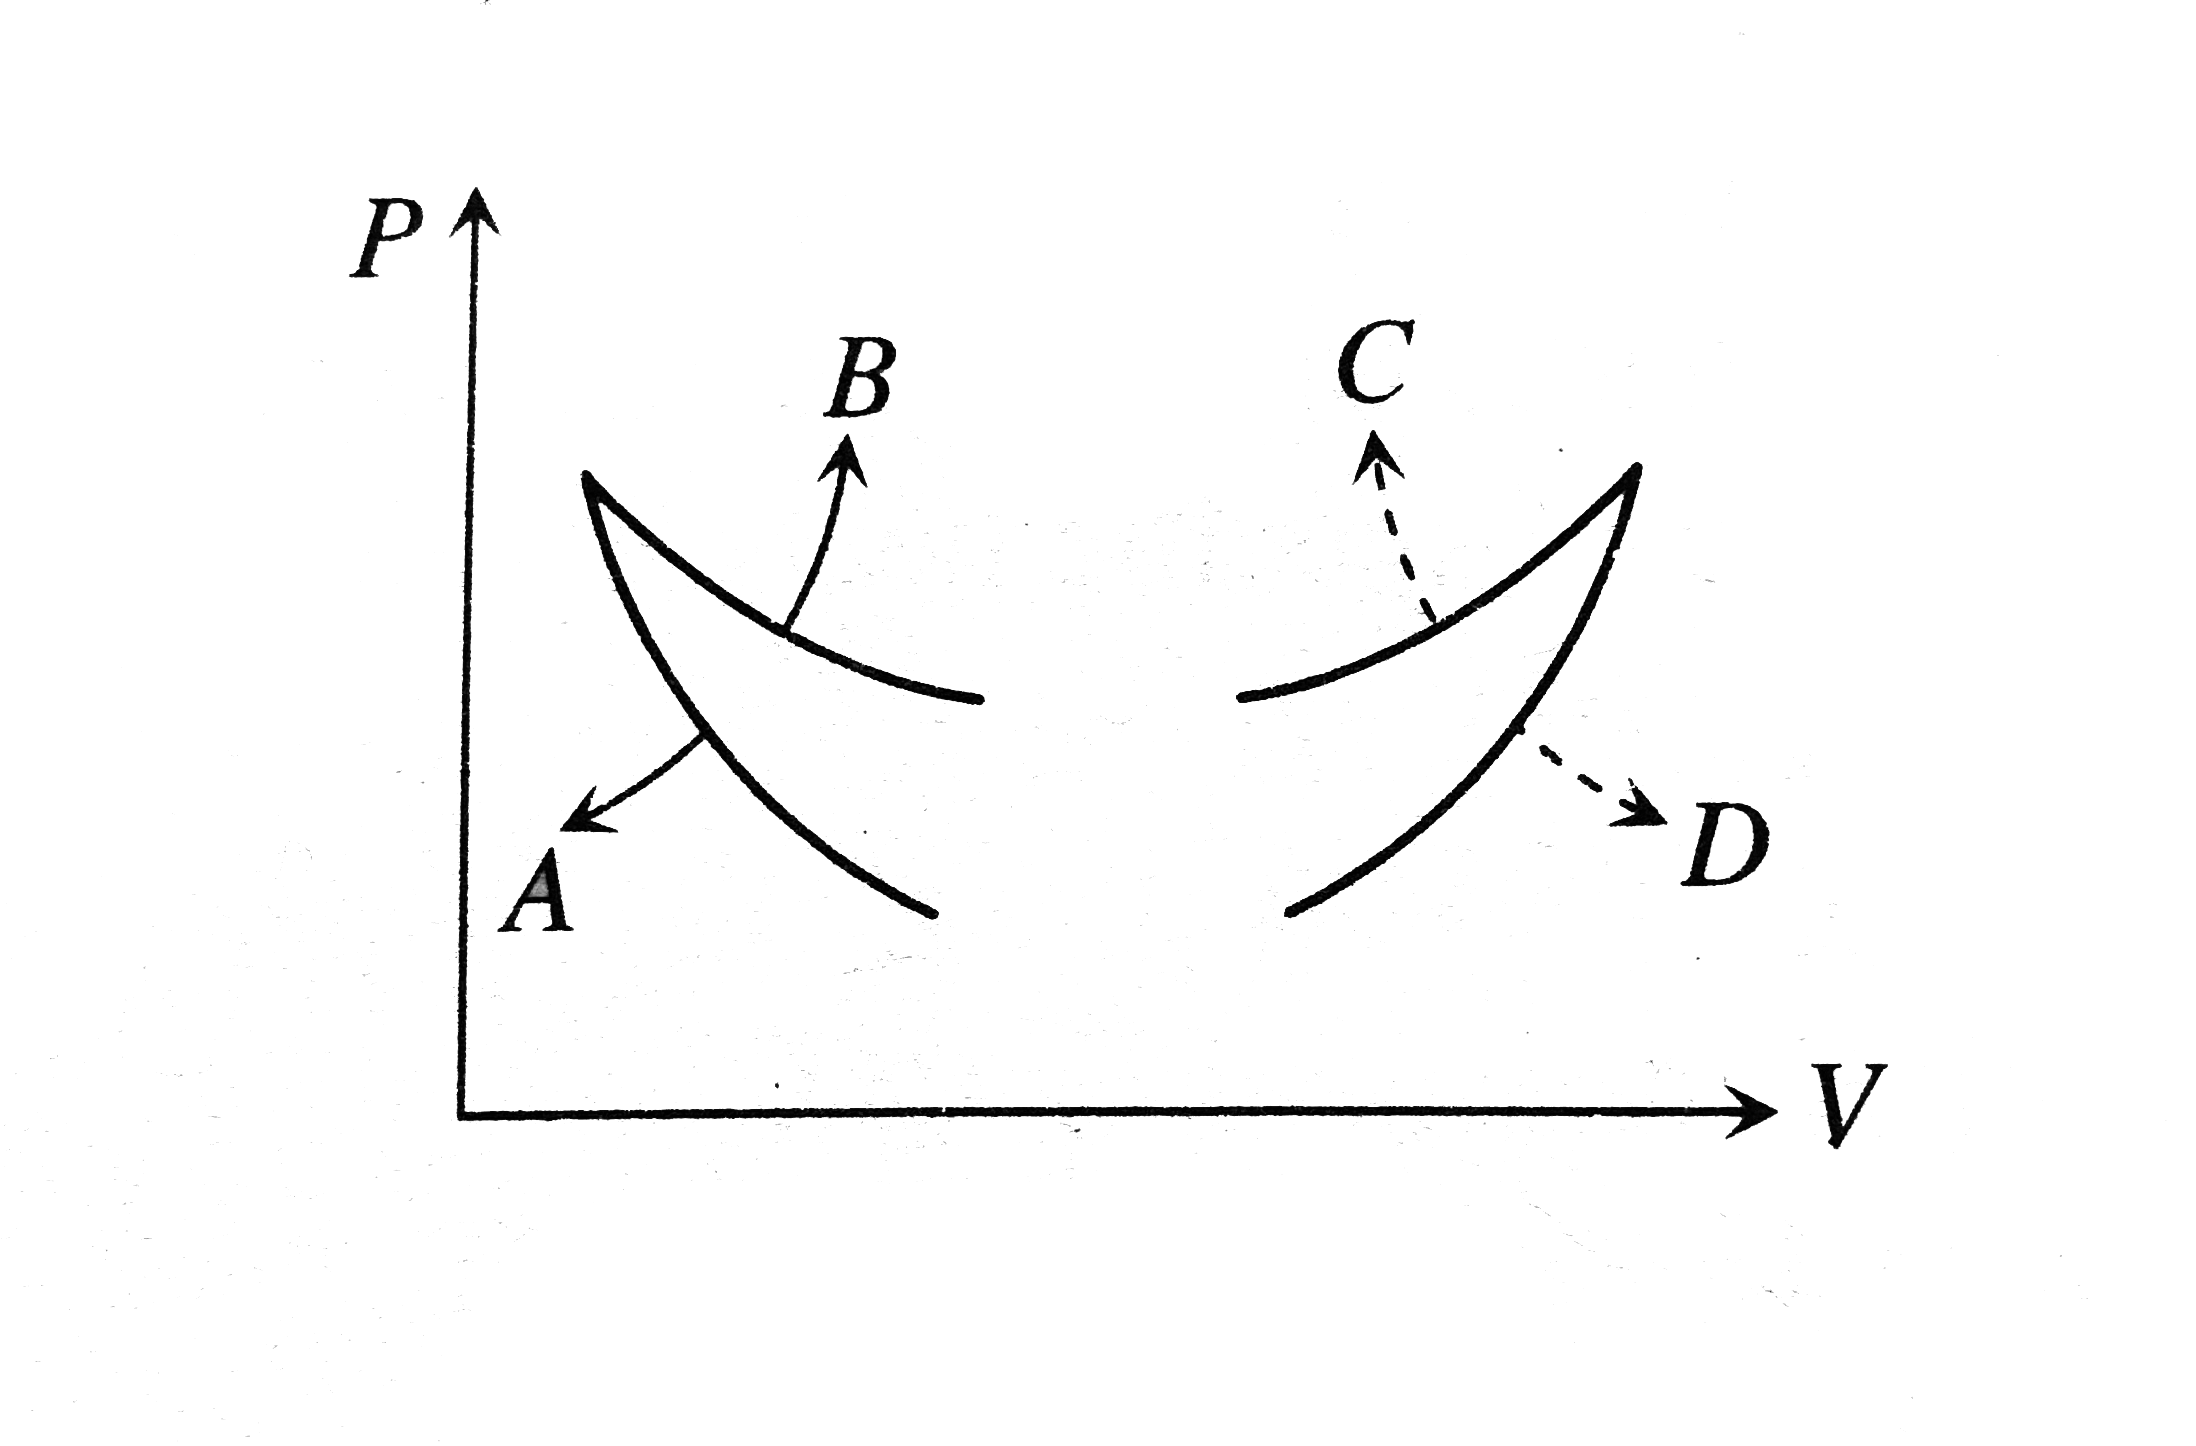
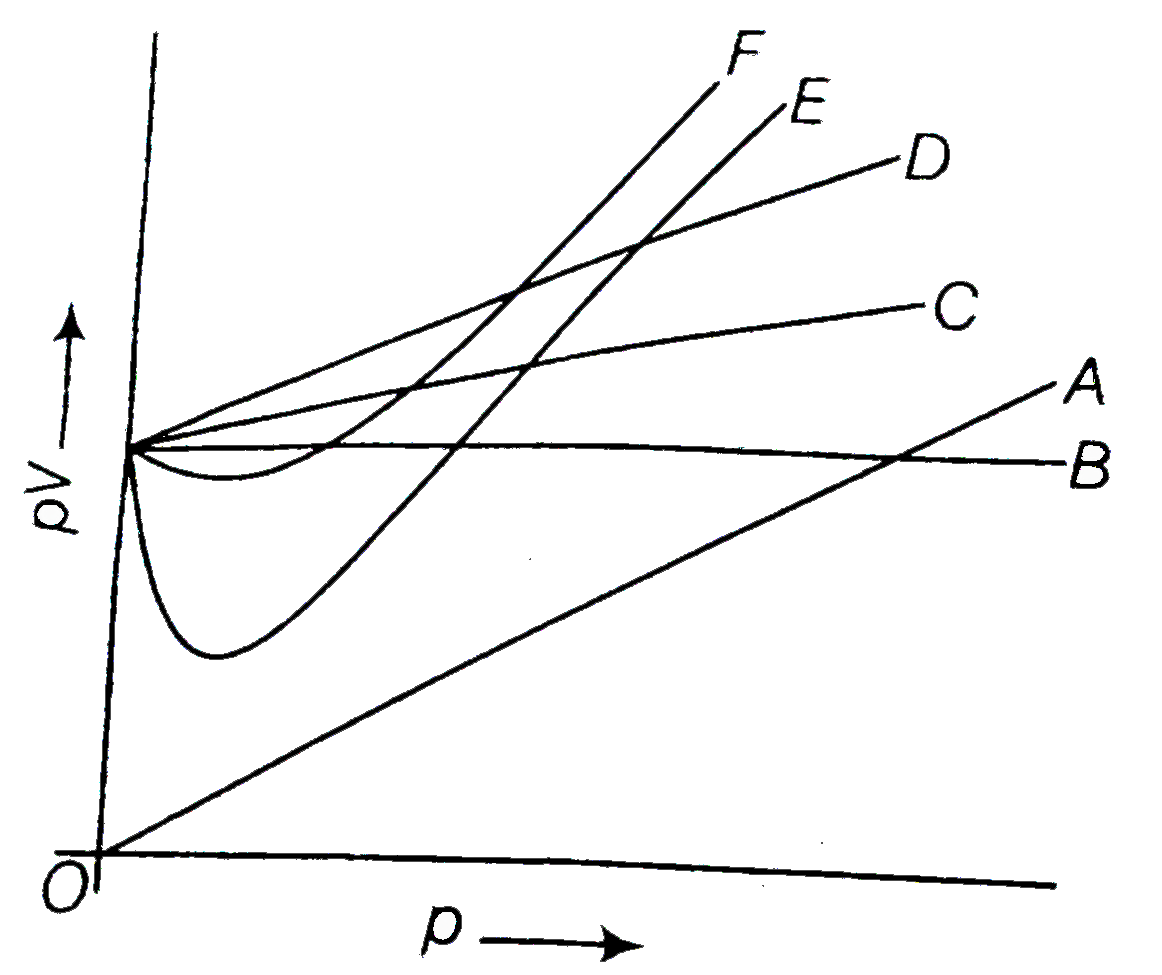
Four curves A,B,C and D are drawn in Fig. for a given amount of gas. The curves which represent adabatic and isothermal changes
A
C and D, respectively
B
D andC, respectively
C
A and B, respectively
D
B and A, respectively
Video Solution
Text Solution
The correct Answer is:C
c. As we know that slopesof isothermal and adiabatic curves are always negative and slopes of adiabatic curve is always greater than of isothermal curve, in the given graph curves A and B represent adiabatic and isothermal changes, resspectively.
|
Topper's Solved these Questions
- KINETIC THEORY OF GASES AND FIRST LAW OF THERMODYNAMICSBOOK - CENGAGE PHYSICSCHAPTER - KINETIC THEORY OF GASES AND FIRST LAW OF THERMODYNAMICSEXERCISE - Multiple Corrects
29 Videos
- KINETIC THEORY OF GASES AND FIRST LAW OF THERMODYNAMICSBOOK - CENGAGE PHYSICSCHAPTER - KINETIC THEORY OF GASES AND FIRST LAW OF THERMODYNAMICSEXERCISE - Assertion-Reasoning
6 Videos
- KINETIC THEORY OF GASES AND FIRST LAW OF THERMODYNAMICSBOOK - CENGAGE PHYSICSCHAPTER - KINETIC THEORY OF GASES AND FIRST LAW OF THERMODYNAMICSEXERCISE - Subjective
22 Videos
- KINETIC THEORY OF GASESBOOK - CENGAGE PHYSICSCHAPTER - KINETIC THEORY OF GASESEXERCISE - Compression
2 Videos
- LINEAR AND ANGULAR SIMPLE HARMONIC MOTIONBOOK - CENGAGE PHYSICSCHAPTER - LINEAR AND ANGULAR SIMPLE HARMONIC MOTIONEXERCISE - Multiple Correct Answer Type
9 Videos
Similar Questions
Knowledge Check
Four curves A,B,C and D are drawn in Fig. for a given amount of gas. The curves which represent adiabatic and isothermal changes
 AC and D respectivelyBD and C respectivelyCA and B respectivelyDB and A respectively
Given curve represents
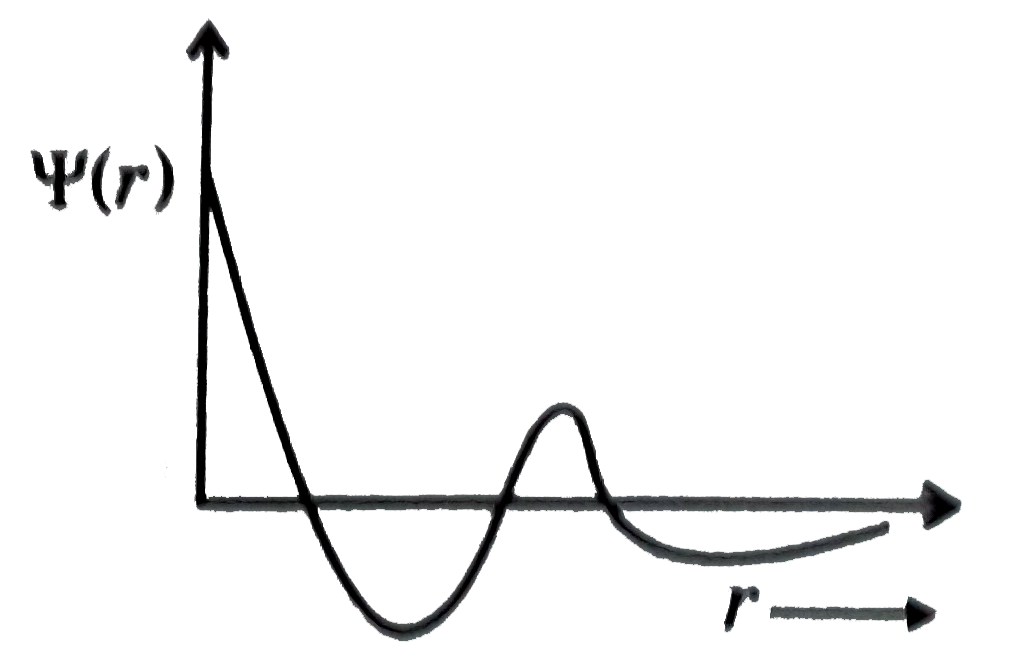 A3s orbitalB4s orbitalC2s orbitalD2s orbital
Which of the following P-V curve best represents. As isothermal process?
A B
B C
C D
D
When heat is given to a gas in an isothermal change, the result will be
View SolutionWhich curve in figure represents the curve of ideal gas ?
View SolutionWhich curve in figure represents the curve of ideal gas?

View SolutionWhich of the following P-V curve best represents. As isothermal process?
View SolutionWhich of the following curves represents a third order reaction ?
View Solution

