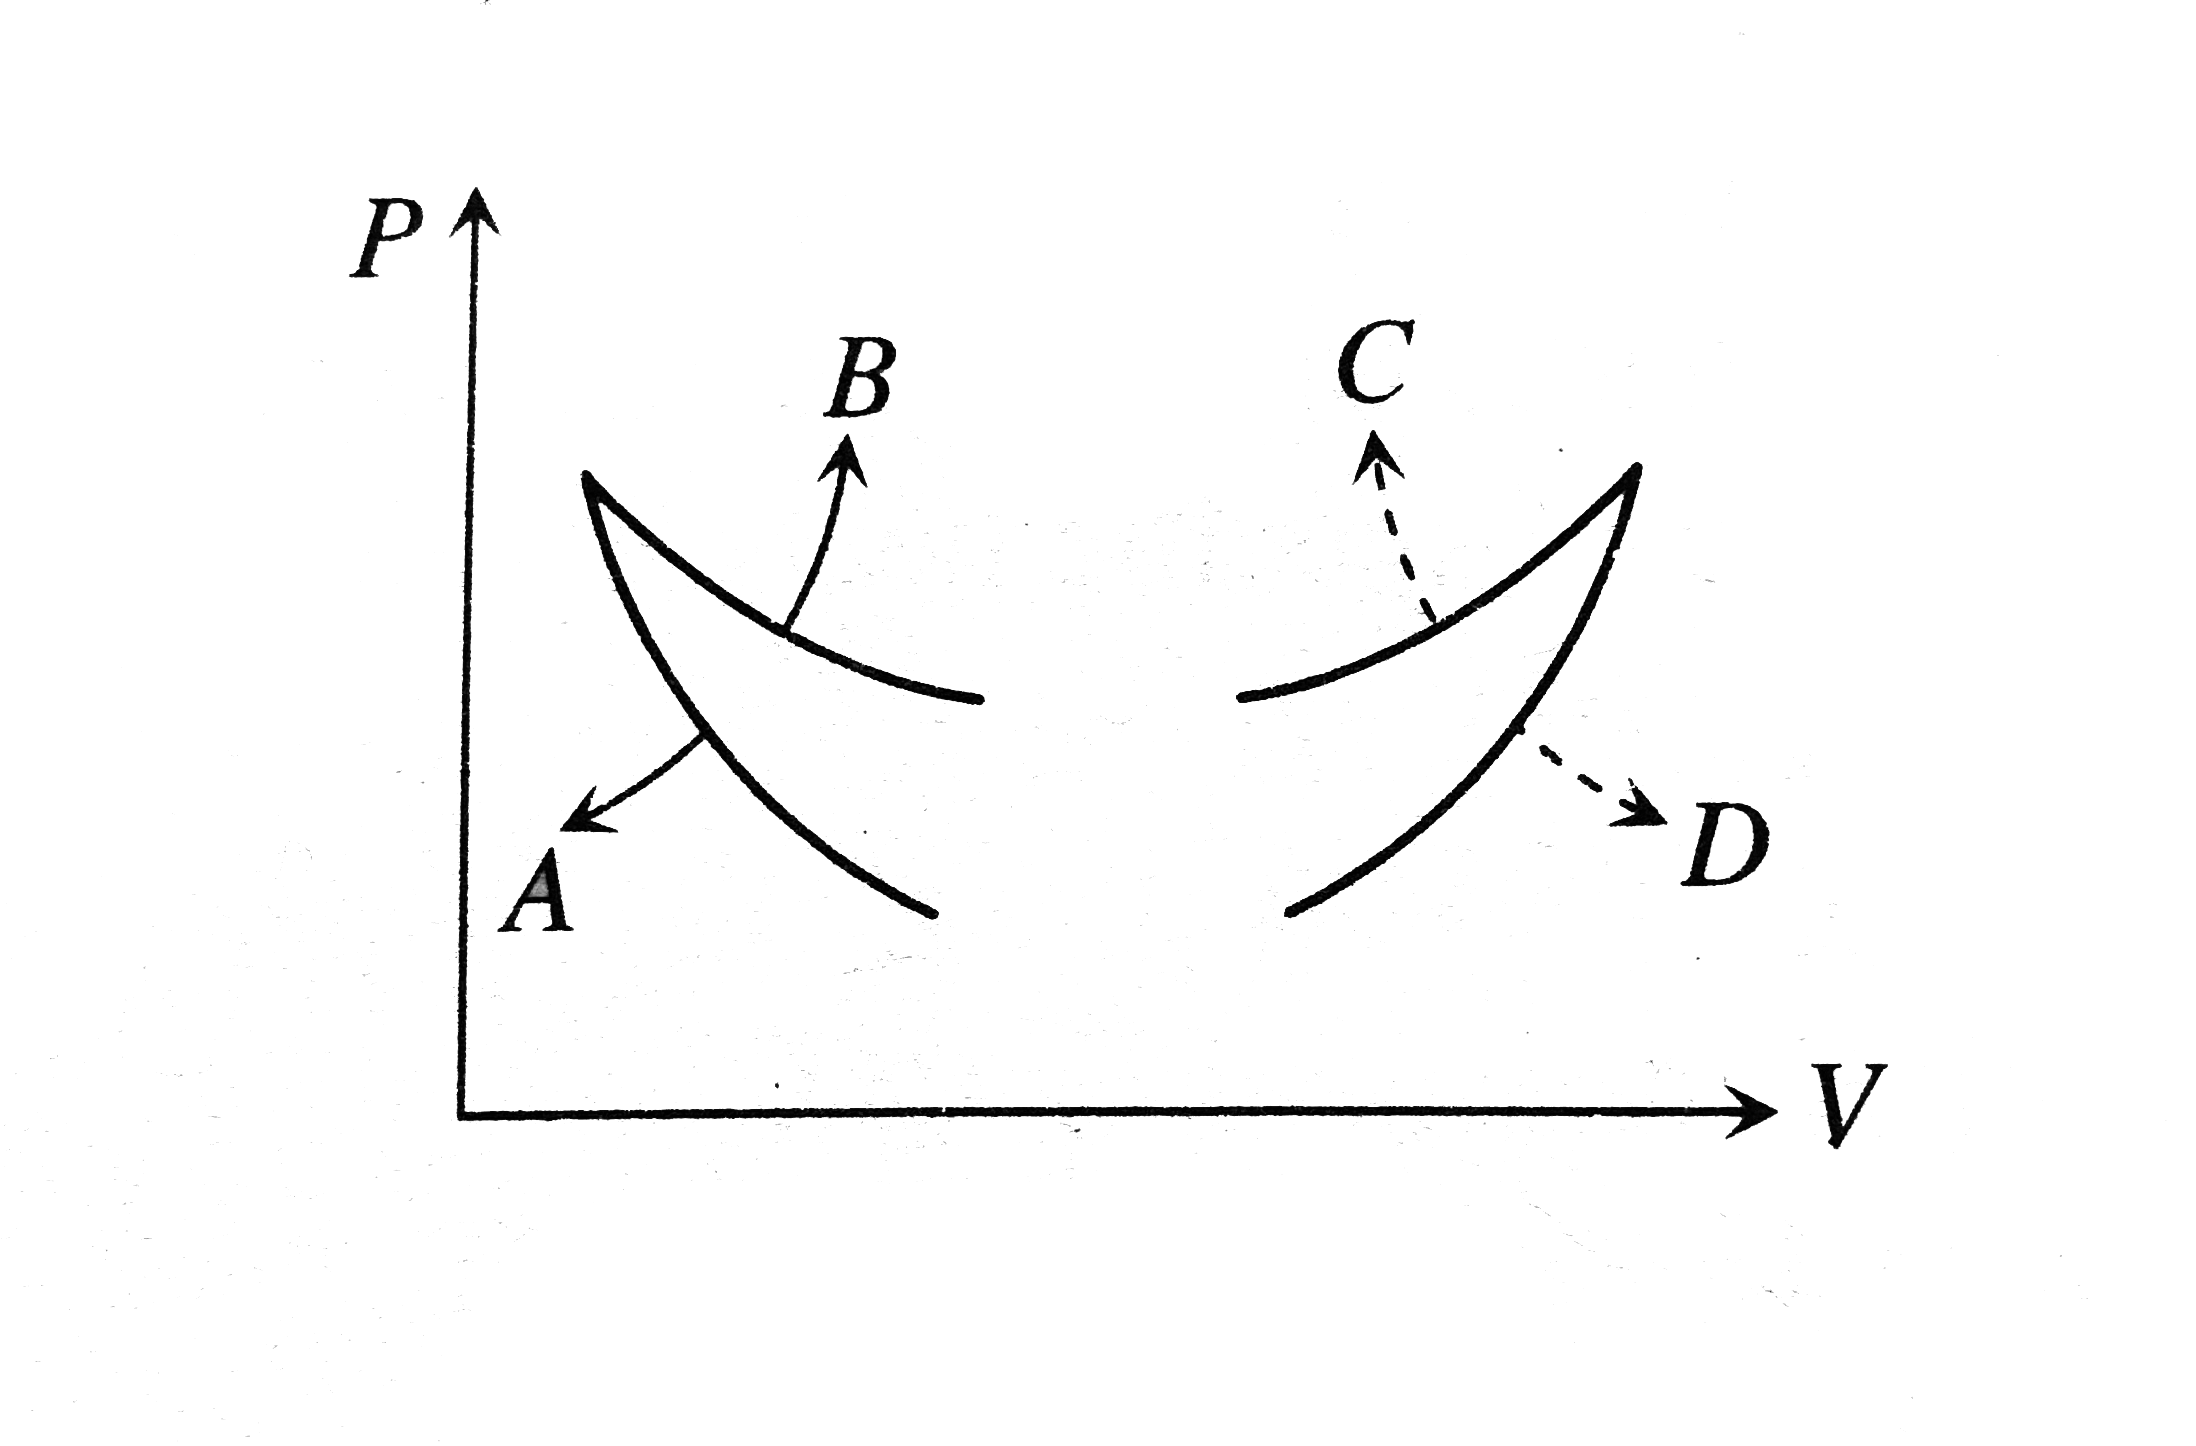
Four curves and are drawn in Fig. for a given amount of gas. The curves which represent adiabatic and isothermal changes

A
C and D respectively
B
D and C respectively
C
A and B respectively
D
B and A respectively
Video Solution
Text Solution
The correct Answer is:C
Isothermal
Adiabatic
Also, slope of adiabatic is more as compare to isothermal.
|
Updated on:21/07/2023
Topper's Solved these Questions
- BOOK - PHYSICS WALLAHCHAPTER - THERMODYNAMICSEXERCISE - NEET Past 5 Years Questions14videos
THERMODYNAMICS
- BOOK - PHYSICS WALLAHCHAPTER - THERMODYNAMICSEXERCISE - NEET Past 5 Years Questions14videos
THERMODYNAMICS
- BOOK - PHYSICS WALLAHCHAPTER - THERMAL PROPERTIES OF MATTER EXERCISE - NEET Past 5 Years Questions12videos
THERMAL PROPERTIES OF MATTER
- BOOK - PHYSICS WALLAHCHAPTER - UNITS AND MEASUREMENTS EXERCISE - NEET PAST 5 YEARS QUESTIONS10videos
UNITS AND MEASUREMENTS
Similar Questions
Knowledge Check
- Question 1 - Select One
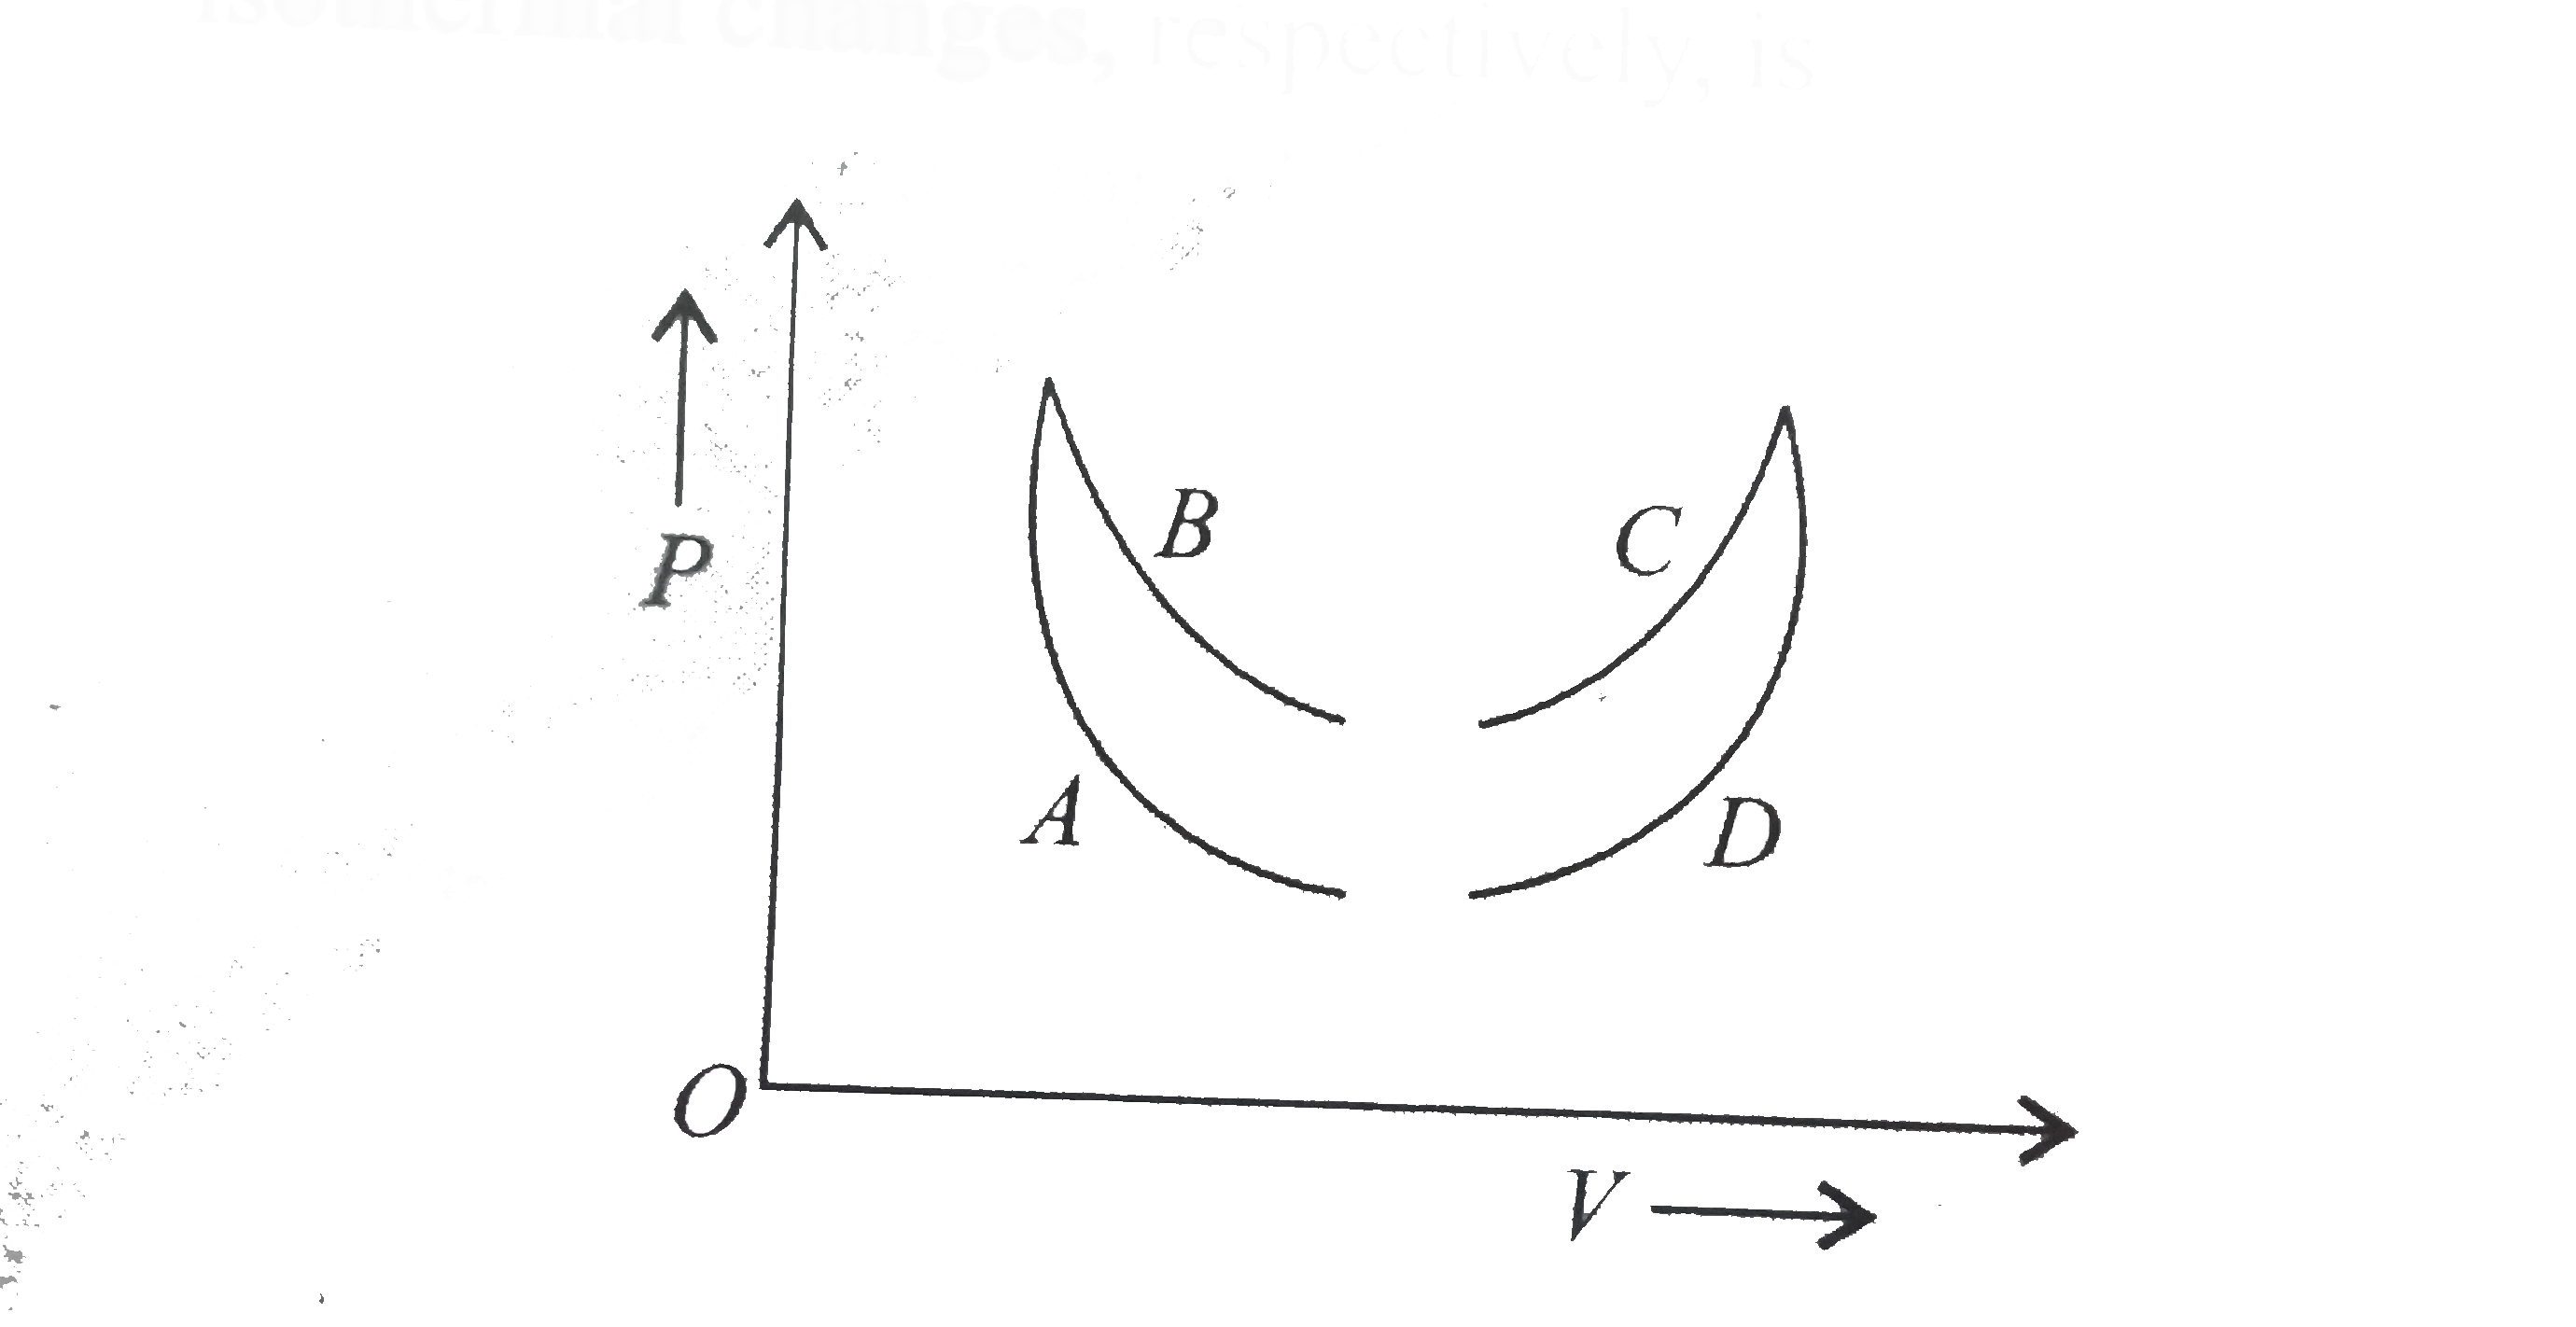
Four curves A,B,C and D are drawn in Fig. for a given amount of gas. The curves which represent adabatic and isothermal changes
 AC and D, respectivelyBD andC, respectivelyCA and B, respectivelyDB and A, respectively
 - Question 2 - Select One
Four curves A,B,C and D are drawn in Fig. for a given amount of gas. The curves which represent adiabatic and isothermal changes
 AC and D respectivelyBD and C respectivelyCA and B respectivelyDB and A respectively
 - Question 3 - Select One
The ratio of slopes of adiabatic and isothermal curves is
AγB1γCγ2Dγ3
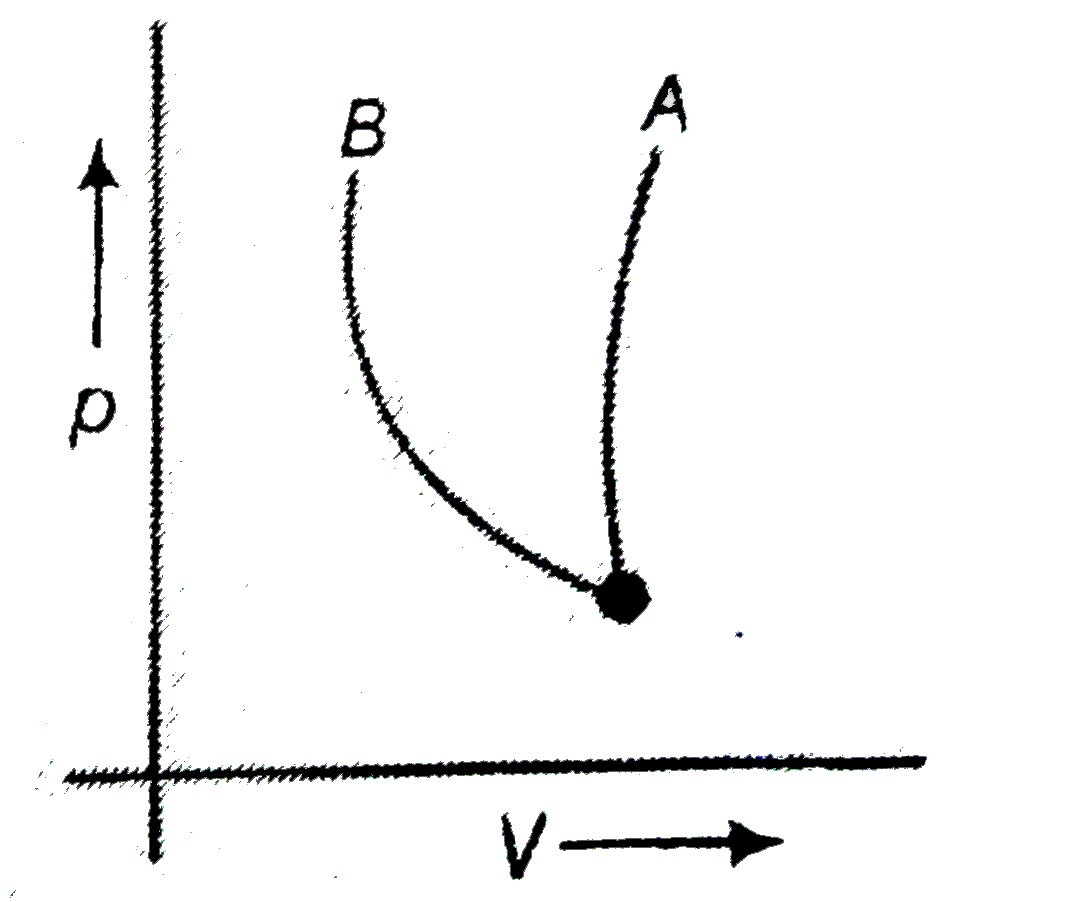
In the given graph, adiabatic and isothermal curves are shown. Then,
 View Solution
Which of the following P-V curve best represents. As isothermal process?
View SolutionWhich curve in figure represents the curve of ideal gas?
 View Solution
Which of the following P-V curve best represents. As isothermal process?
View SolutionWhen heat is given to a gas in an isothermal change, the result will be
View Solution


