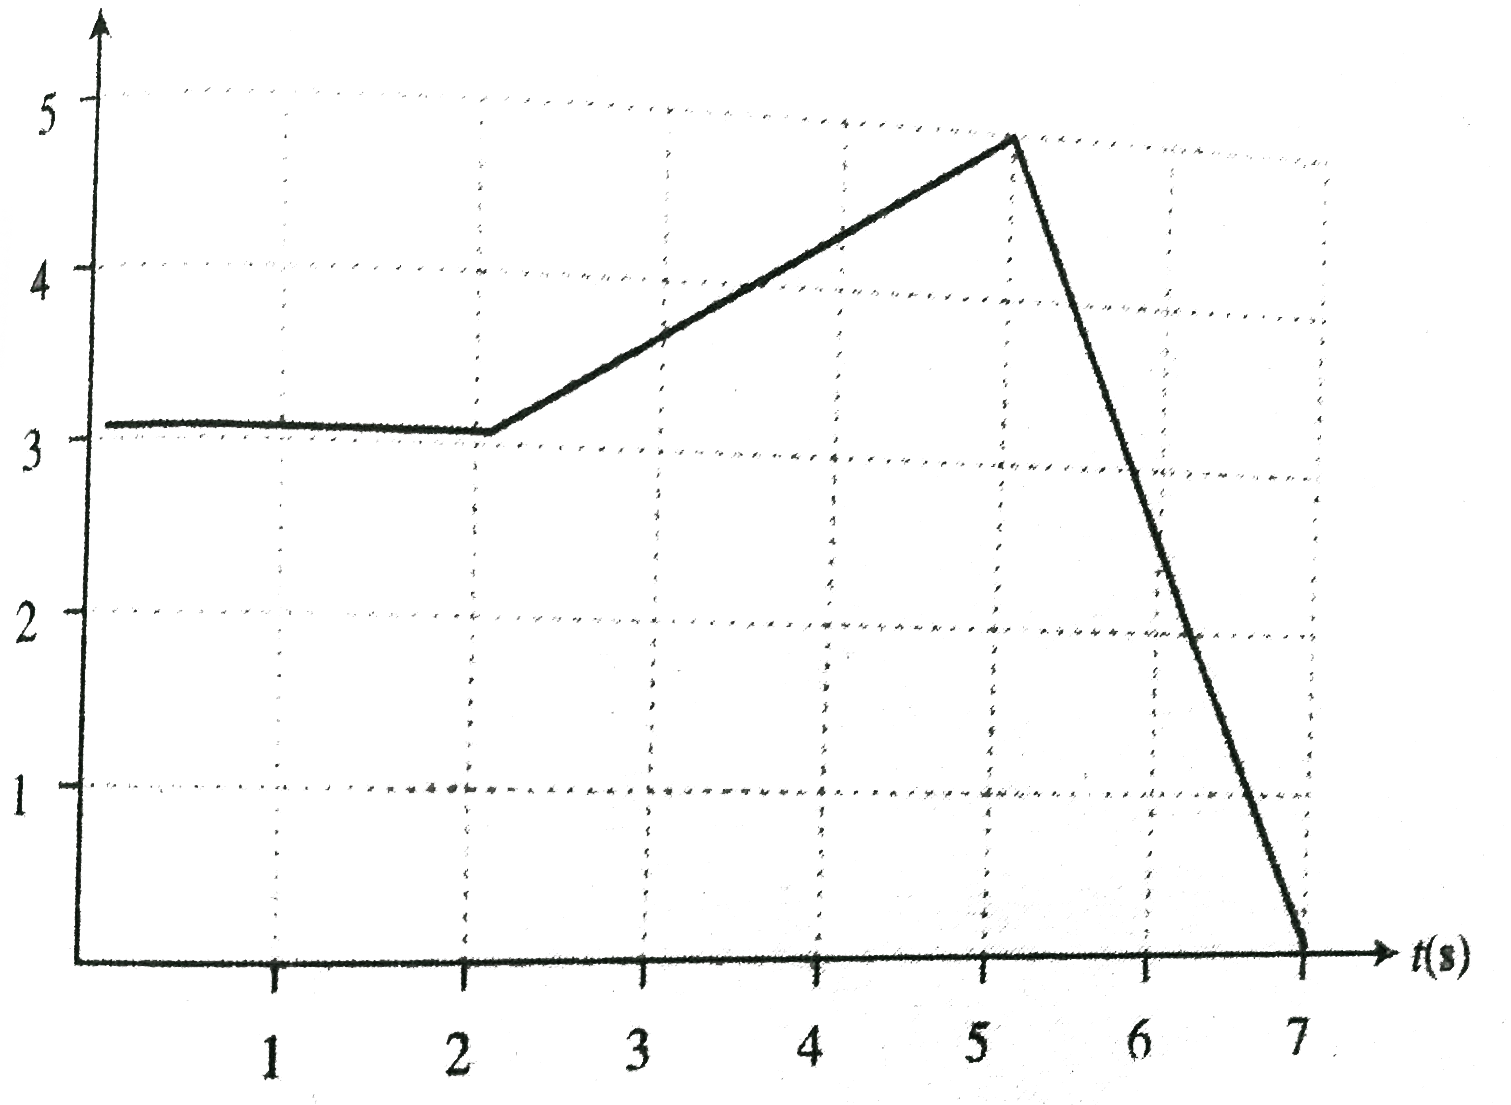
Given below shows the desplacemen-time graph for a particle moving along a straight line path.
 .
.
State true or false.
a. Time during which the particle was at reat is 0 to 2s
b. Time maximum velocity of the particle is −2.5ms−1 .
a. True, from graph, we see that for time t=0 to t=2s,
displacement of the particle remains same as 3m. It means particle was at restfor this time interval.
b.Ture velocity is maximum when the slope is maximum. And slope is maximum for timet=5s to t=7s. Velocty during this
time =slope=0−57−5=−2.5ms−1.
Topper's Solved these Questions
- BOOK - CENGAGE PHYSICS ENGLISHCHAPTER - KINEMATICS-1EXERCISE - Subjective29videos
KINEMATICS-1
- BOOK - CENGAGE PHYSICS ENGLISHCHAPTER - KINEMATICS-1EXERCISE - Single Correct52videos
KINEMATICS-1
- BOOK - CENGAGE PHYSICS ENGLISHCHAPTER - KINEMATICS-1EXERCISE - Exercise 4.315videos
KINEMATICS-1
- BOOK - CENGAGE PHYSICS ENGLISHCHAPTER - GRAVITATIONEXERCISE - INTEGER_TYPE1videos
GRAVITATION
- BOOK - CENGAGE PHYSICS ENGLISHCHAPTER - KINEMATICS-2EXERCISE - Exercise Integer9videos
KINEMATICS-2
Similar Questions
Displacement time graph of a particle moving in a straight line is a shown in figure.
 View Solution
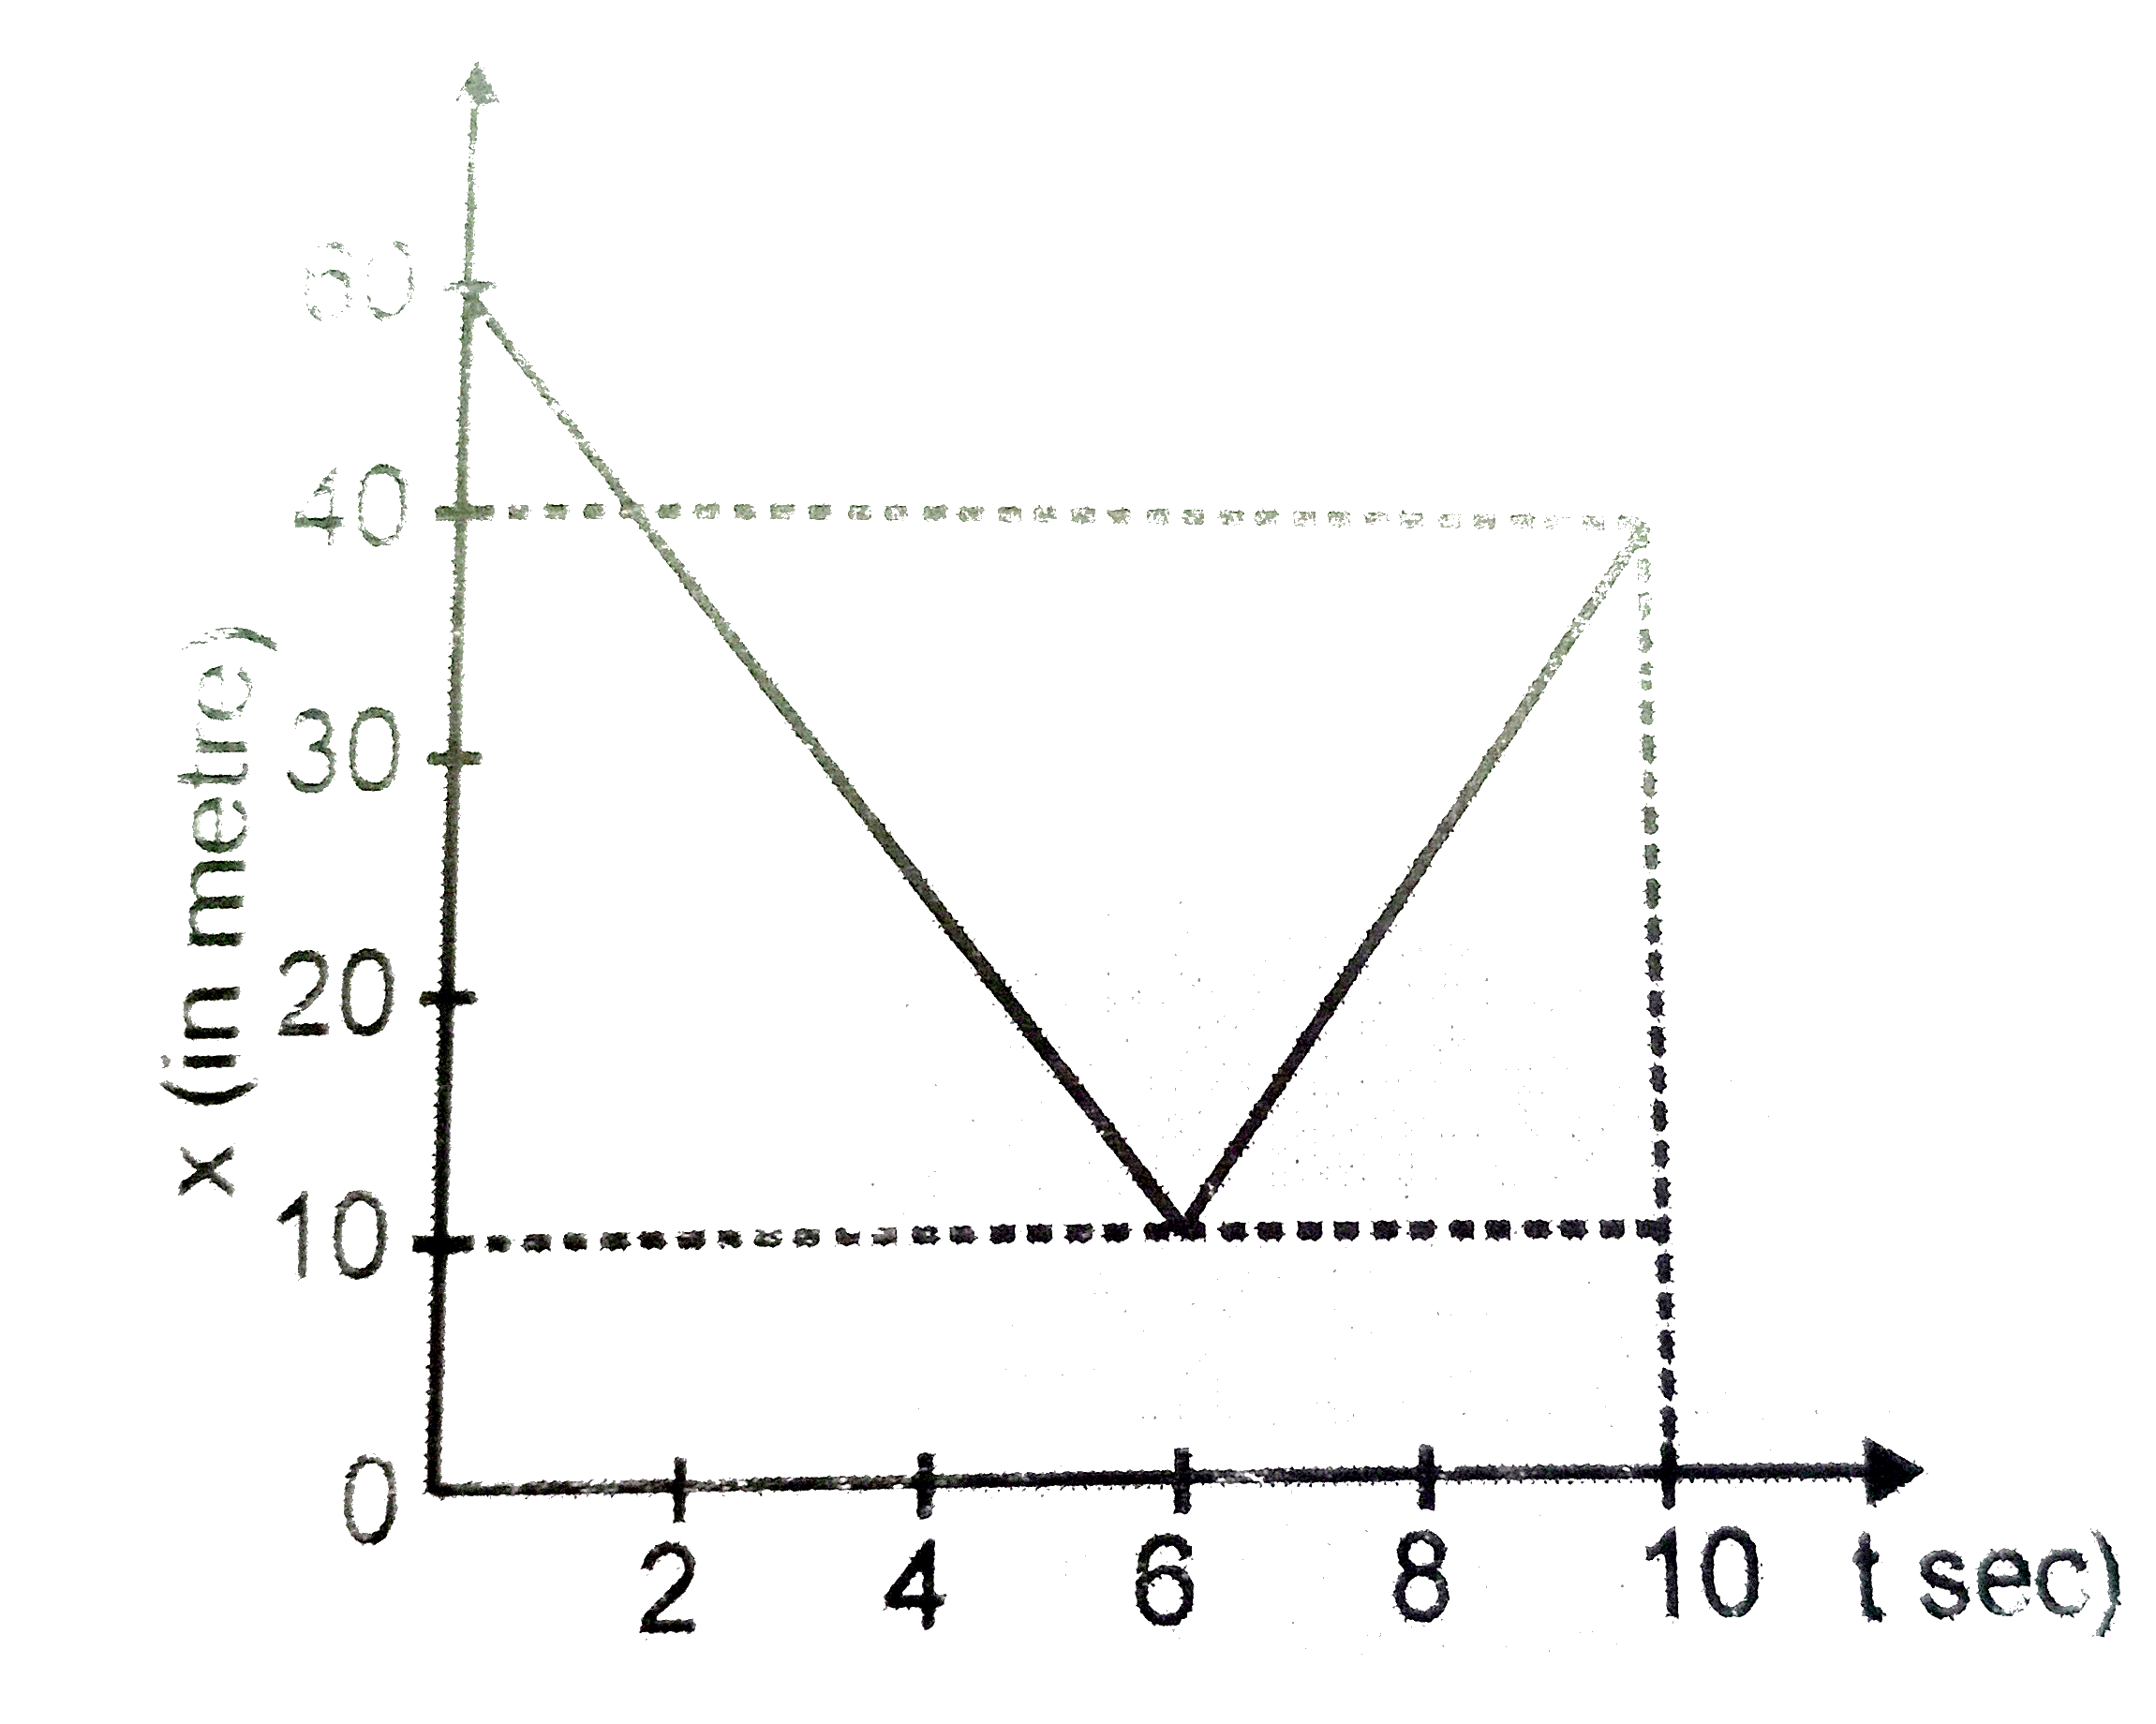
The fig. shows the displacement time graph of a particle moving on a straight line path. What is the magnitude of average velocity of the particle over 10 seconds?
 View Solution
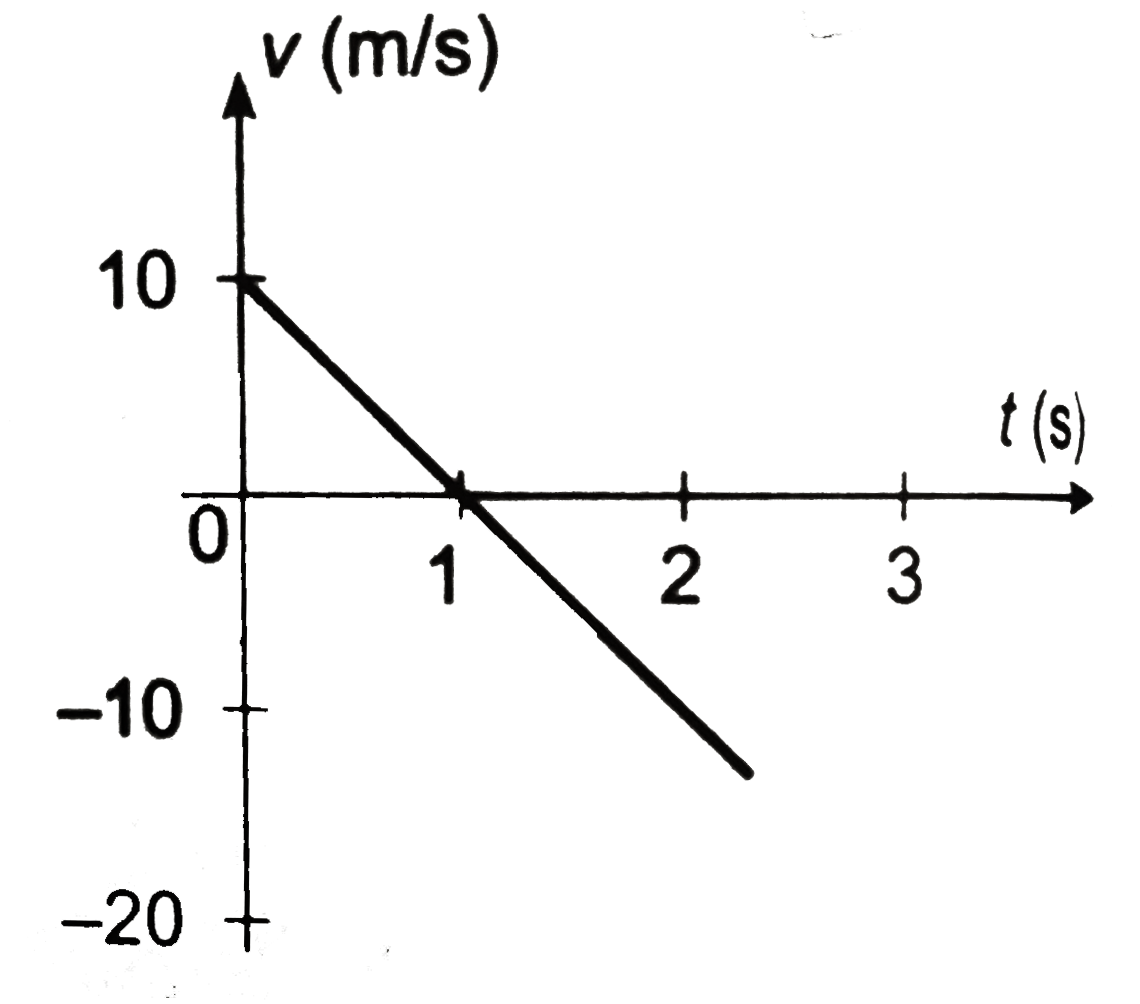
The figure shows velocity-time graph of a particle moving along a straight line. Identify the correct statement.
 View Solution
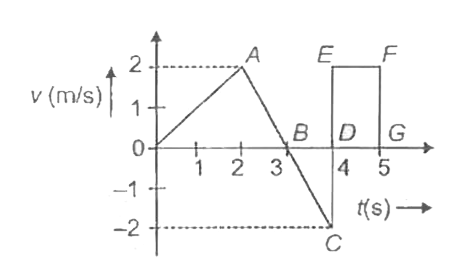
The velocity - time graph of a particle moving along a straight line is shown in the figure given below
The displacement of the particle in 5 second is
 View Solution
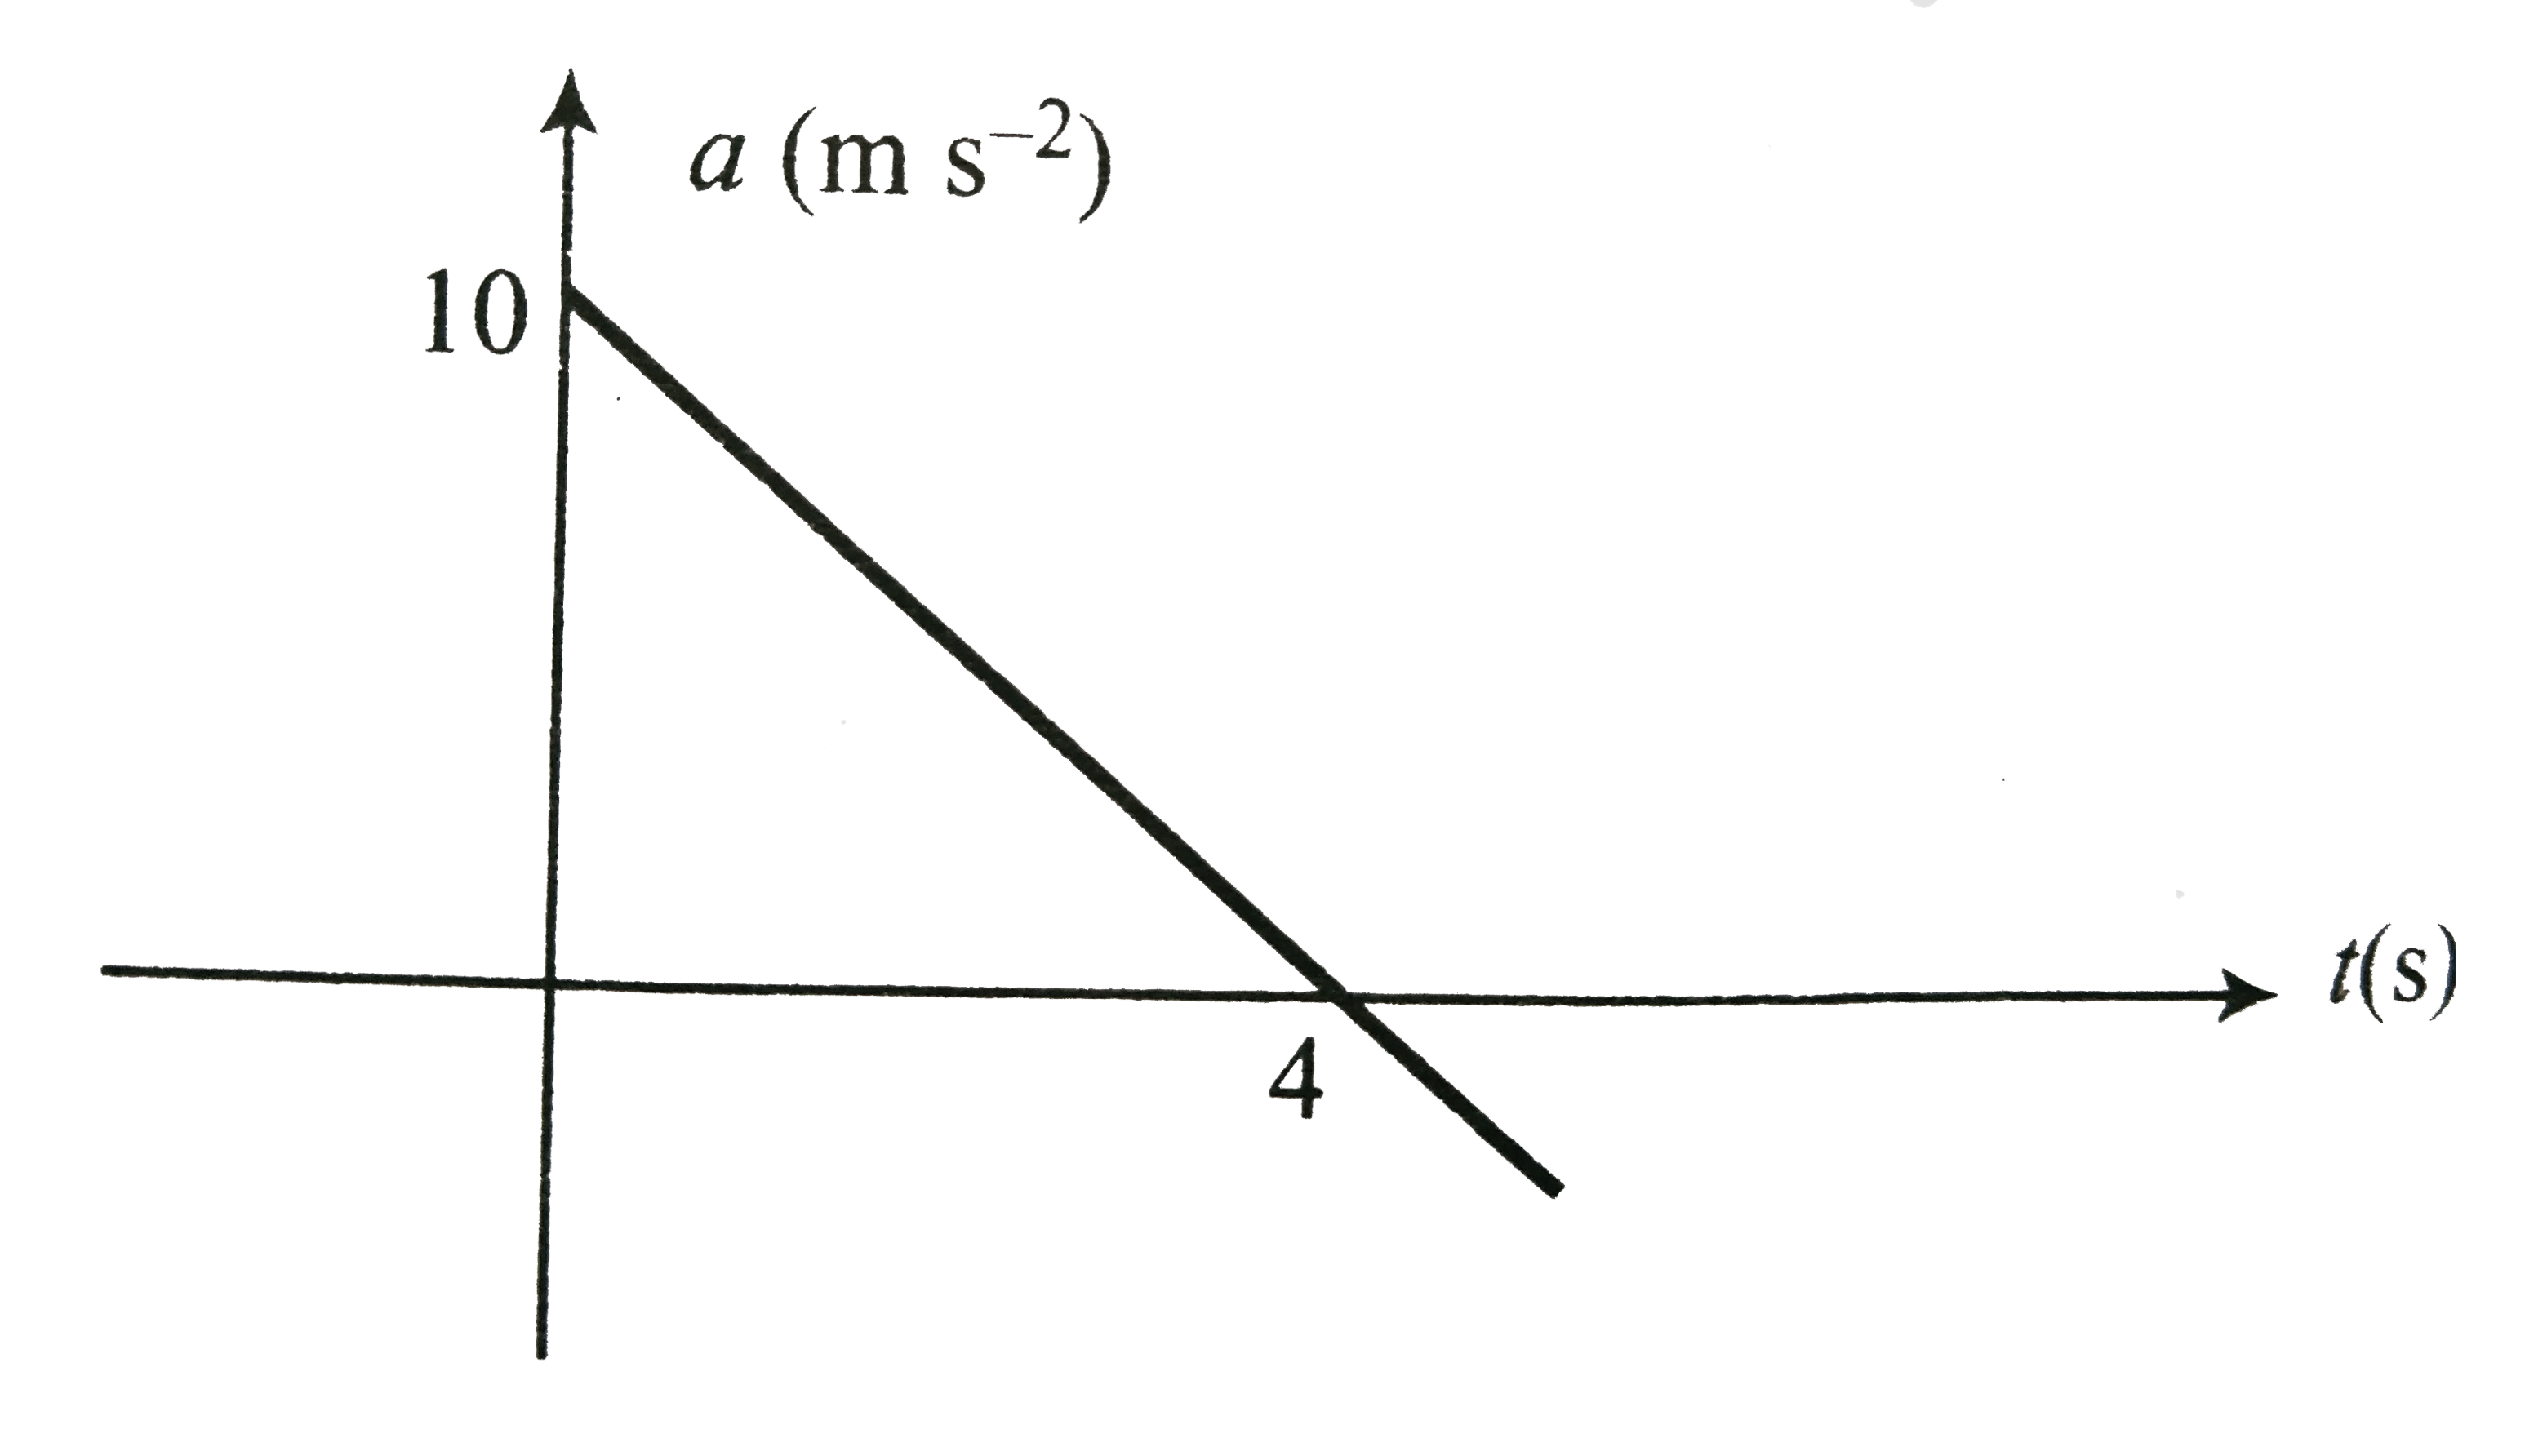
The acceleration-time graph of a particle moving along a straight line is as shown in. At what time the particle acquires its initial velocity?
 .View Solution
The acceleration-time graph of a particle moving along a straight line is as shown in. At what time the particle acquires its initial velocity?
 .View Solution
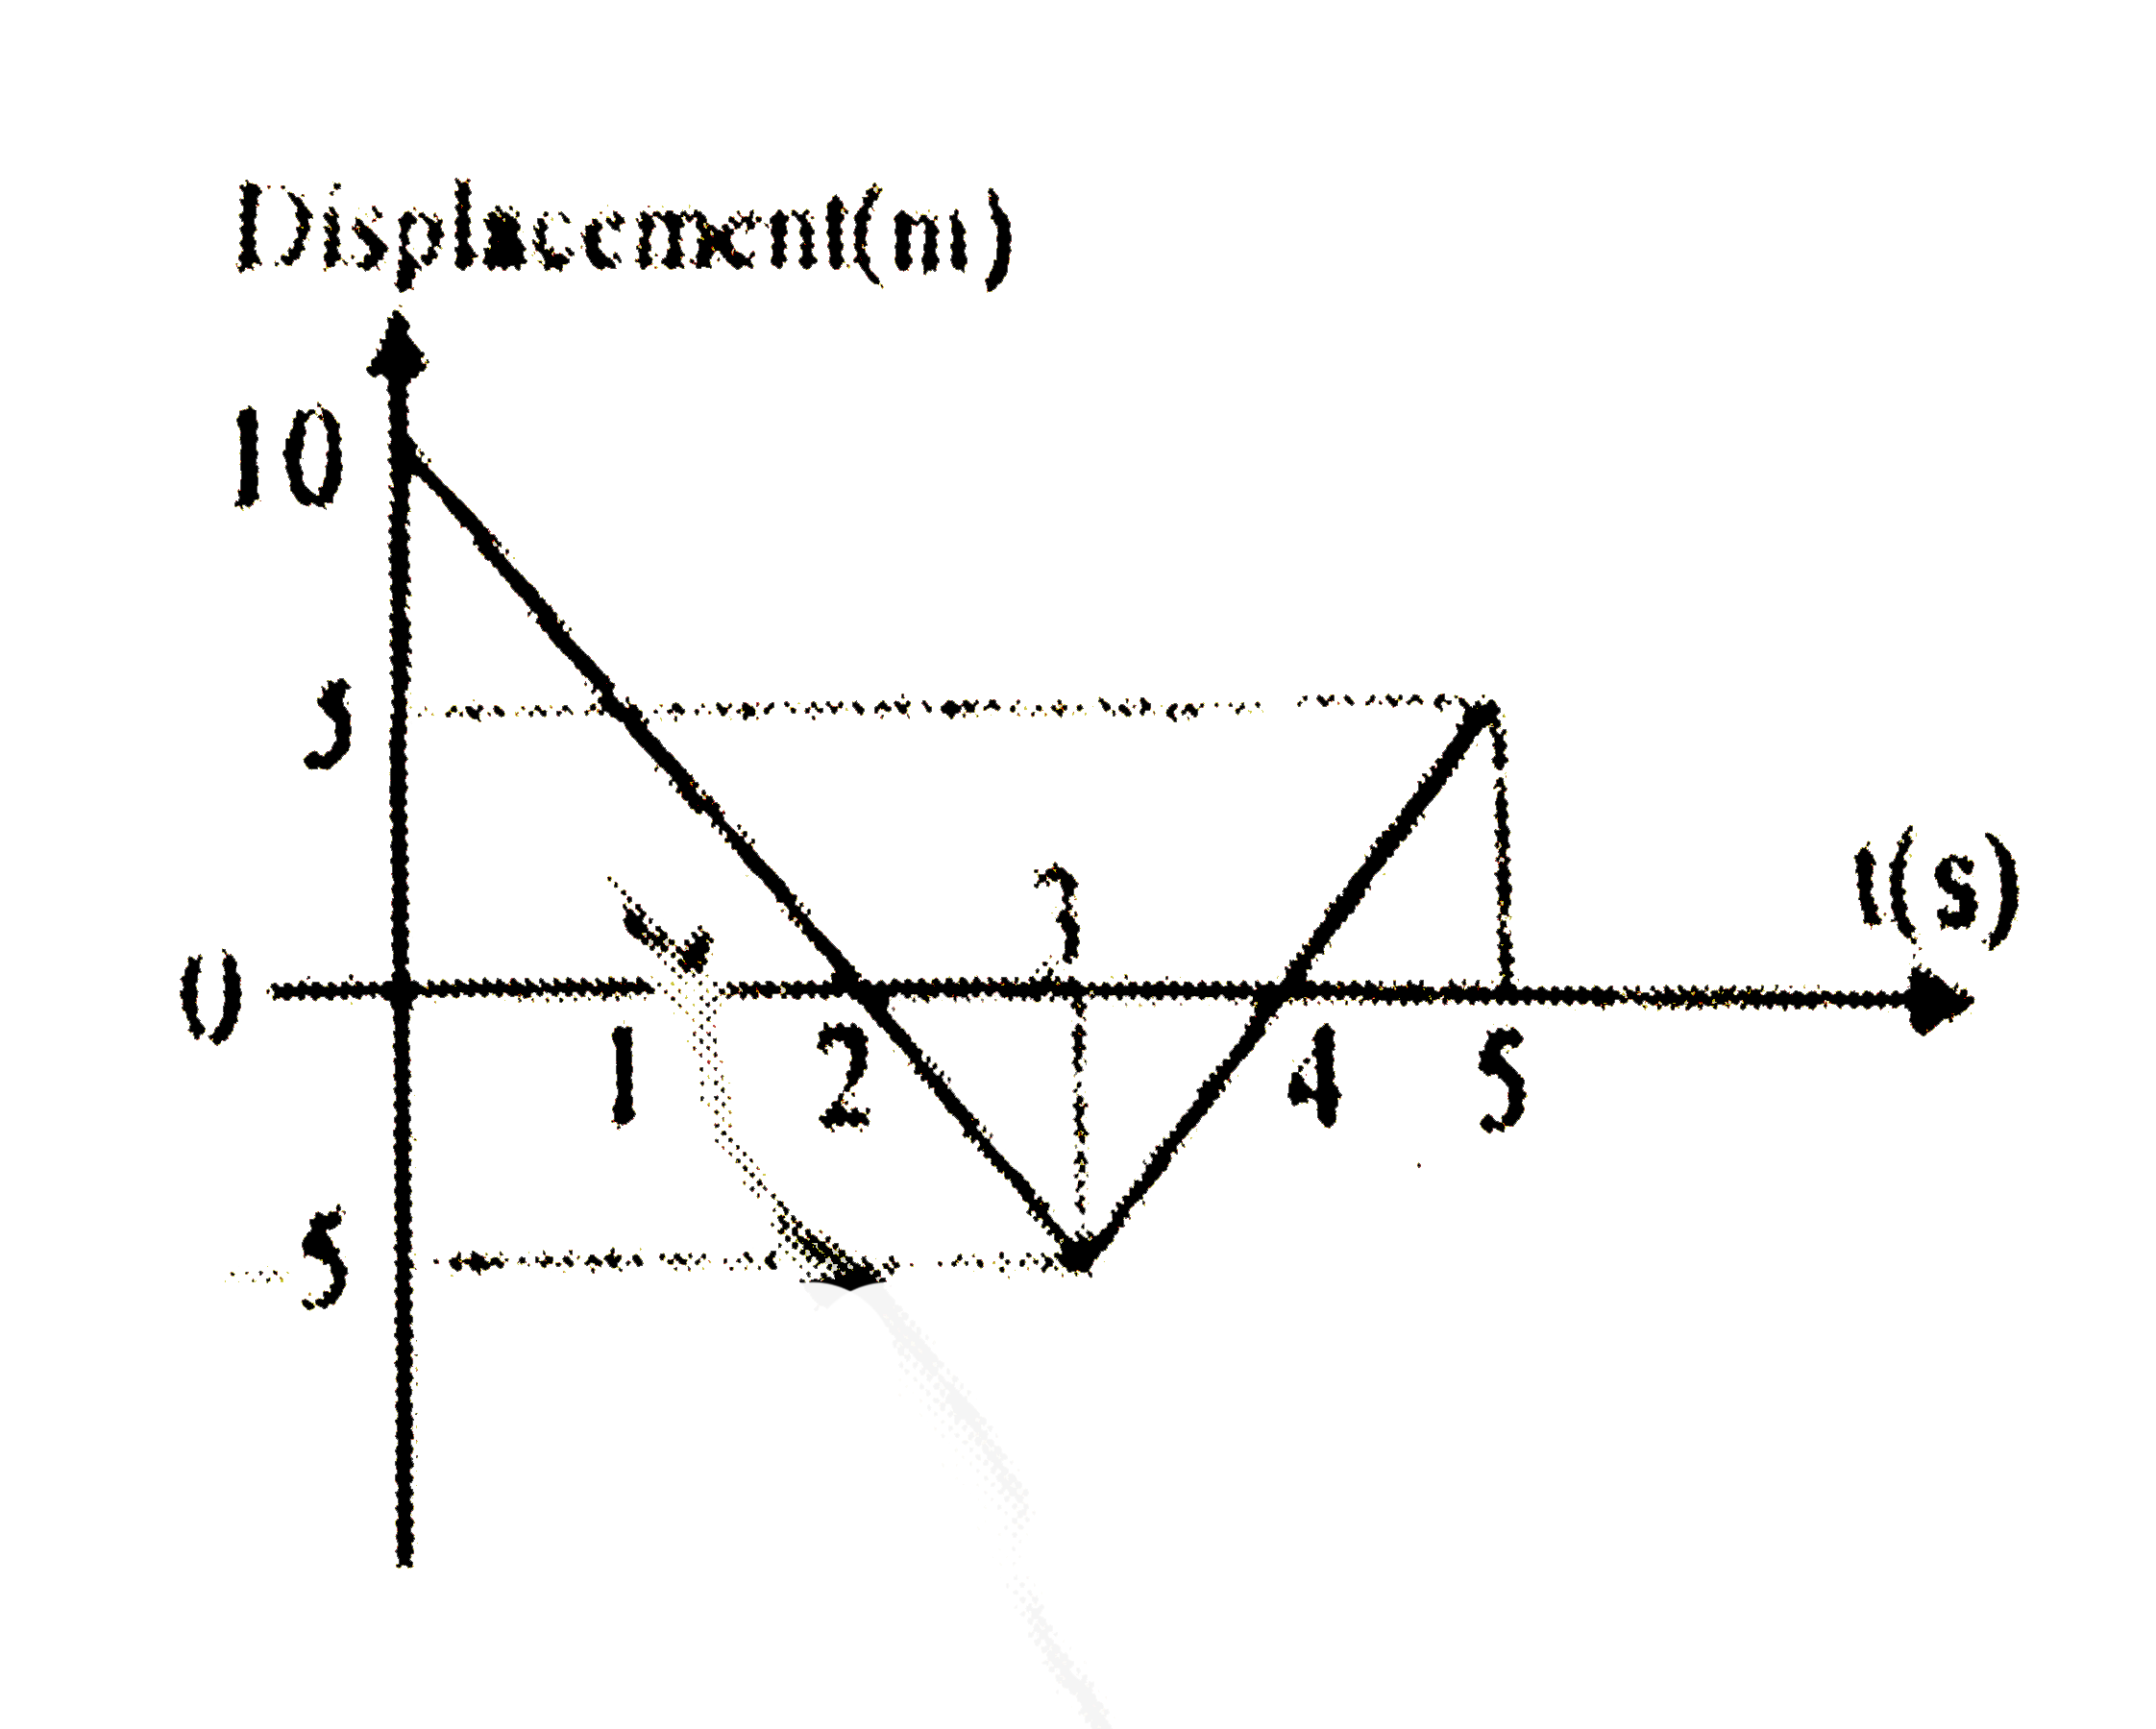
The diagram shows the displacement - time graph for a particle moving in a straight line. The distance (in m) coverted by the particle in the time interval t=0 to t=5s is
 View Solution
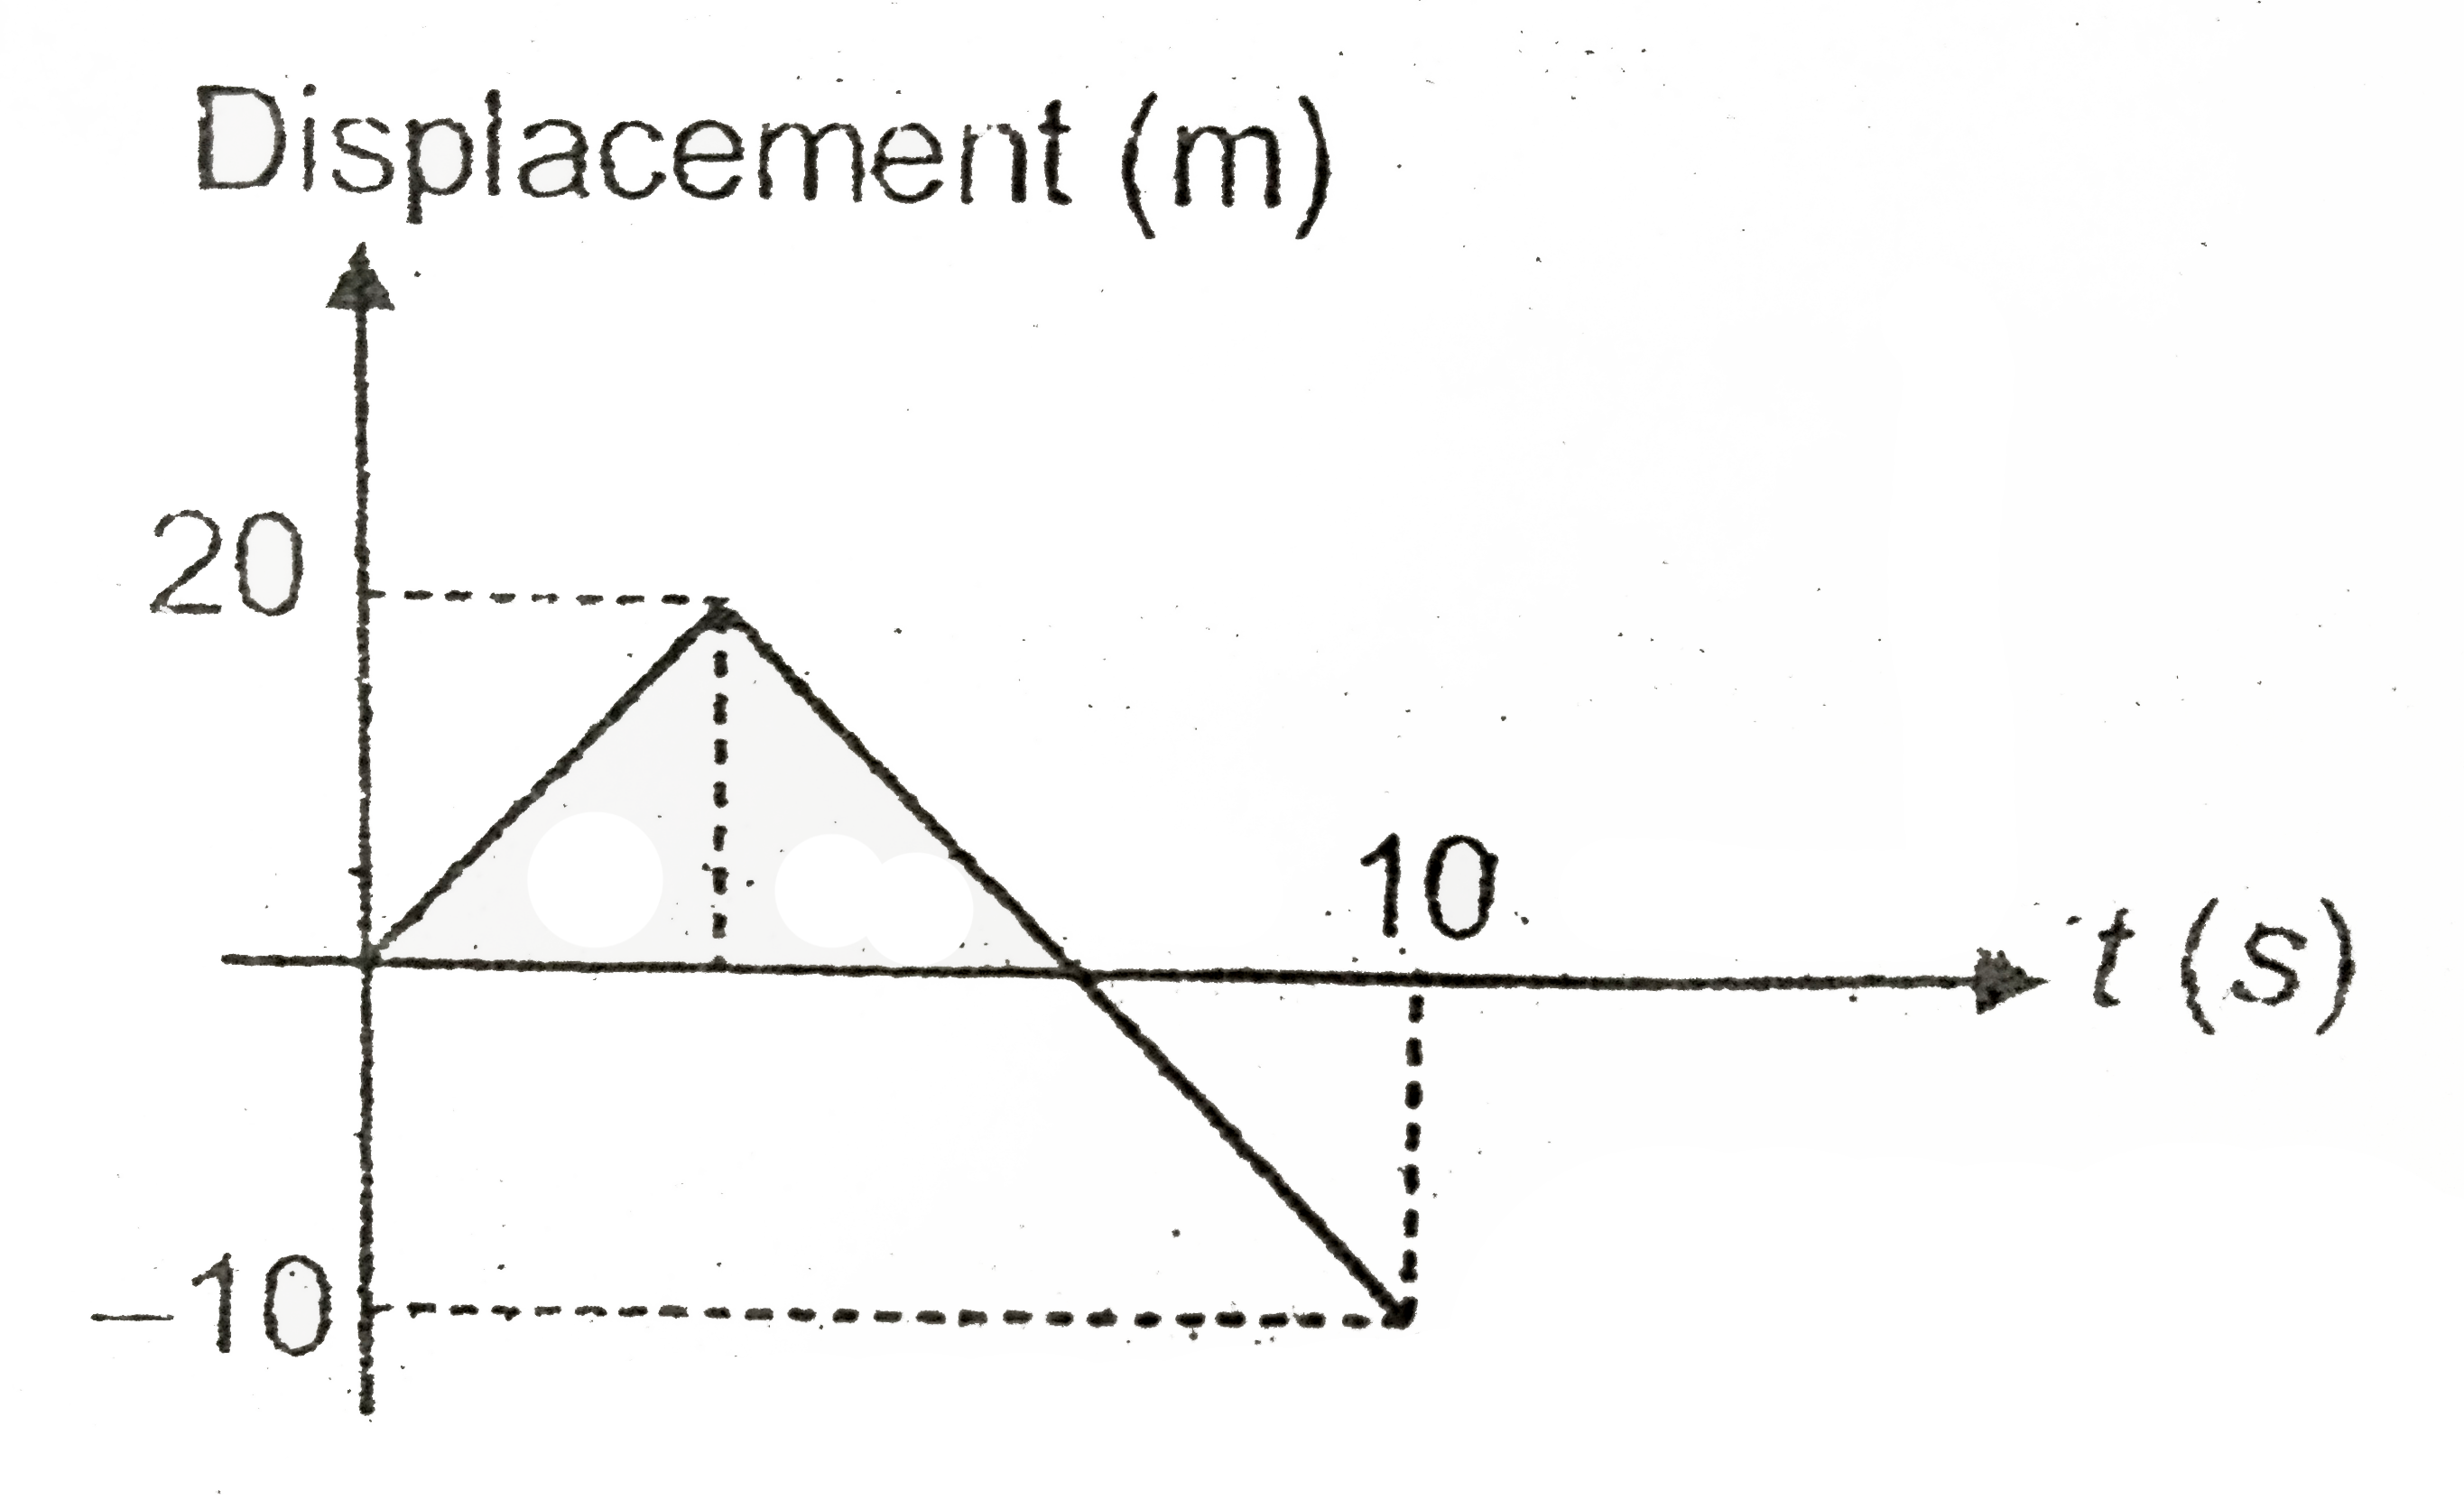
The diagram shows the displacement-time graph for the particle moving in a straight line. What is average speed (in m/s) for the interval 0-10 s?
 View Solution
The velocity time plot for a particle moving on straight line is shown in the figure.
 View Solution
The velocity time plot for a particle moving on straight line is shown in the figure.
 View Solution

