If the thermionic current density is J and emitter temperature is T then the curve between JT2 and 1T will be

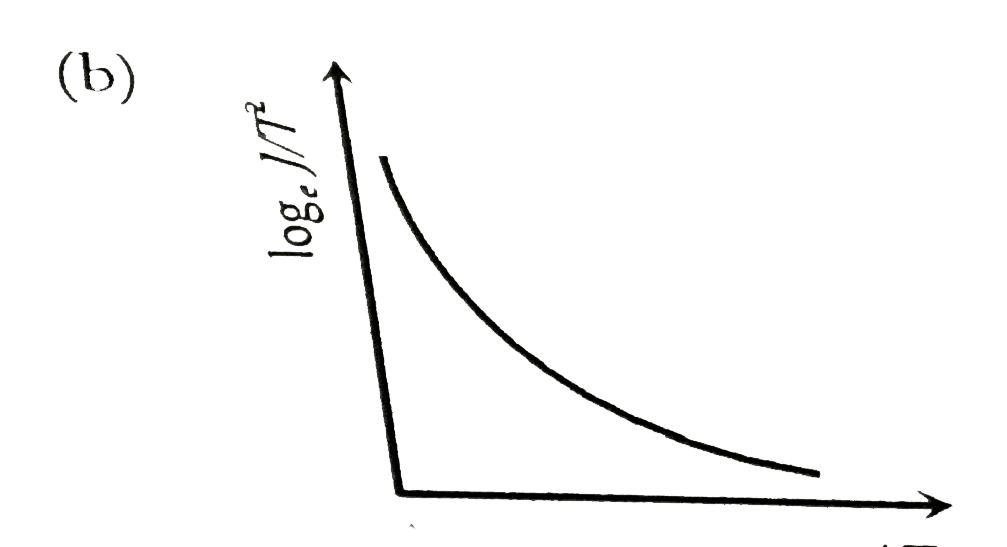
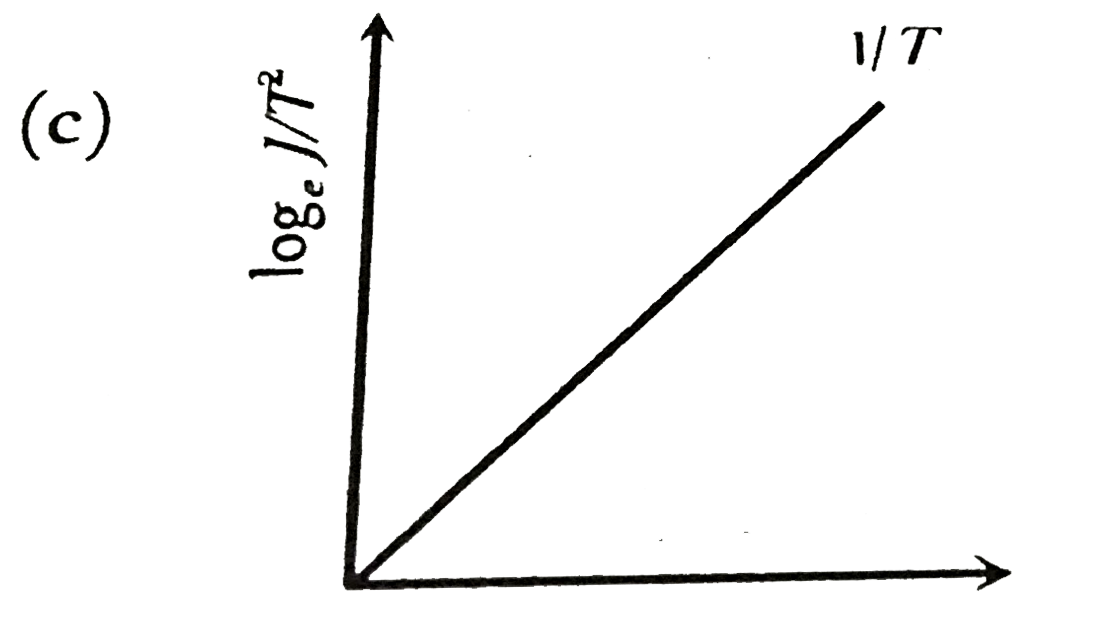
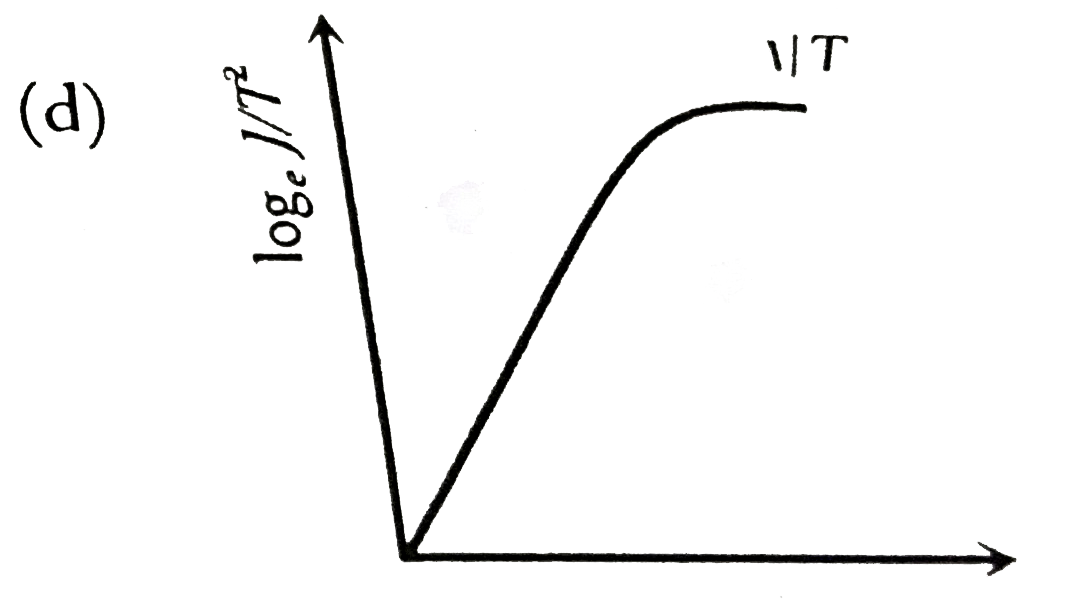
The correct Answer is:A
Step by step video, text & image solution for If the thermionic current density is J and emitter temperature is T then the curve between (J)/(T^(2)) and (1)/(T) will be by Physics experts to help you in doubts & scoring excellent marks in Class 12 exams.
Updated on:21/07/2023Topper's Solved these Questions
- ELECTRONICSBOOK - ERRORLESS CHAPTER - ELECTRONICSEXERCISE - Digital Electronics
2 Videos
- ELECTRONICSBOOK - ERRORLESS CHAPTER - ELECTRONICSEXERCISE - Valve Electronics (Diode and Triode)
3 Videos
- ELECTRON, PHOTON, PHOTOELECTRIC EFFECT AND X-RAYSBOOK - ERRORLESS CHAPTER - ELECTRON, PHOTON, PHOTOELECTRIC EFFECT AND X-RAYSEXERCISE - Self Evaluation Test
3 Videos
- ELECTROSTATICS BOOK - ERRORLESS CHAPTER - ELECTROSTATICS EXERCISE - Ordinary Thinking Objective Questions (Electric Flux and Gauss.s Law)
28 Videos
Similar Questions
Knowledge Check
The current curve between logejT2 and lT
A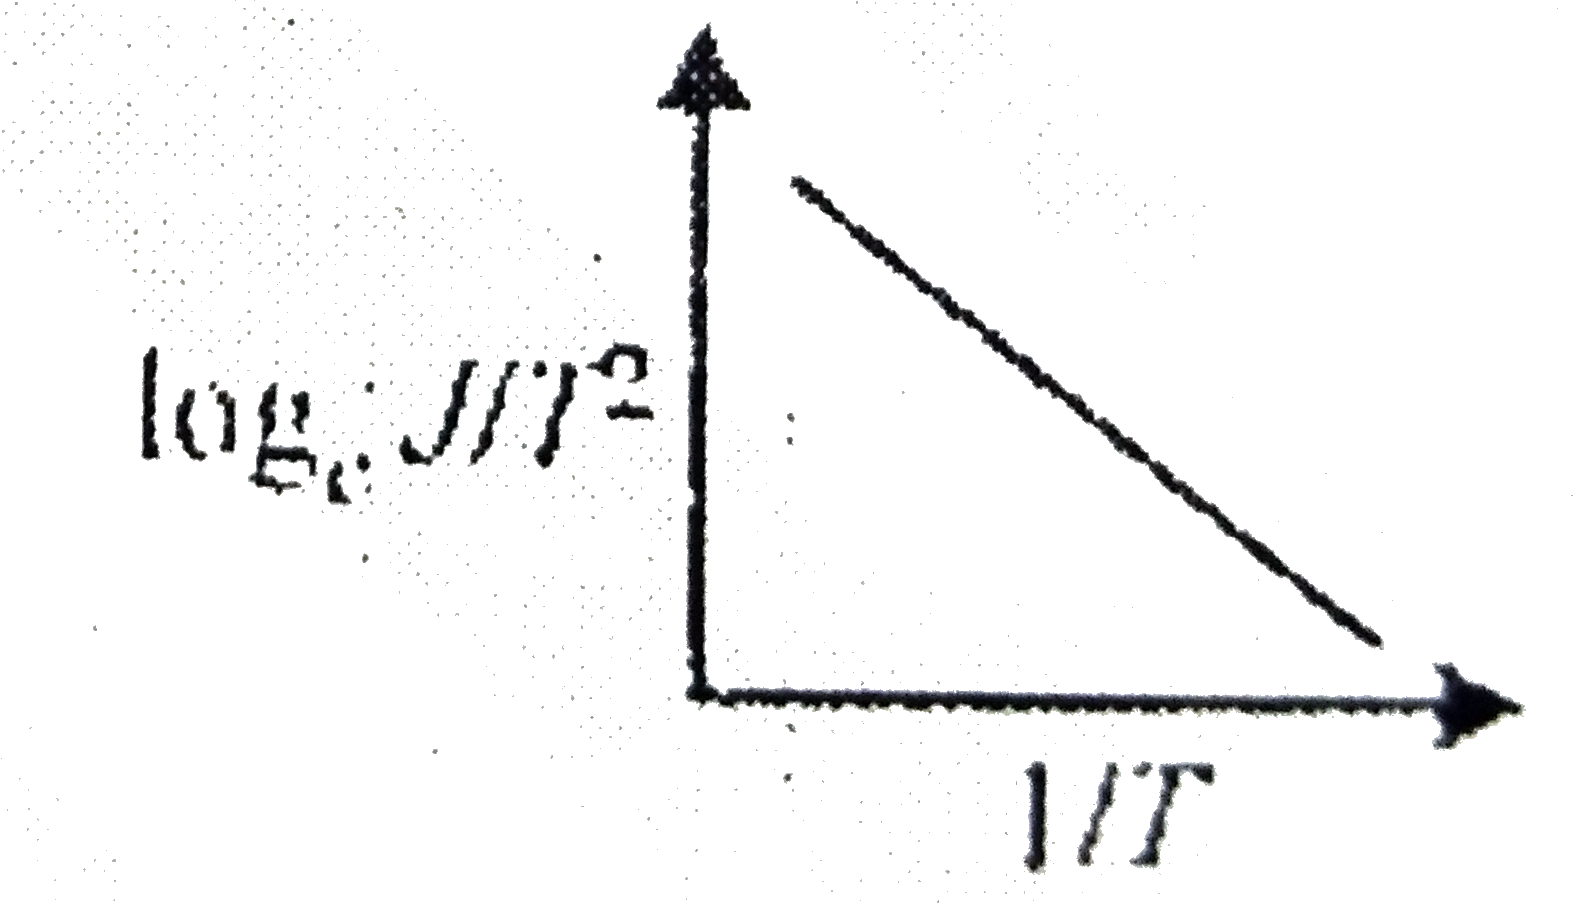 B
B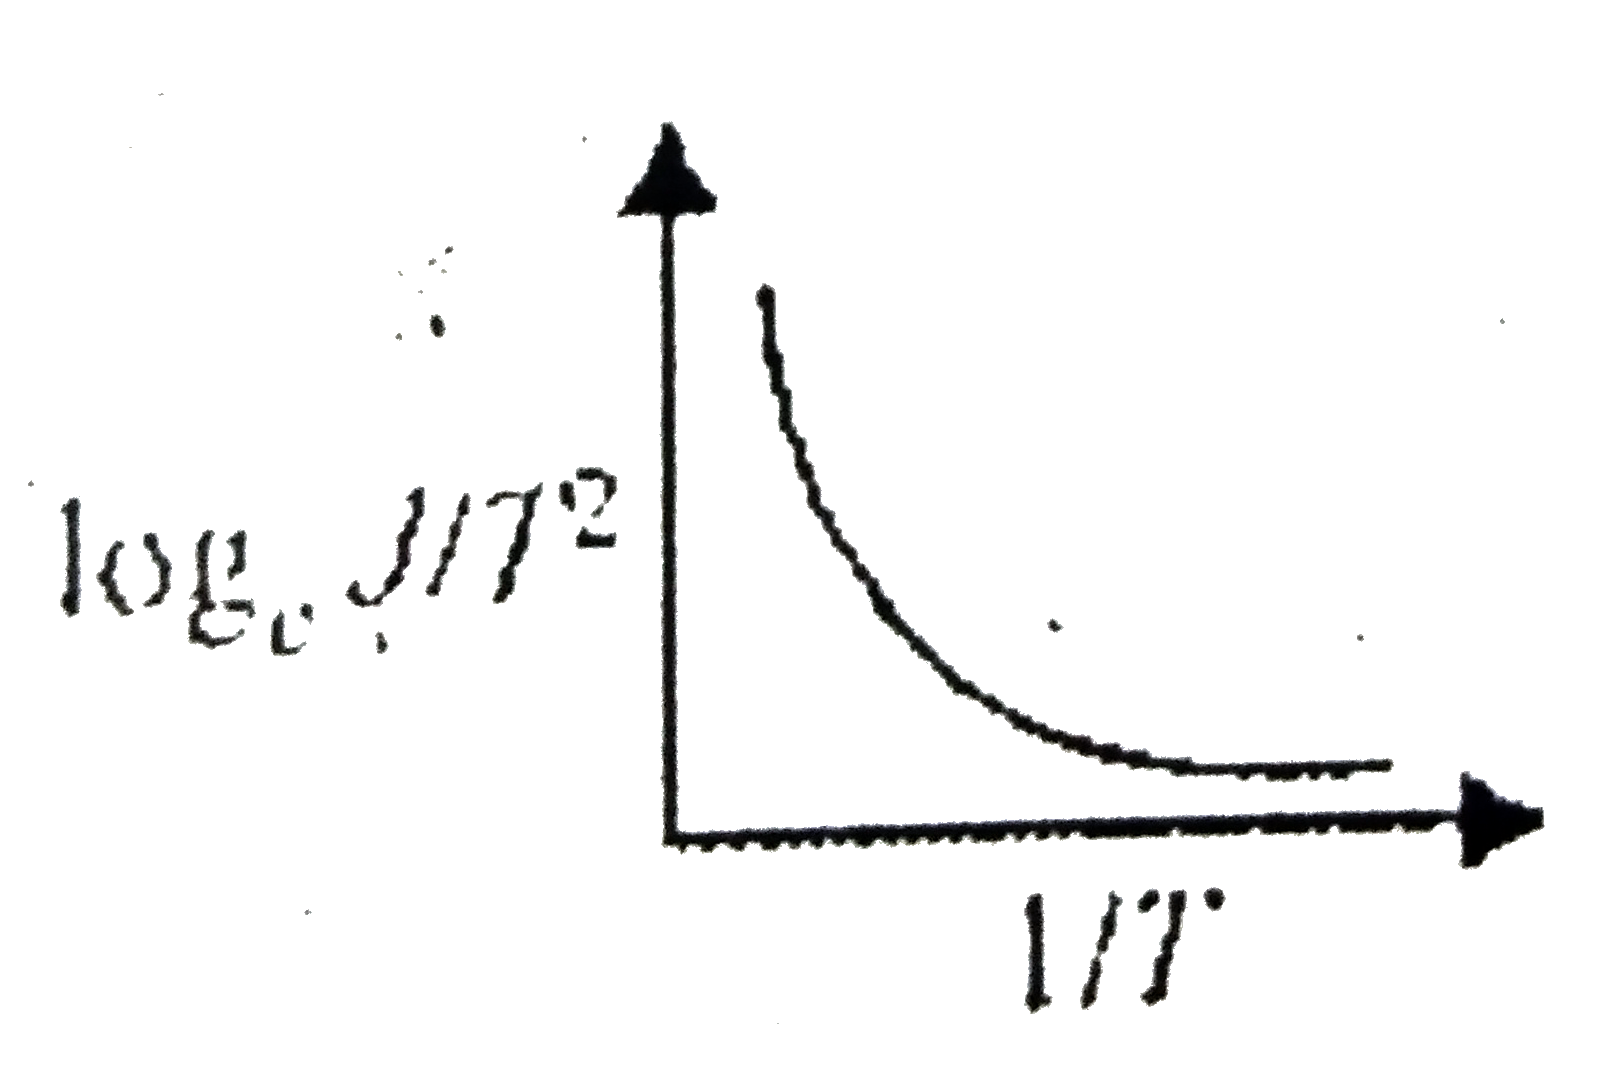 C
C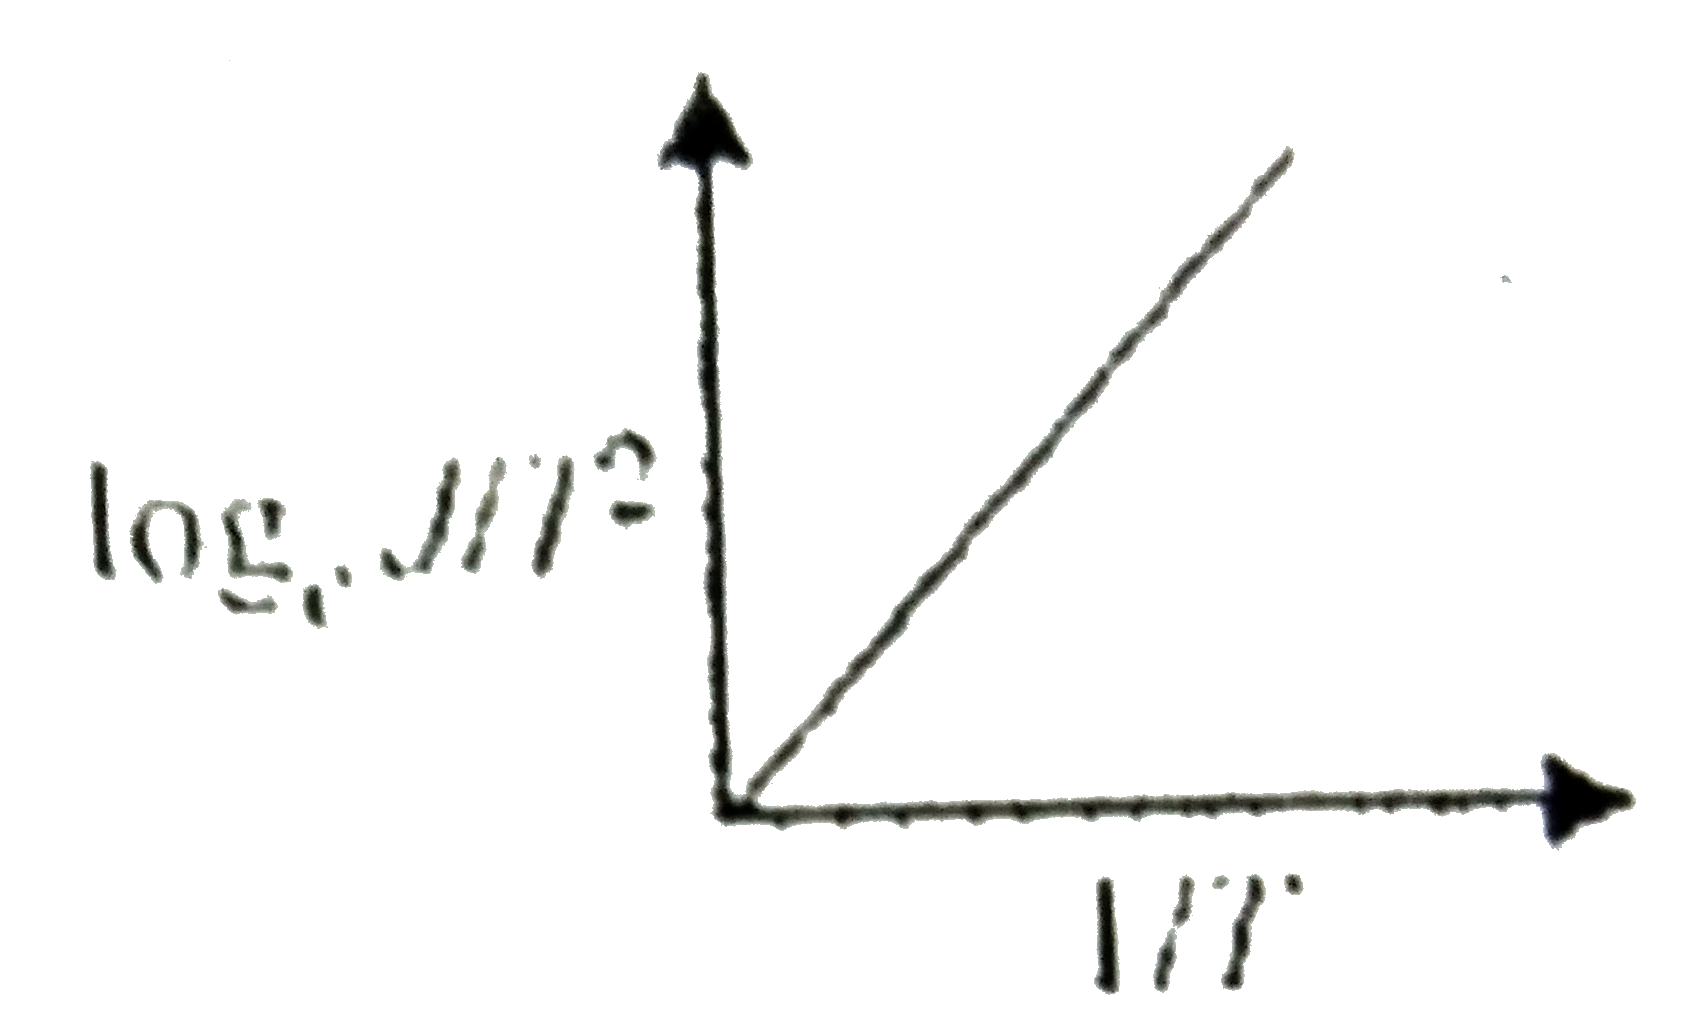 D
D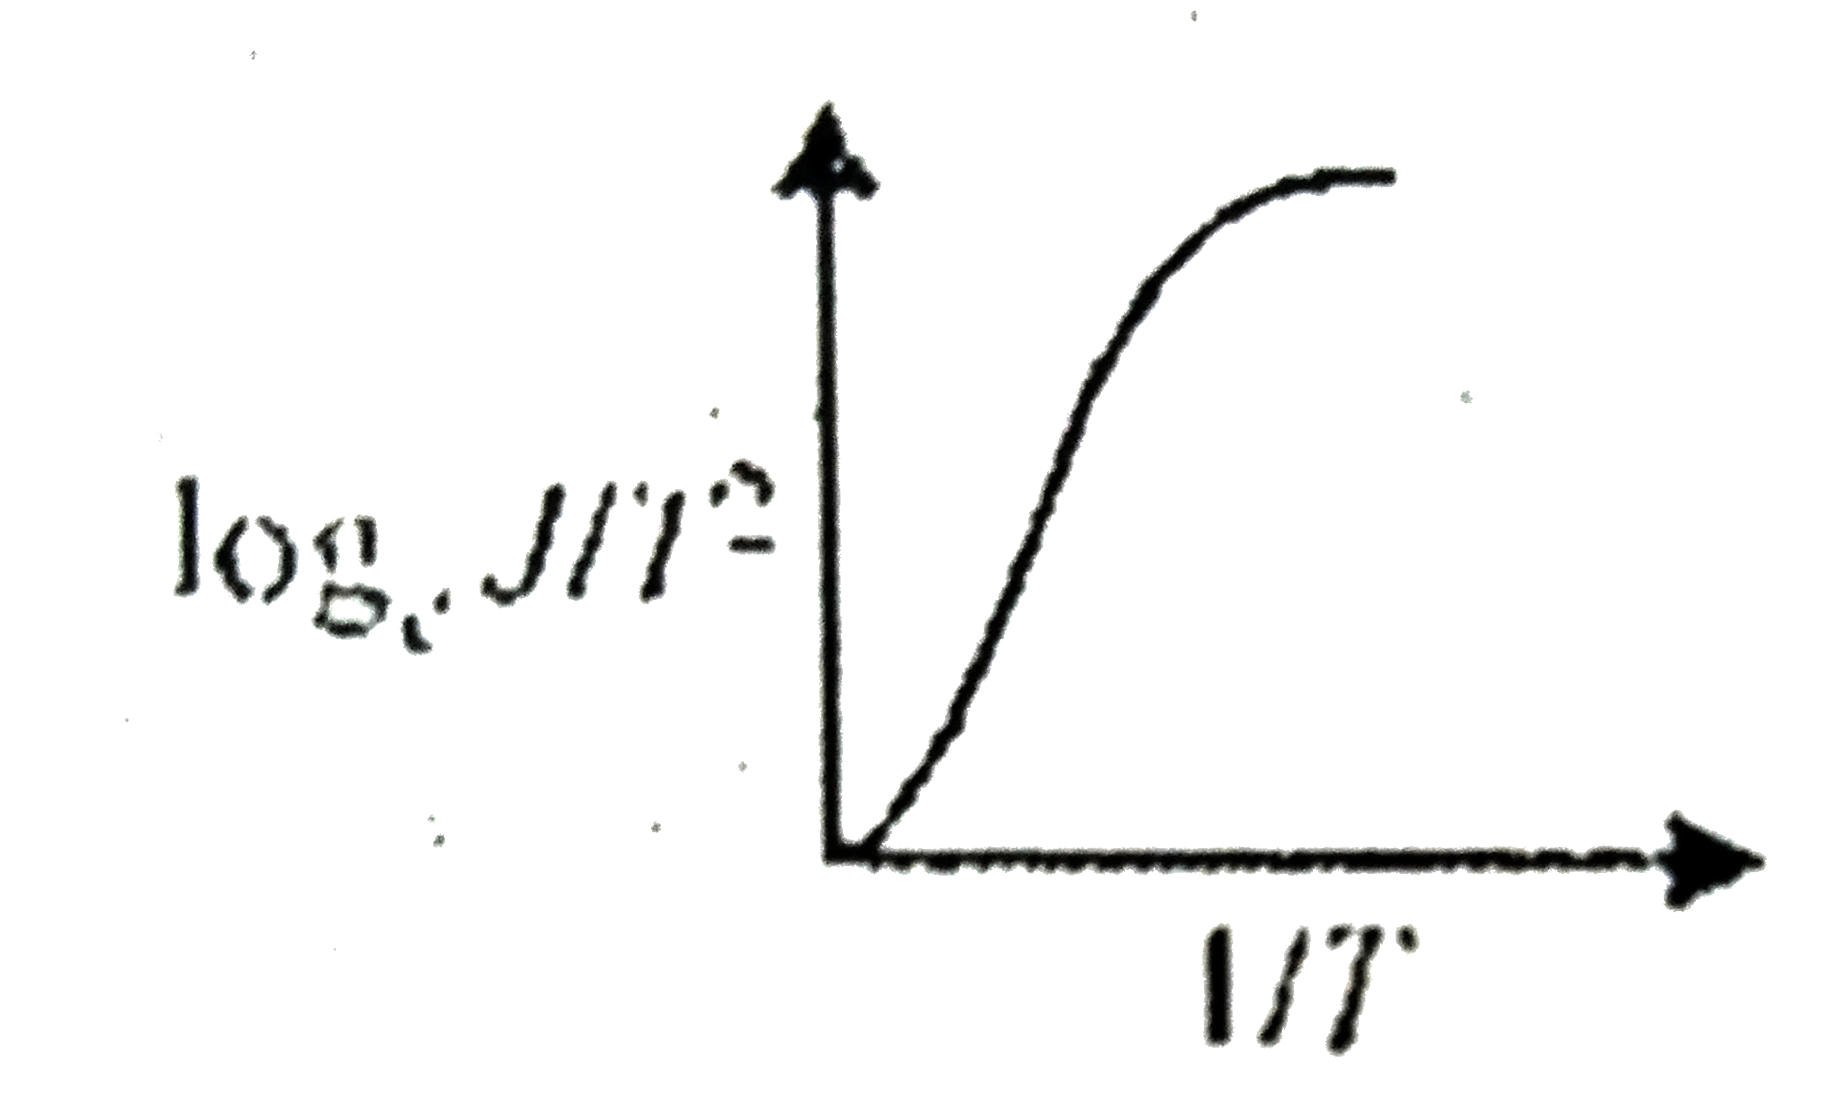
The ratio of thermionic currents (I/I0) for a metal when the temperature is slowly increased T0 to T as shown in figure. (I and I0 are currents at T and respectively). Then which one is correct?
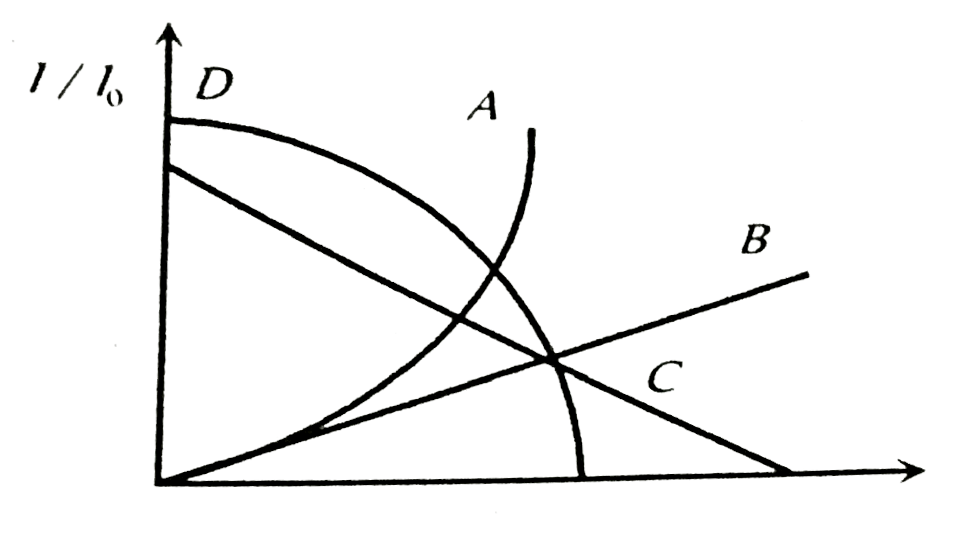 AABBCCDD
Thermionic emission from a heated filament varies with its temperature T as
AT−1BTCT2DT3/2
Above the inversion temperature, μ (J.T. coefficient)
View SolutionT1 is the temperature of oxygen enclosed in a cylinder. The temperature is increased to T2 and Maxwellian distribution curves for O2 at temperatures T1andT2 are plotted. If A1andA2 are the areas under the curves and the speed axis, in both cases, then
View SolutionOne junction of a certain thermoelectric couple is at a fixed temperature r T and the other junction is at temperature T . The thermo electromotive force for this is expressed by E=K(T−Tr)[T0−12(T+Tr)]. At temperature T=12T0, the thermoelectric power is
View SolutionIn a certain circuit current changes with time according to i=2√t RMS value of current between t=2s to t=4s will be
View SolutionThe voltage V and current I v graphs for a conductor at two different temperatures T1andT2 are shown in the figure. The relation between T1andT2 is

View Solution

