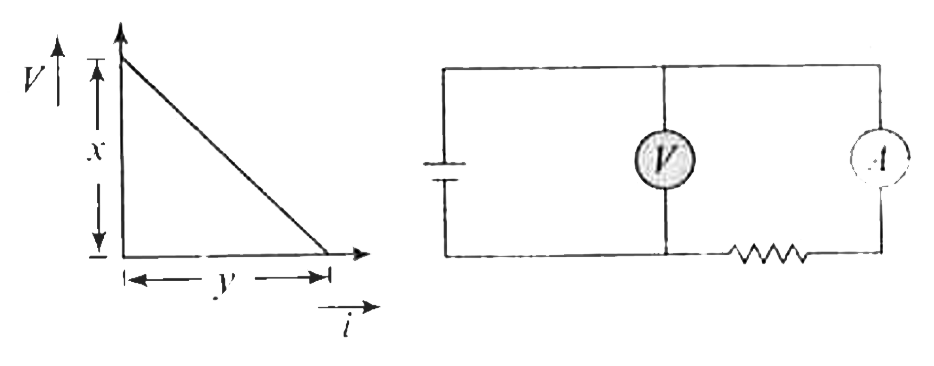
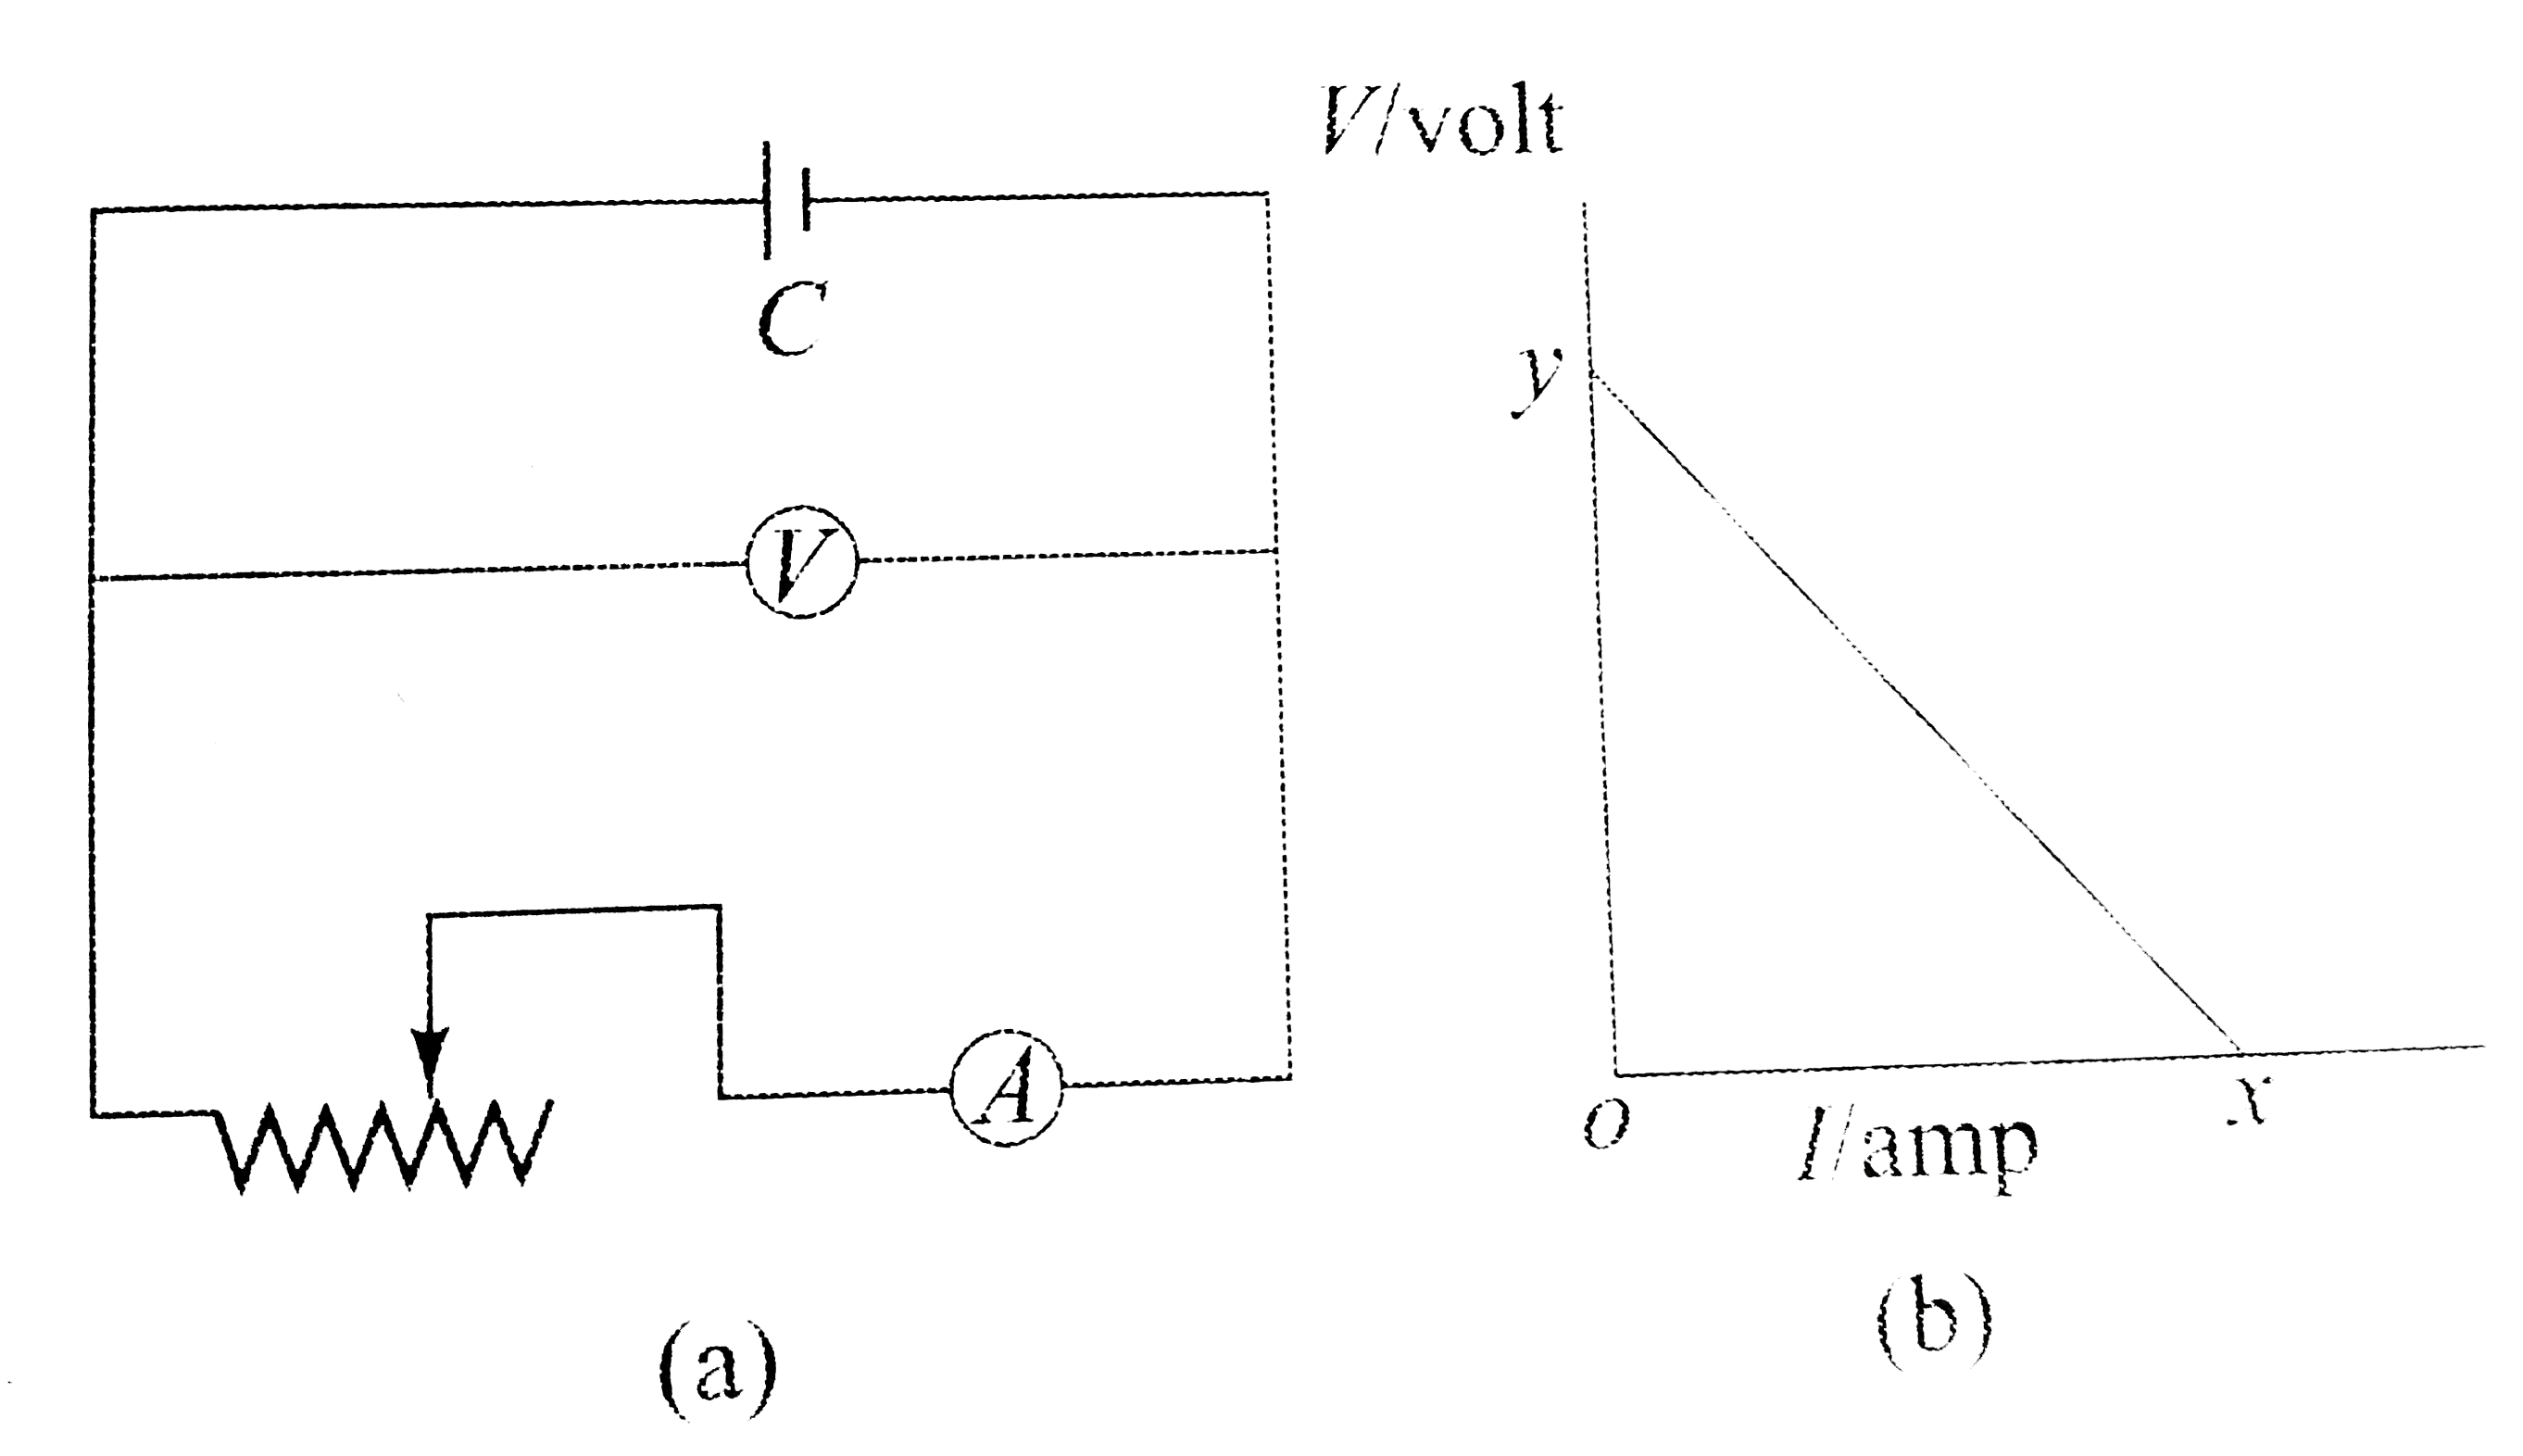
In an experiment, a graph was plotted of the potential difference V between the terminals of a cell against the circuit current "I" by varying load rheostat, internal conductance of the cell is given by

X
Y
X/Y
Y/X
The correct Answer is:D
Step by step video, text & image solution for In an experiment, a graph was plotted of the potential difference V between the terminals of a cell against the circuit current "I" by varying load rheostat, internal conductance of the cell is given by by Physics experts to help you in doubts & scoring excellent marks in Class 11 exams.
Updated on:21/07/2023Topper's Solved these Questions
Similar Questions
In an experiment a graph was plotted of the potential difference V between the terminals of a cell against circuit current I by varying load rheostat. Find the internal conductance fo the cell.

View SolutionThe potential difference between the terminals of a cell in an open circuit is called _____.
View Solution
Knowledge Check
The potential difference across the terminals of the cell in open circuit is called as
AcurrentBpot. diff. of cellCe.m.f. of cellDresistanceshows a circuit used in an experiment to determine the emf and internal resistance of the battery C. A graph was plotted of the potential difference V between the terminals of the battery against the current I, which was varied by adjusting the rheostat. The graph is shown in x and y are the intercepts of the graph with the axes as shown. What is the internal resistance of the battery?
 AxByCx/yDy/x
For a cell, a graph is plotted between the potential difference V across the terminals of the cell and the current I drawn the cell. The emf and the internal resistance of the cell are E and r, respectively. Then
 AE=2V,r=0.5ΩBE=2V,r=0.4ΩCE>2V,r=0.5ΩDE>2V,r=0.4Ω
Potential difference between the terminals of a cell/battery is equal to its emf when the cell/battery is____.
View SolutionA resistance R is connected across of a cell of emf ε and internal resistance r and the potential difference between the terminals of cell is found to be V. The internal resistance of the cell is given by the relation r = _____
View SolutionWhat is the relationship between potential difference across the terminals of a cell and emf of the cell ?
View SolutionThe potential difference between the terminals of a cells is found to be 3 volts when it is connected to a resistance equal to its internal resistance. The e.m.f. of the cell is :–
View Solutionv31
View Solution
