In Newton's law of cooling experiment, we plot a graph of (dθdt) against the temperature difference (θ−θ0). The graph is
a curve passing through the origin
a straight line passing through the origin
a straight line having an intercept on the y axis
a straight line having an intercept on the temperature axis
The correct Answer is:B
Step by step video, text & image solution for In Newton's law of cooling experiment, we plot a graph of ((d theta)/(dt)) against the temperature difference (theta-theta_(0)). The graph is by Physics experts to help you in doubts & scoring excellent marks in Class 12 exams.
Updated on:21/07/2023Topper's Solved these Questions
- KINETIC THEORY OF GASES ,THERMODYNAMICS AND RADIATIONBOOK - MARVEL PUBLICATIONCHAPTER - KINETIC THEORY OF GASES ,THERMODYNAMICS AND RADIATIONEXERCISE - TEST YOUR GRASP - 9
30 Videos
- INTERFERENCE AND DIFFRACTIONBOOK - MARVEL PUBLICATIONCHAPTER - INTERFERENCE AND DIFFRACTIONEXERCISE - TEST YOUR GRASP
20 Videos
- MAGNETIC EFFECTS OF ELECTRIC CURRENTBOOK - MARVEL PUBLICATIONCHAPTER - MAGNETIC EFFECTS OF ELECTRIC CURRENTEXERCISE - MCQ
195 Videos
Similar Questions
State Newton's law of cooling and draw the graph showing cooling of hot water with temperature.
View SolutionAc cording to Newton's law of cooling, the rate of cooling of a body is proportional to (Δθ)n, where Δθ is the difference of the temperature of the body and thae surrounding. What is the value of n out of 4,3,2,and 1?
View Solution
Knowledge Check
The (τ−θ) graph for a current carrying coil placed in a uniform magnetic field is
A B
B C
C D
D
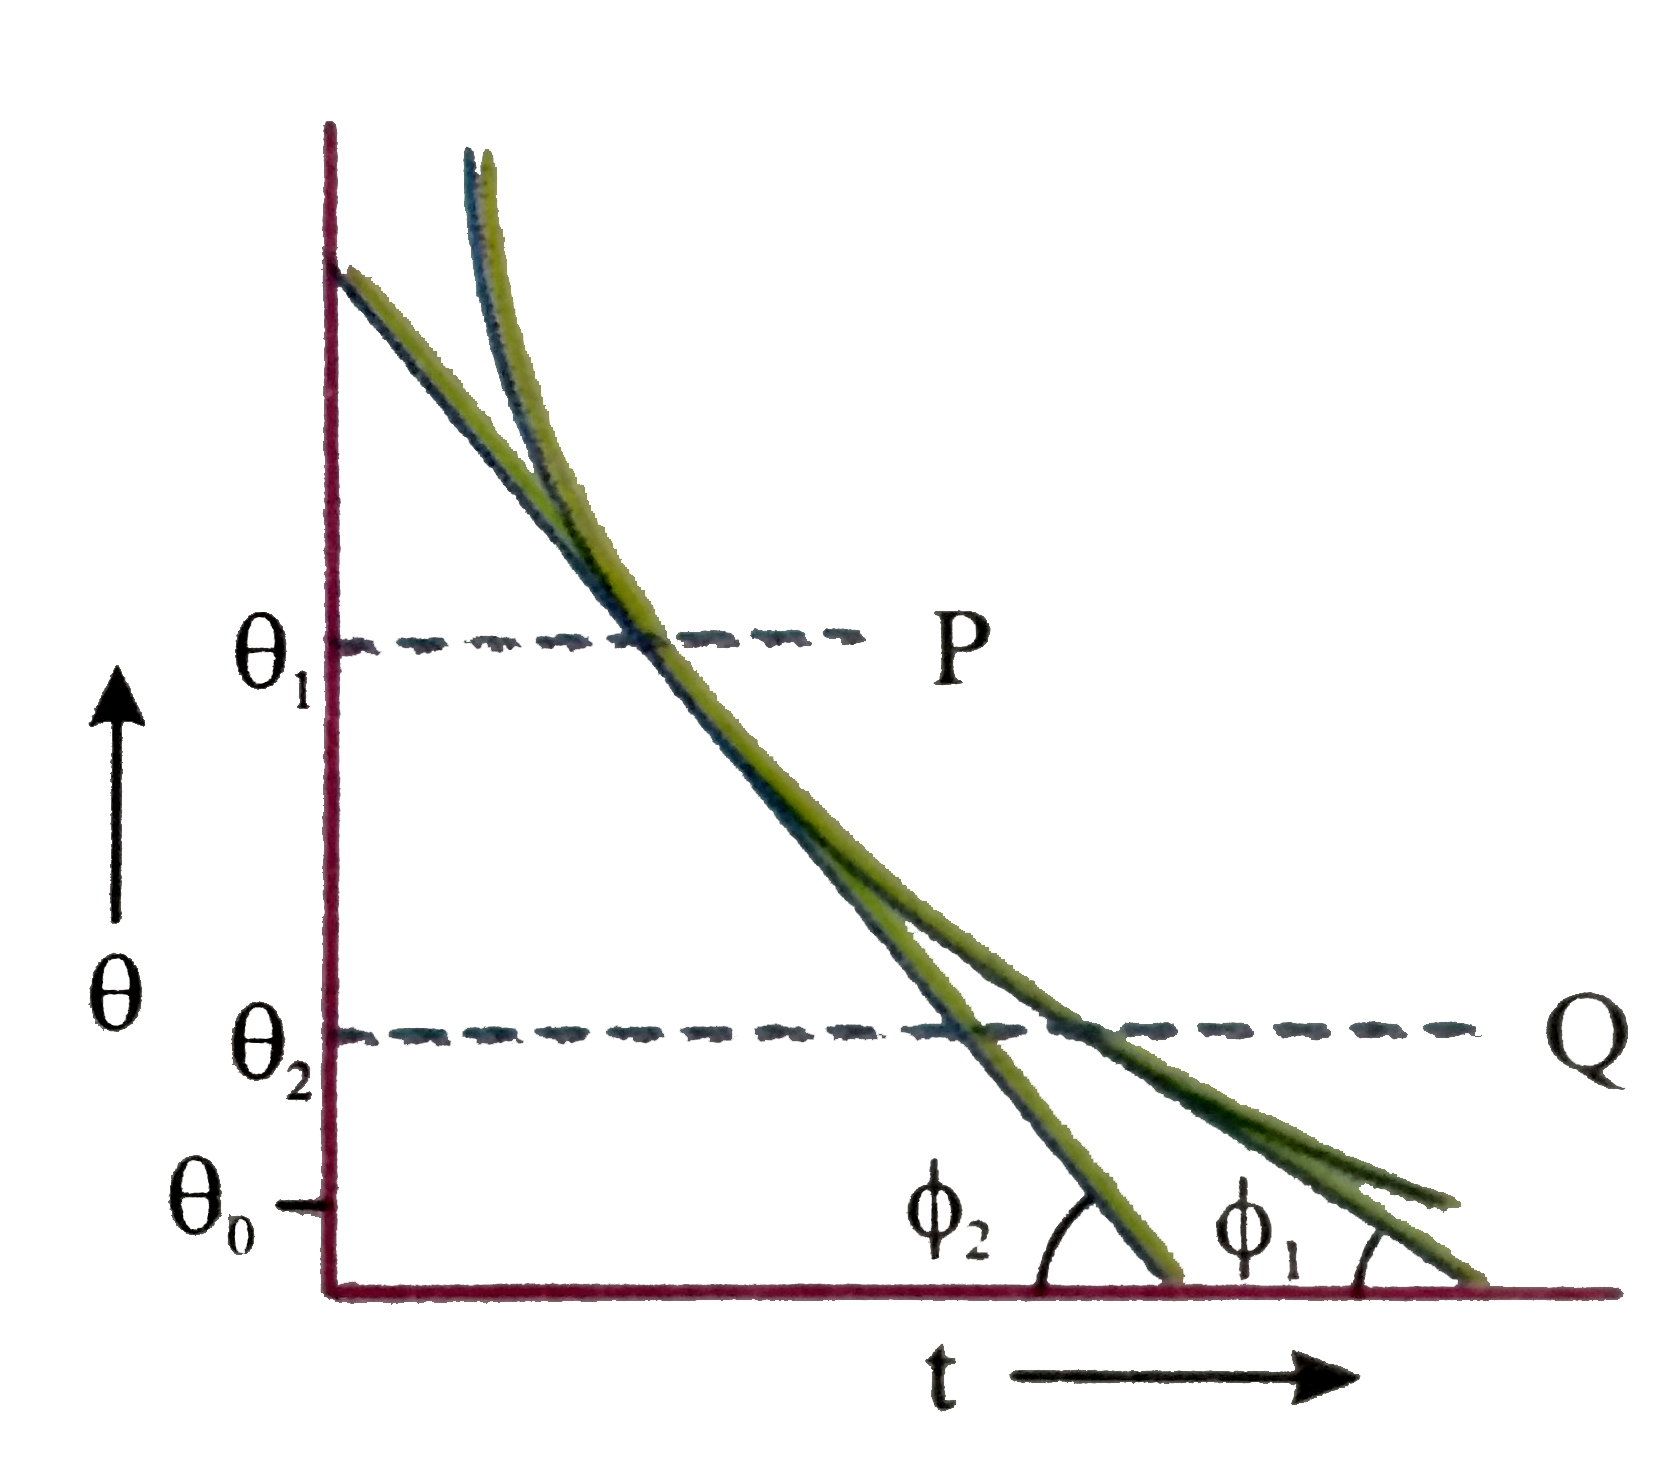
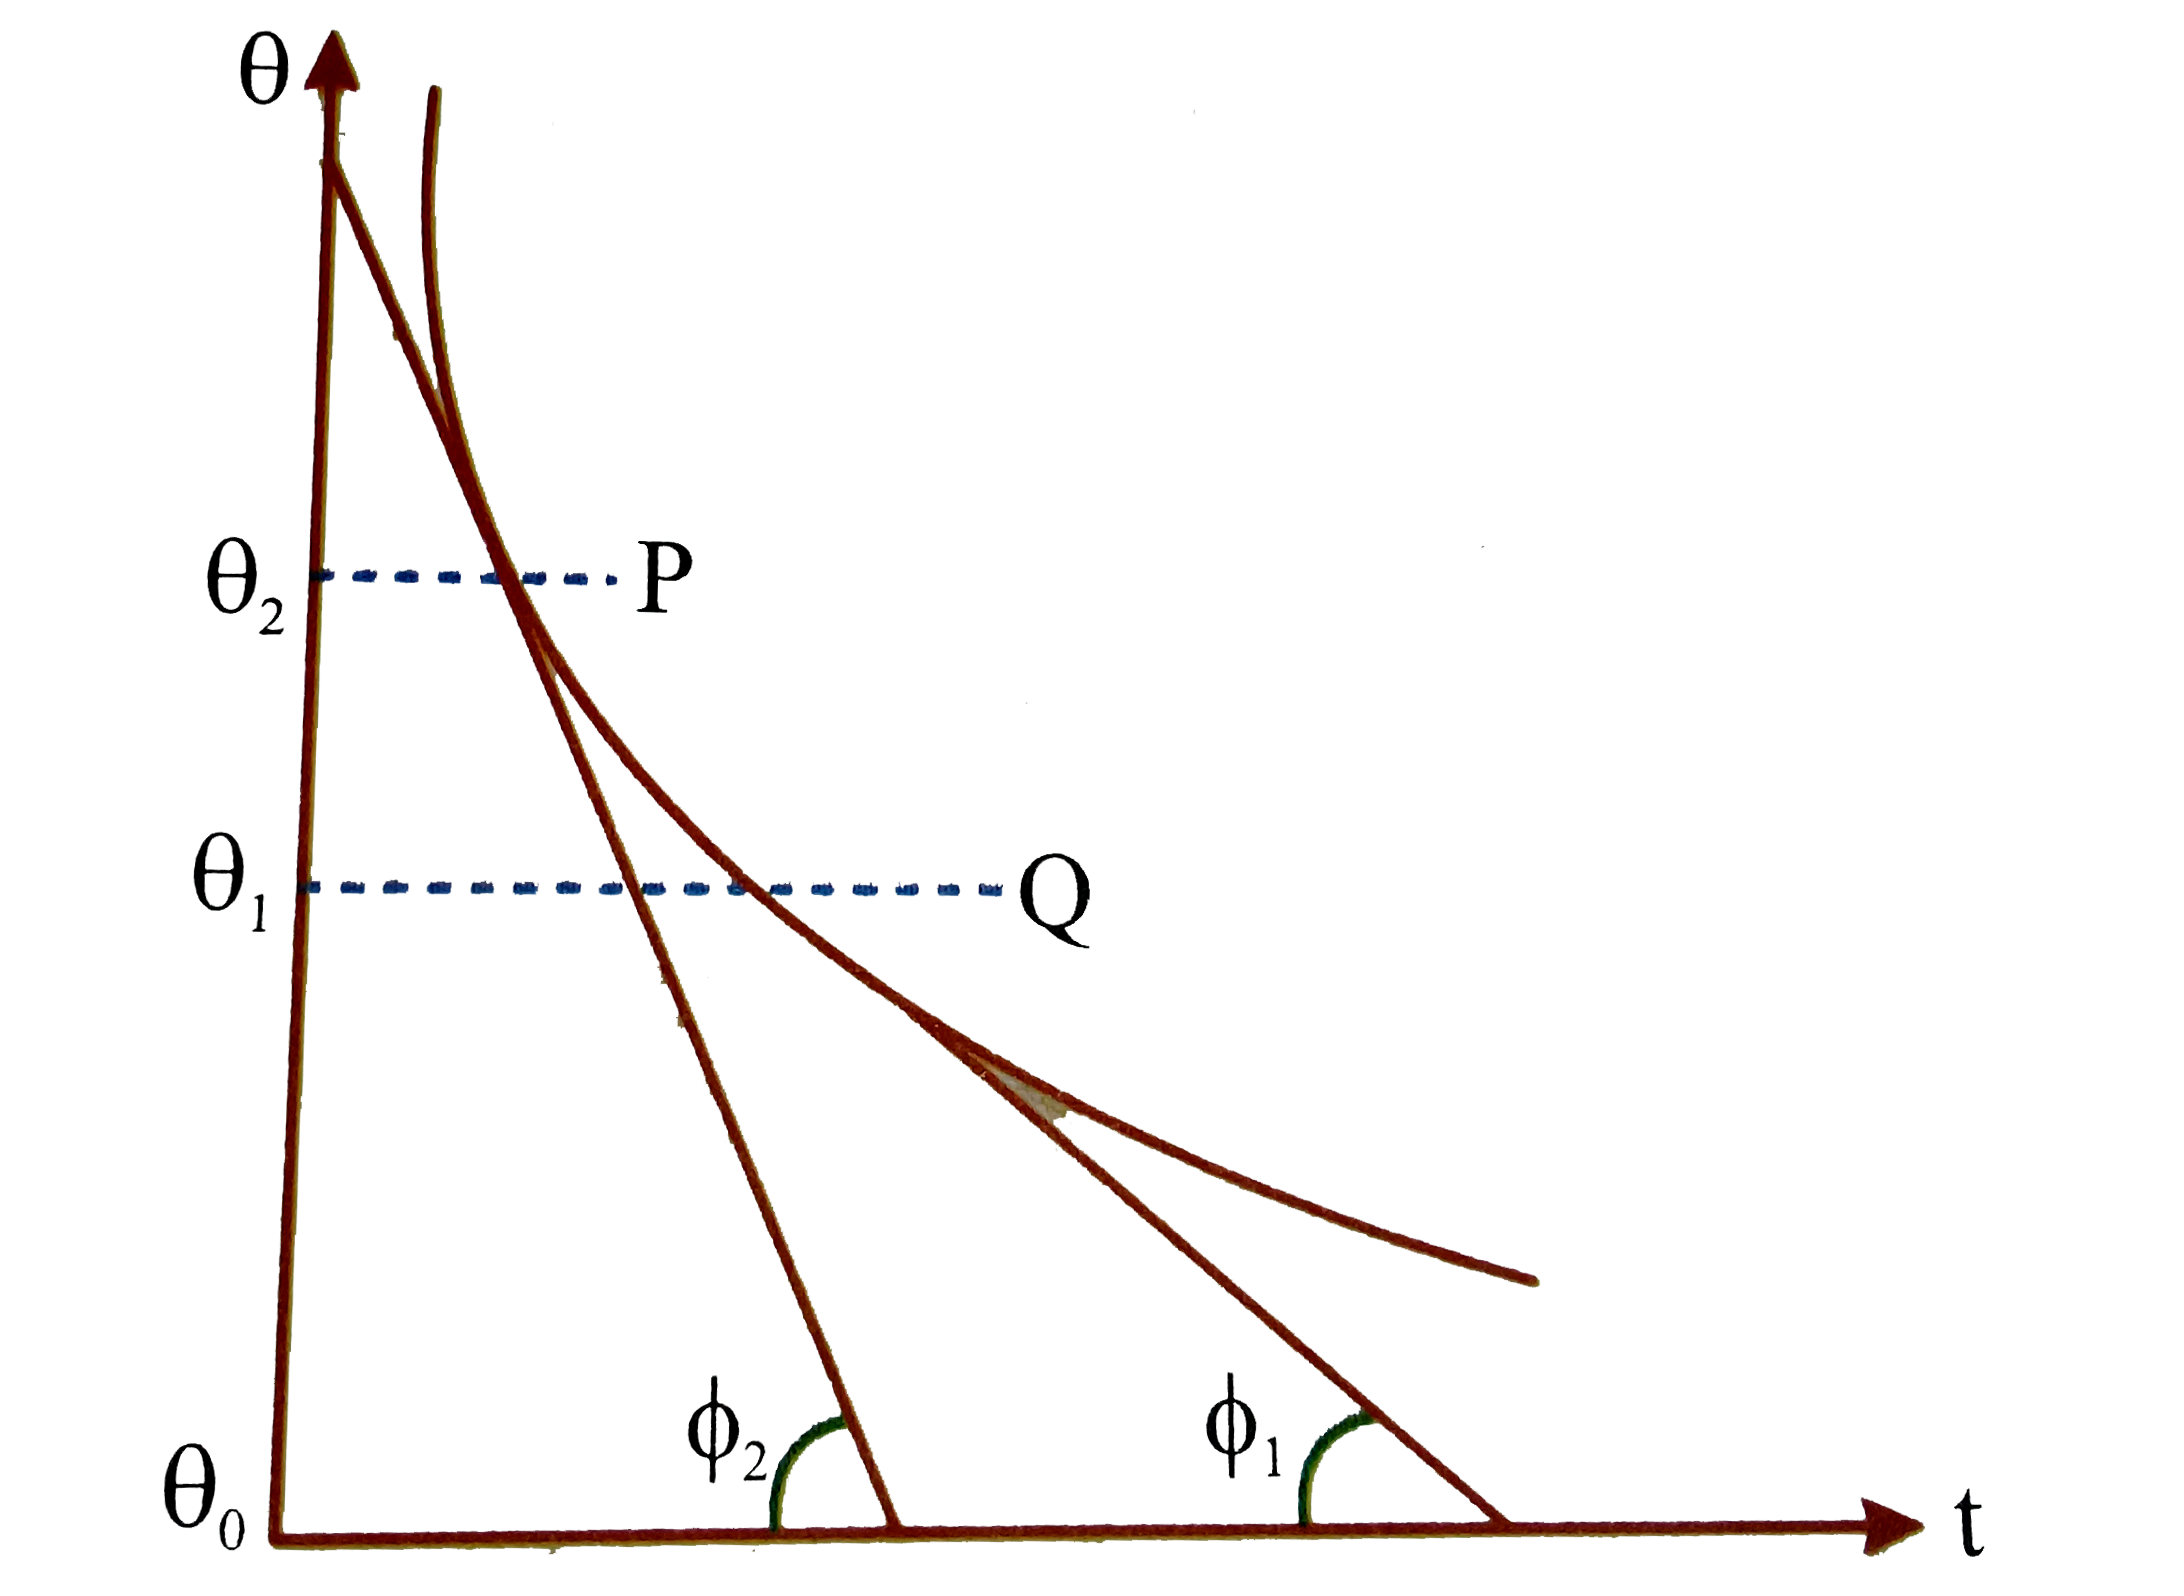
A body cools in a surrounding which is at a constant temperature of θ0 Assume that it obeys Newton's law of cooling Its temperature θ is plotted against time t Tangents are drawn to the curve at the points P(θ=θ1) and Q(θ=θ2) These tangents meet the time axis at angle of ϕ2 andϕ1 as shown
 .Atanϕ2tanϕ1=θ1−θ0θ2−θ0Btanϕ2tanϕ1=θ1−θ0θ2−θ0Ctanϕ2tanϕ1=θ1−θ0θ2−θ0Dtanϕ2tanϕ1=θ1−θ0θ2−θ0
In Newton's law of cooling dθdt=−k(θ−θ0) the constant k is proportional to .
AA: surface of the bodyBS in the specific heat of the bodyC1m being the mass of the bodyDe is the emissivity of the body
A hot body placed in a surrounding of temperature θ0 obeys Newtons's law of cooling dθ/dt=−k(θ−θ0). Its temperature at t=0 is θ1. The specific heat capacity of the body is s and its mass ism.
Find
(a) the maximum heat that the body can lose and
(b) the time starting from t=0 in which it will lose 90% of this maximum heat.
View SolutionAccording to Newton’s law of cooling. The rate of loss of heat, −dθ/dtof the body is
View SolutionA body cools in a surrounding which is at constant temperature of θ0. Assume that it obeys Newyon's law of colling. Its temperature θ is plotted against time t. Tangents are drawn to the curve at the points P(θ=θt) and Q(θ=θ2). These tangents meet the time axis at angles of ϕ2 and ϕ1, as shown

View SolutionNewton's law of cooling holds good provided the temperature difference between the body and the surroundings is .
View SolutionAssertion: According to Newton's law of cooling, the rate of loss of heat, −dQ/dt of the body is directly proportional to the difference of temperature.
Reason :This law holds for all type of temperature differences.
View Solution
