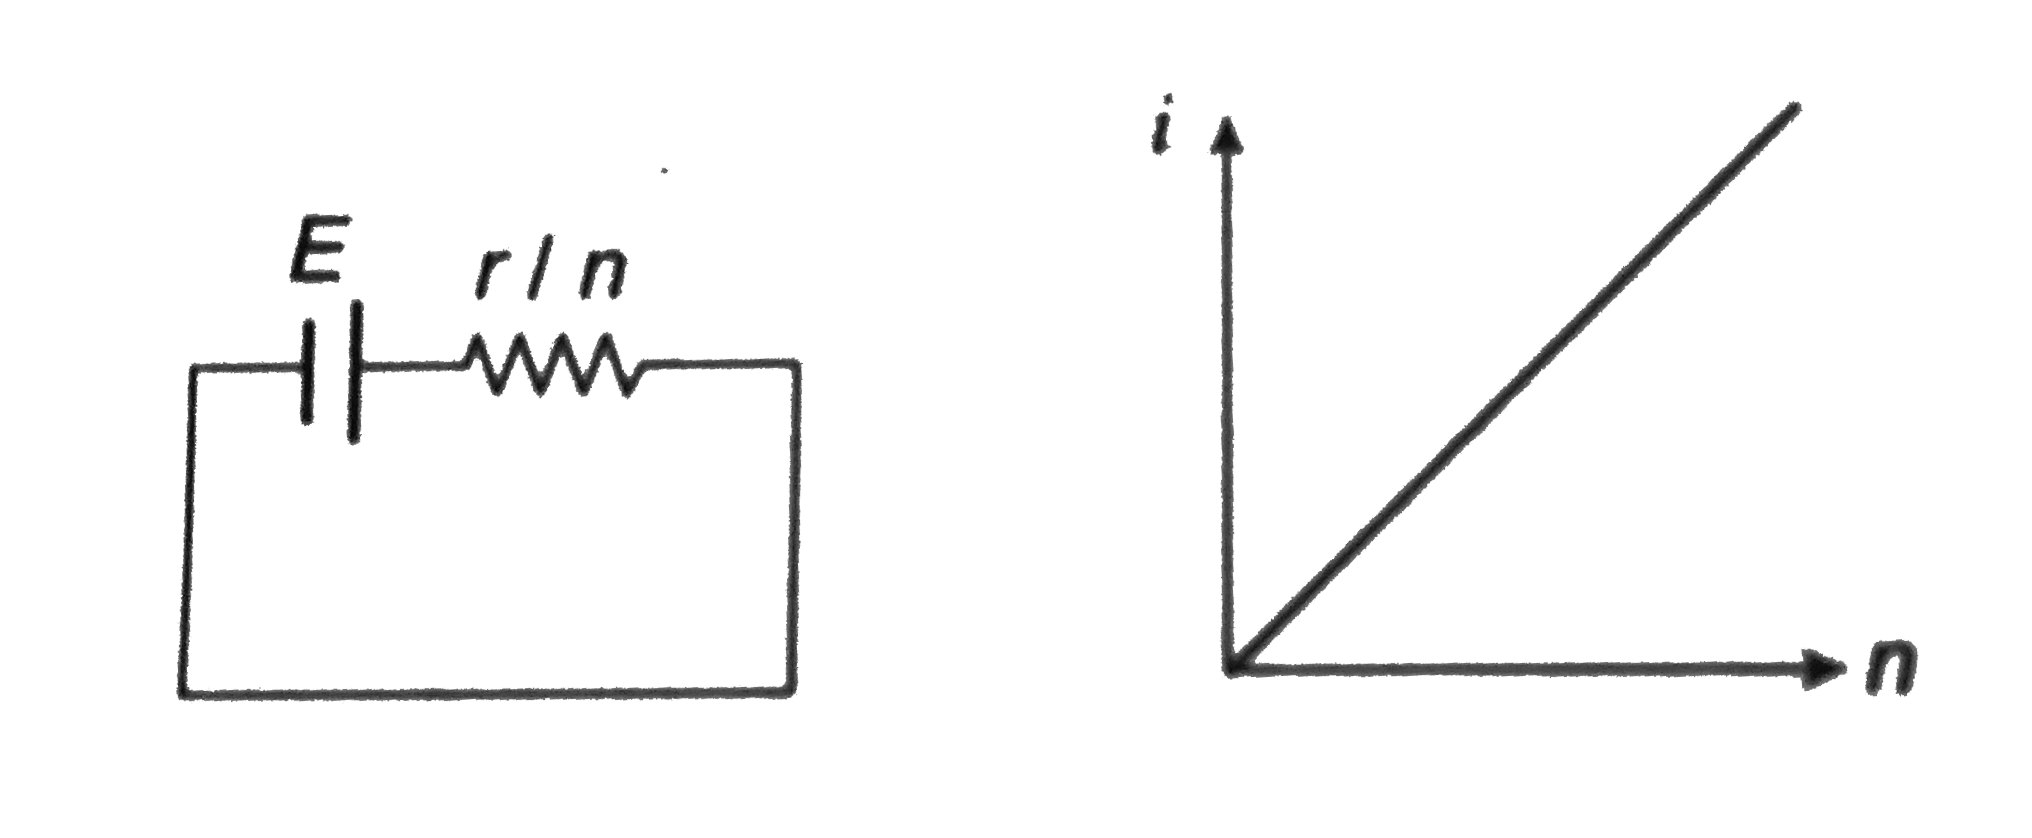
In previous problem, if the cell had been connected parallel (instead of in series) Which of the above graphs would have shown the relationship between total current I and n?
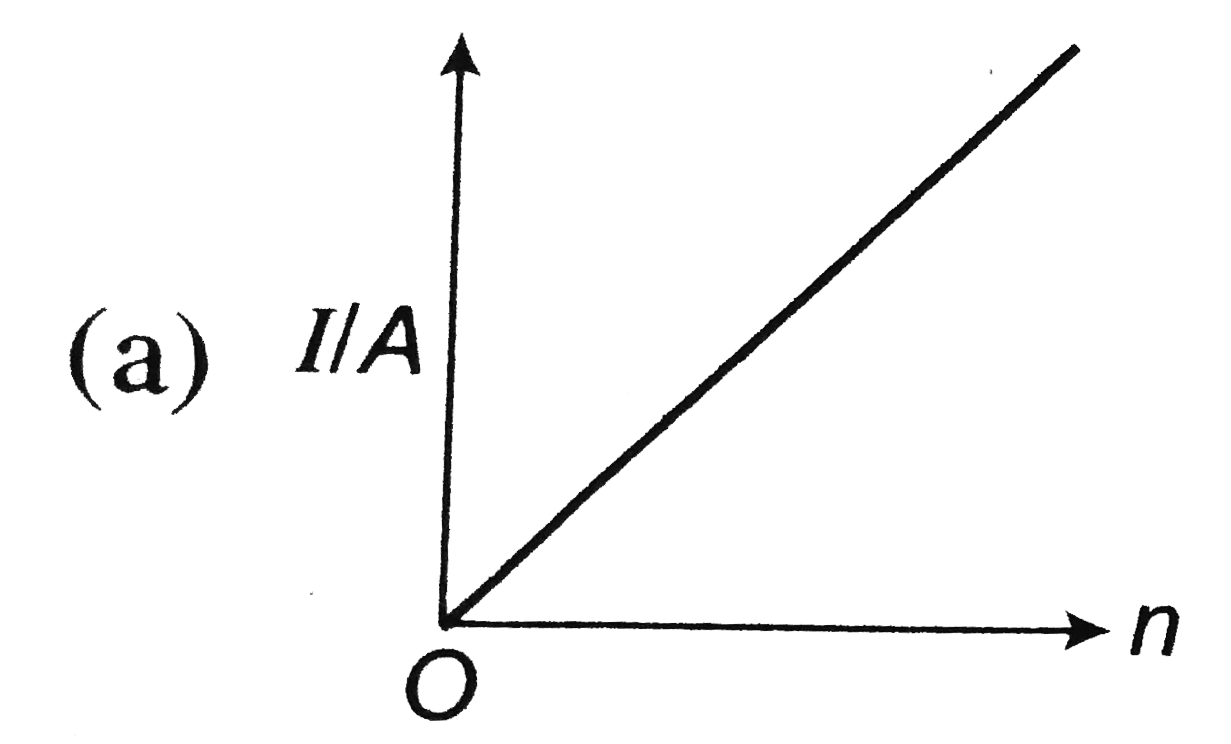
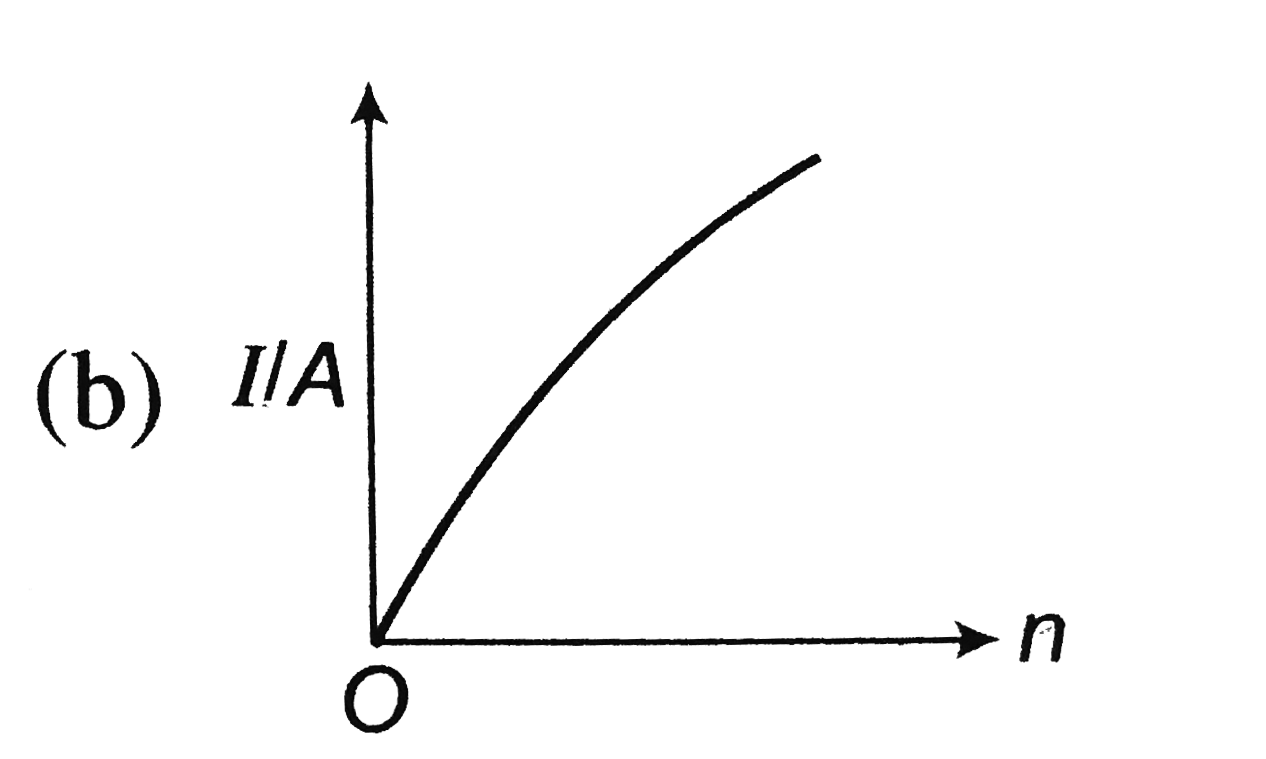
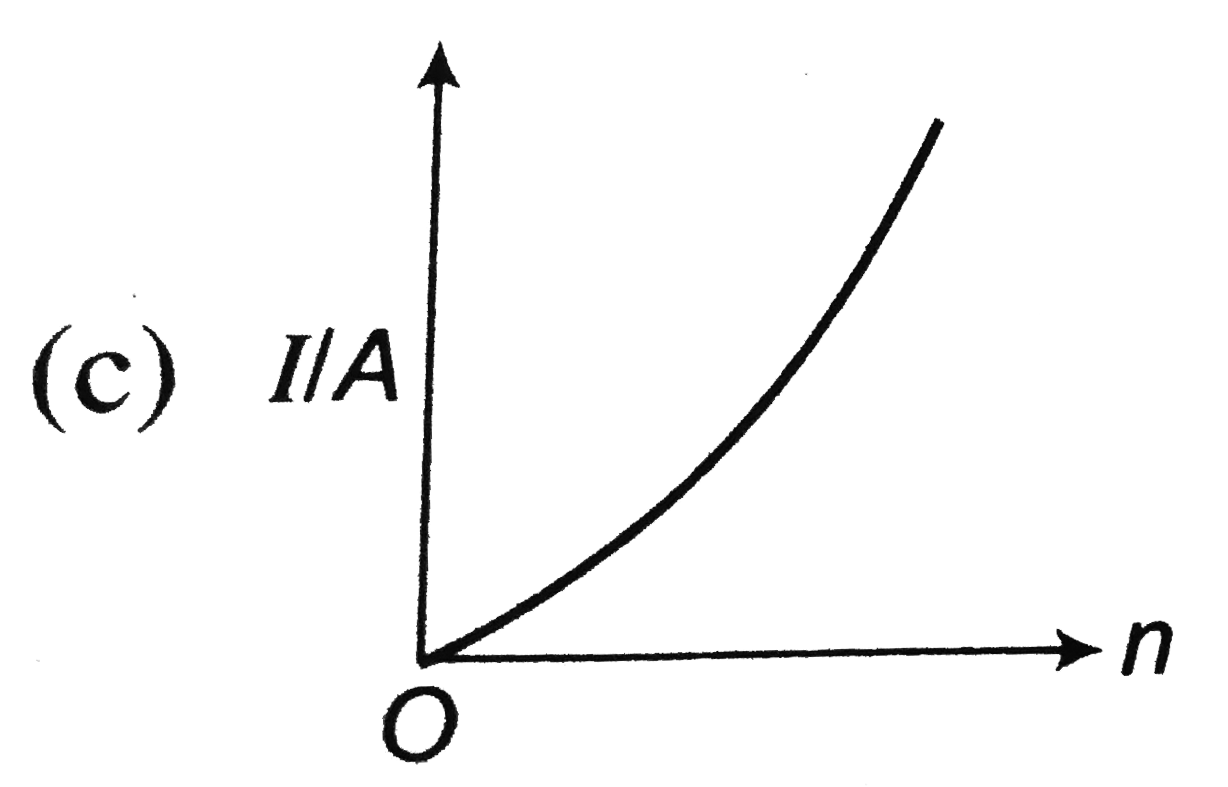
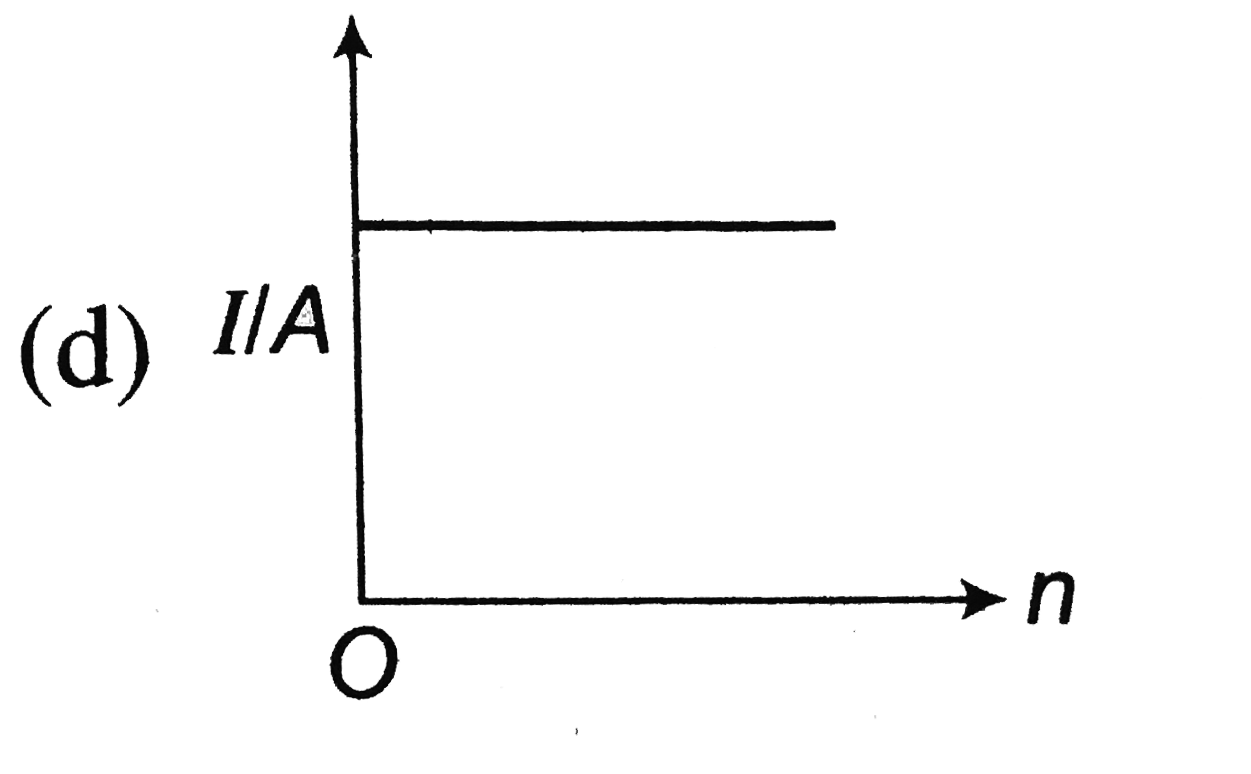
The correct Answer is:A
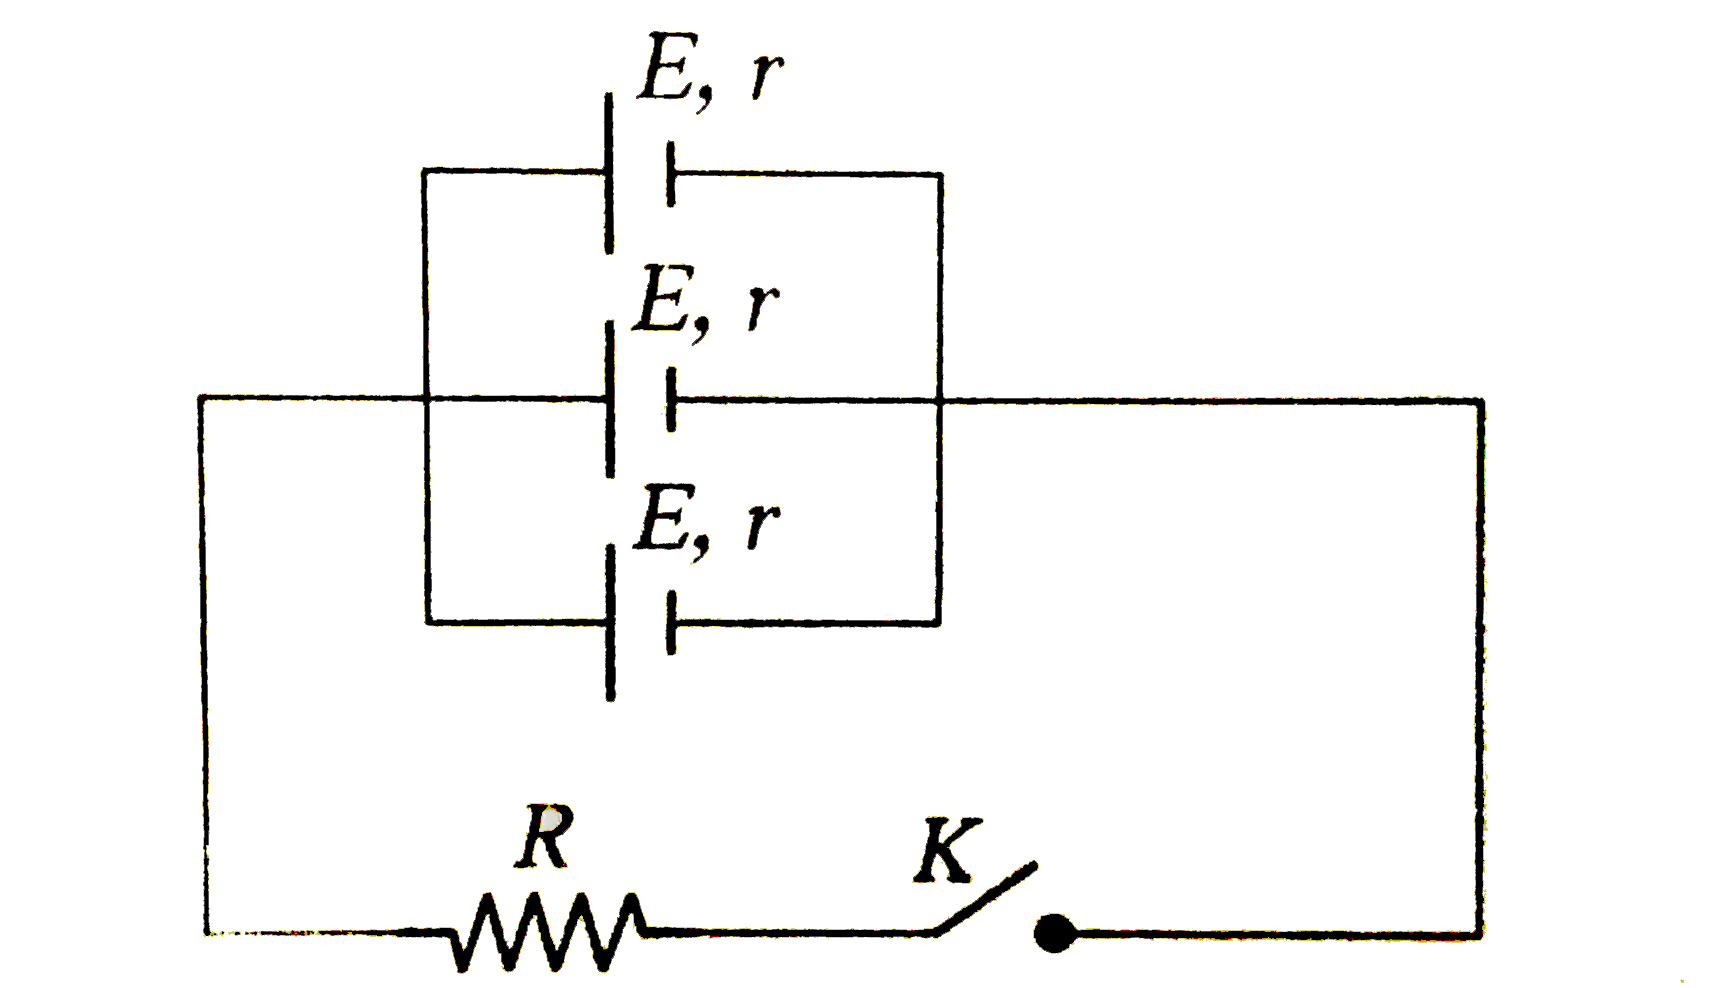
(a) If n batteries are in parallel than the circuit can be made as i=nEr
i is directly proportional to n.
Topper's Solved these Questions
- BOOK - A2ZCHAPTER - CURRENT ELECTRICITYEXERCISE - R-C Circuits17videos
CURRENT ELECTRICITY
- BOOK - A2ZCHAPTER - CURRENT ELECTRICITYEXERCISE - Ammeter And Voltmeter41videos
CURRENT ELECTRICITY
- BOOK - A2ZCHAPTER - CURRENT ELECTRICITYEXERCISE - Combination And Resistivity38videos
CURRENT ELECTRICITY
- BOOK - A2ZCHAPTER - ATOMIC PHYSICSEXERCISE - Section D - Chapter End Test30videos
ATOMIC PHYSICS
- BOOK - A2ZCHAPTER - DUAL NATURE OF RADIATION AND MATTEREXERCISE - Section D - Chapter End Test30videos
DUAL NATURE OF RADIATION AND MATTER
Similar Questions
An equiring physics student connects a cell to a circuit and measures the current drawn from the cell to I1. When he joins a second identical cell is series with the first, the current becomes I2. When the cells are connected in parallel, the current through the circuit is I2. When the cells are connected are in parallel, the current through the circuit is I3. Show that relation between the current is 3I3I2=2I1(I2+I3).
View Solution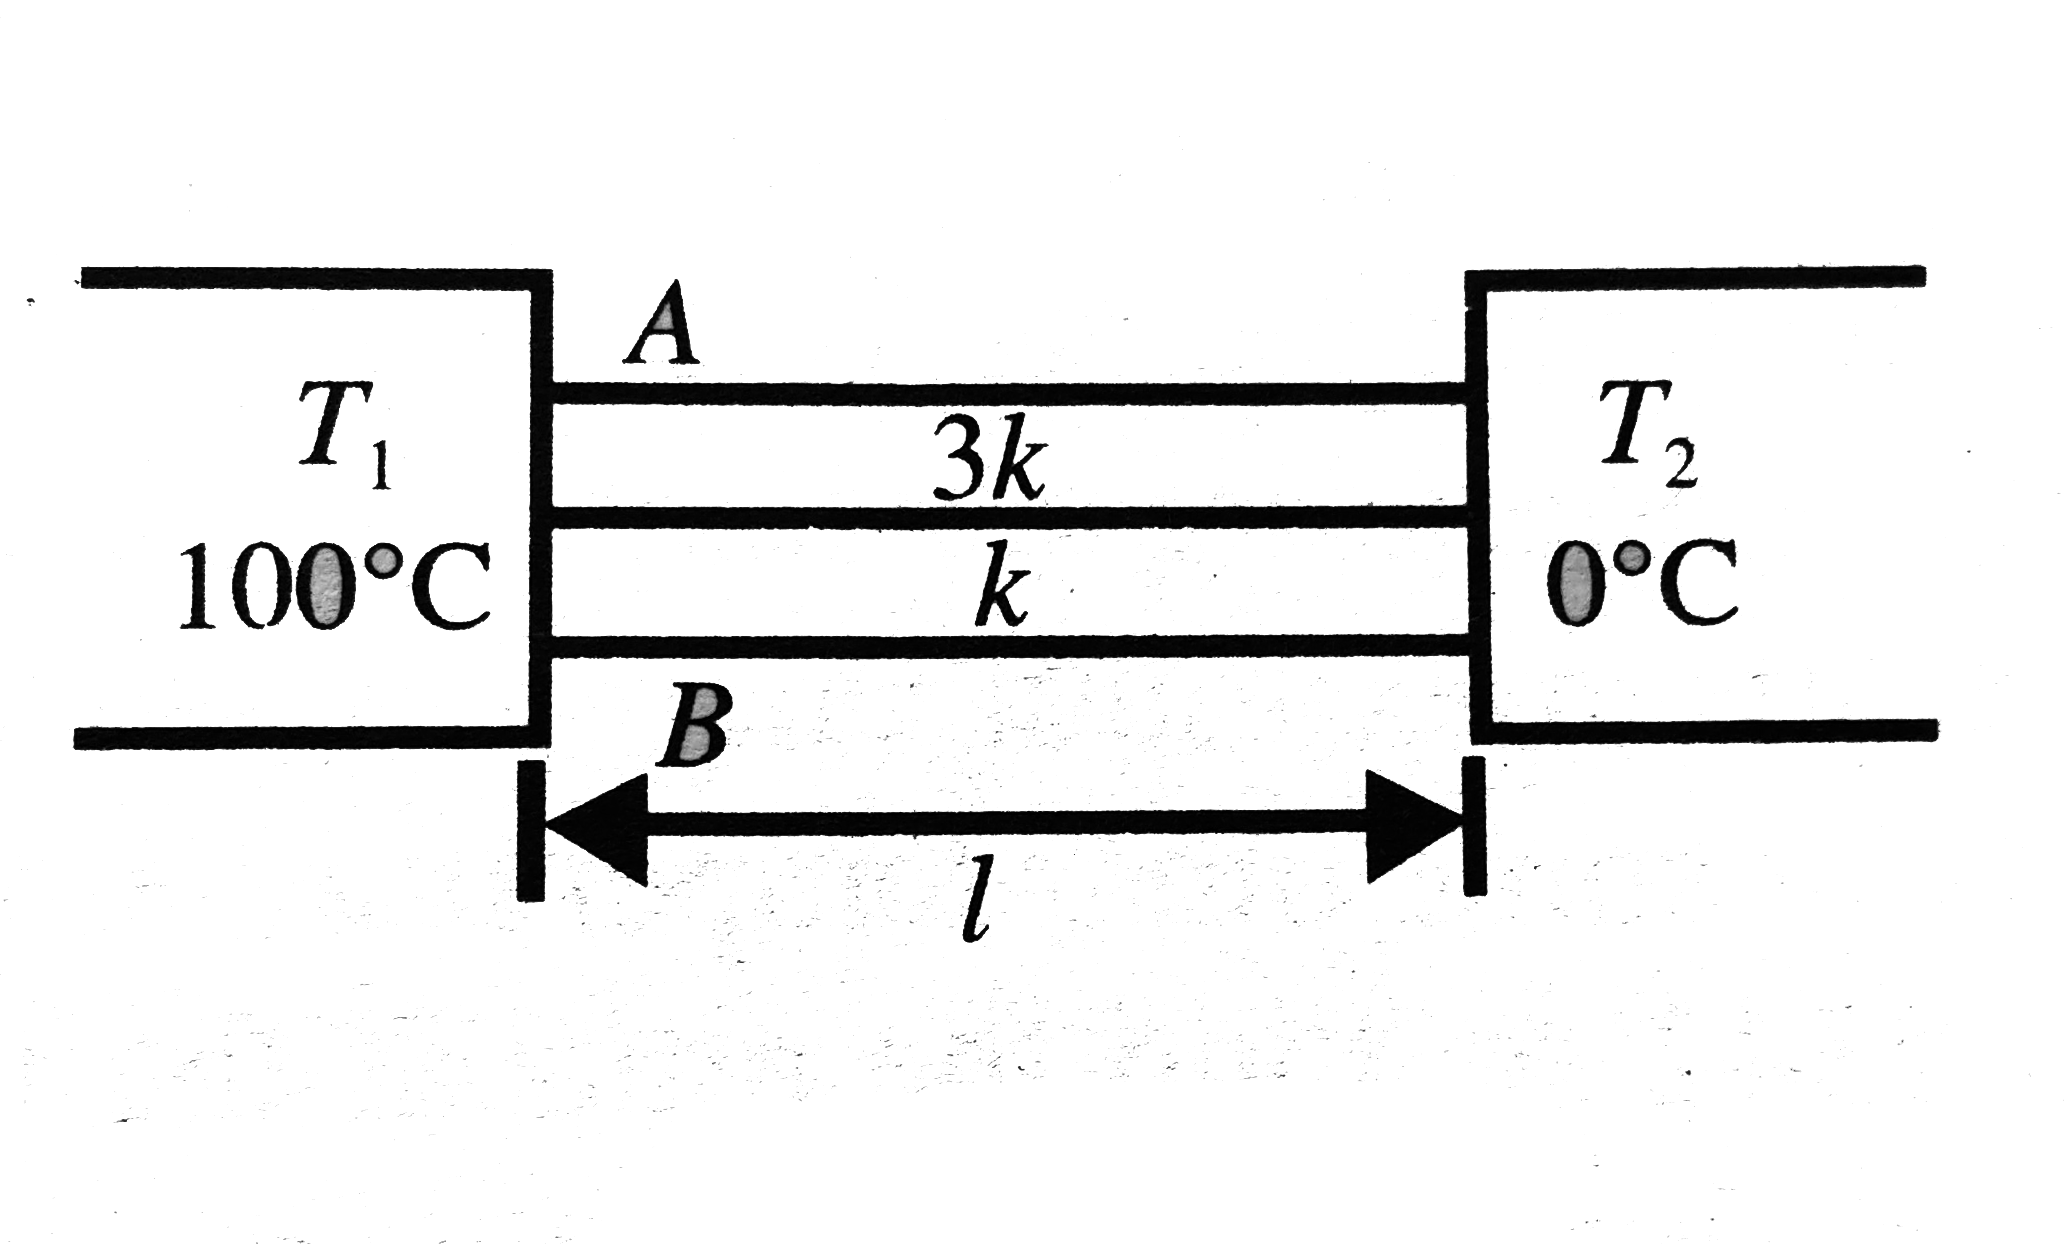
Two conductors A and B given in previous problem are connected in parallel as shown in Fig.
i. Determine the equivalent thermal resistance.
ii. Determine the heat current in each rod.View Solution
Knowledge Check
- Question 1 - Select One
If a variable resistance is connected to a cell of constant e.m.f., then which one of the following grphs represnets the relationship between current I and resistanc R?
A B
B C
C D
D
- Question 2 - Select One
A battery consists of a variable number n of identical cells having internal resistance connected in series. The terminals of the battery are short circuited and the current I measured. Which one of the graph below shows the correct relationship between I and n?
A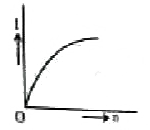 B
B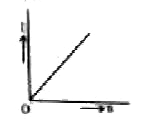 C
C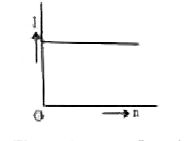 D
D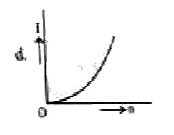
- Question 3 - Select One
A battery consists of a variable number n of identical cells having internal resistance connected in series. The terminals of the battery are short circuited and the current I measured. Which one of the graph below shows the correct relationship between I and n ?
A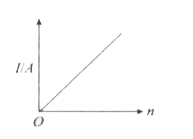 B
B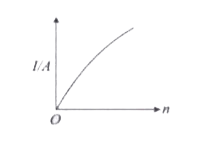 C
C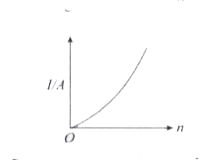 D
D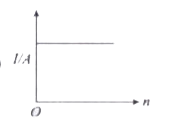
(a) The emf of a cell is E and its intenal resistance is r. Its terminals are connected to a resistance R. The potential difference between the terminal is 12V if R=3Ω and 16V if R=8Ω. Find the values of E and r
(b) When an unknown resistance is connected across a series combination of two identical cells, each of 18V, current through the resistance is 4A. When it is connected across a parallel combination of the same cells, the current through it is 3A. Find the unknown resistance and internal resistance of each cell.
( c) p identical cells, each of emf E and internal resistance r, are joined in series to form a closed circuit. One cell (X) is joined with reversed polarity. Find the potential difference across each cell except X and also across X.
(d) 12 cells each having the same emf are connected in series and are kept in a closed box. Some of the cells are wrongly connected. This battery is connected in series with an ideal ammeter and two cells of same emf as of 12 cells. The current is 3A when the cells and the battery aid each other and 2A when the cells and battery oppose each other. How many cells in the battery are wrongly connected ?View SolutionA battery consists of a variable number n of identical cells having internal resistance connected in series. The terminals of the battery are short circuited and the current I measured. Which one of the graph below shows the correct relationship between I and n?
View SolutionWhen n cells are joined in parallel combination as shown, the strength of the current i is given by
 View Solution
An AC source of variable frequency f is connected to an LCR series circuit. Which one of the graphs in figure represents the variation of current of current I in the circuit with frequency f?
View SolutionWhich of the graphs shown in the figure below best represents the relationship between the radioactive decay rare [−(dN/dt)] and population N?
View Solution

