In the following speed-time graph (Fig. 2.10), the shaded portion gives 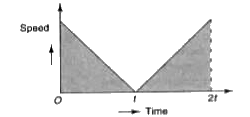
A
distance travelled
B
average speed
C
average velocity
D
displacement travelled
Video Solution
Text Solution
The correct Answer is:A
Area under speed-tme graph represents distance travelled by the body.
|
Topper's Solved these Questions
- MOTIONBOOK - MCGROW HILL PUBLICATIONCHAPTER - MOTIONEXERCISE - HIGHER ORDER THINKING QUESTIONS
48 Videos
- MISCELLANEOUS QUESTIONSBOOK - MCGROW HILL PUBLICATIONCHAPTER - MISCELLANEOUS QUESTIONSEXERCISE - PART-B
99 Videos
- REFLECTION OF LIGHT BOOK - MCGROW HILL PUBLICATIONCHAPTER - REFLECTION OF LIGHT EXERCISE - HIGHER ORDER THINKING QUESTIONS
10 Videos
Similar Questions
Knowledge Check
Which of the following speed-time graphs is not possible:
A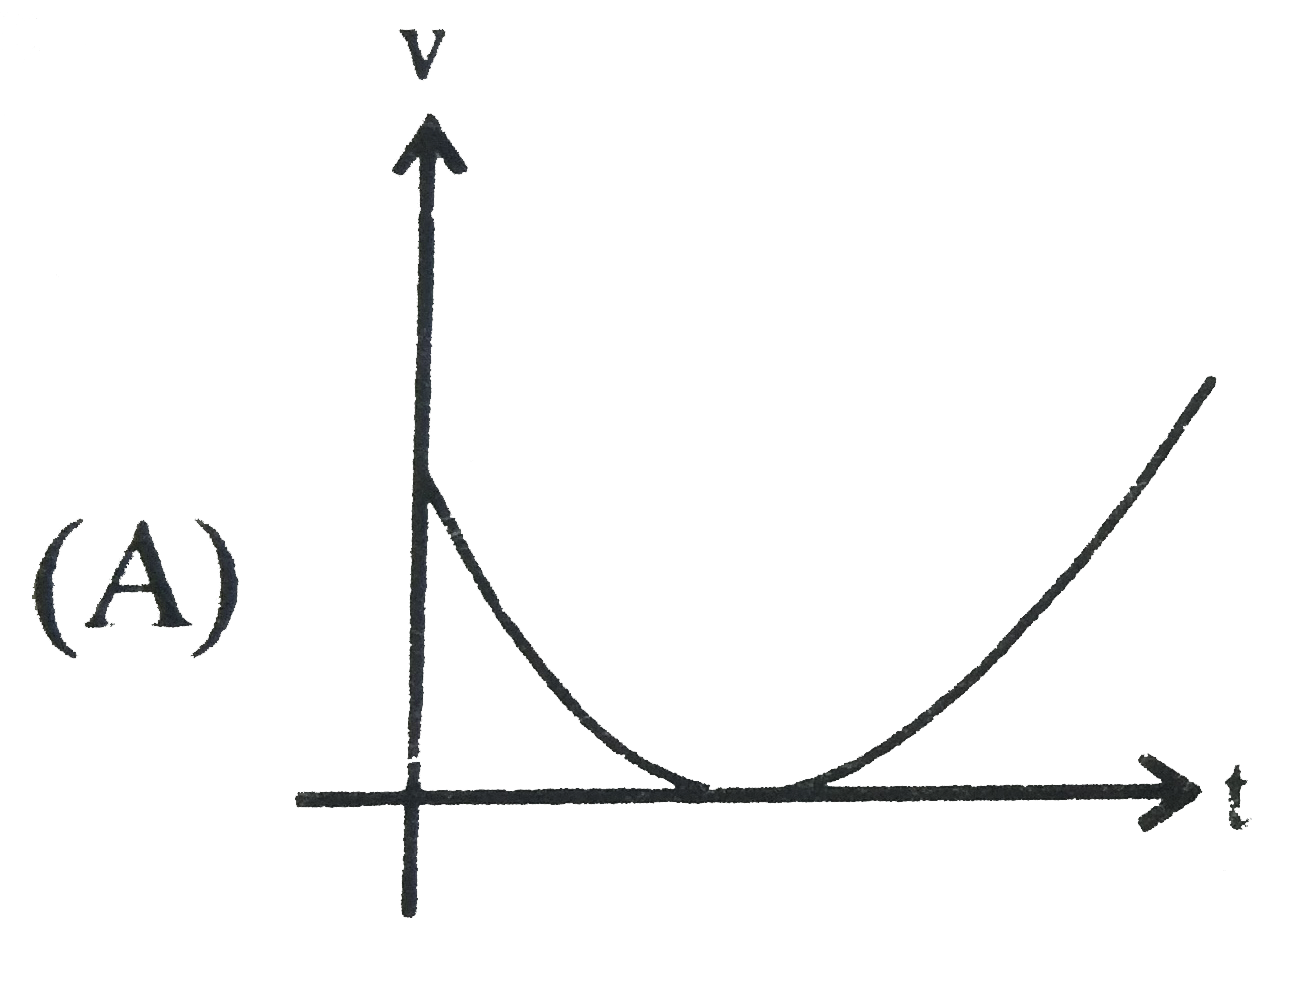 B
B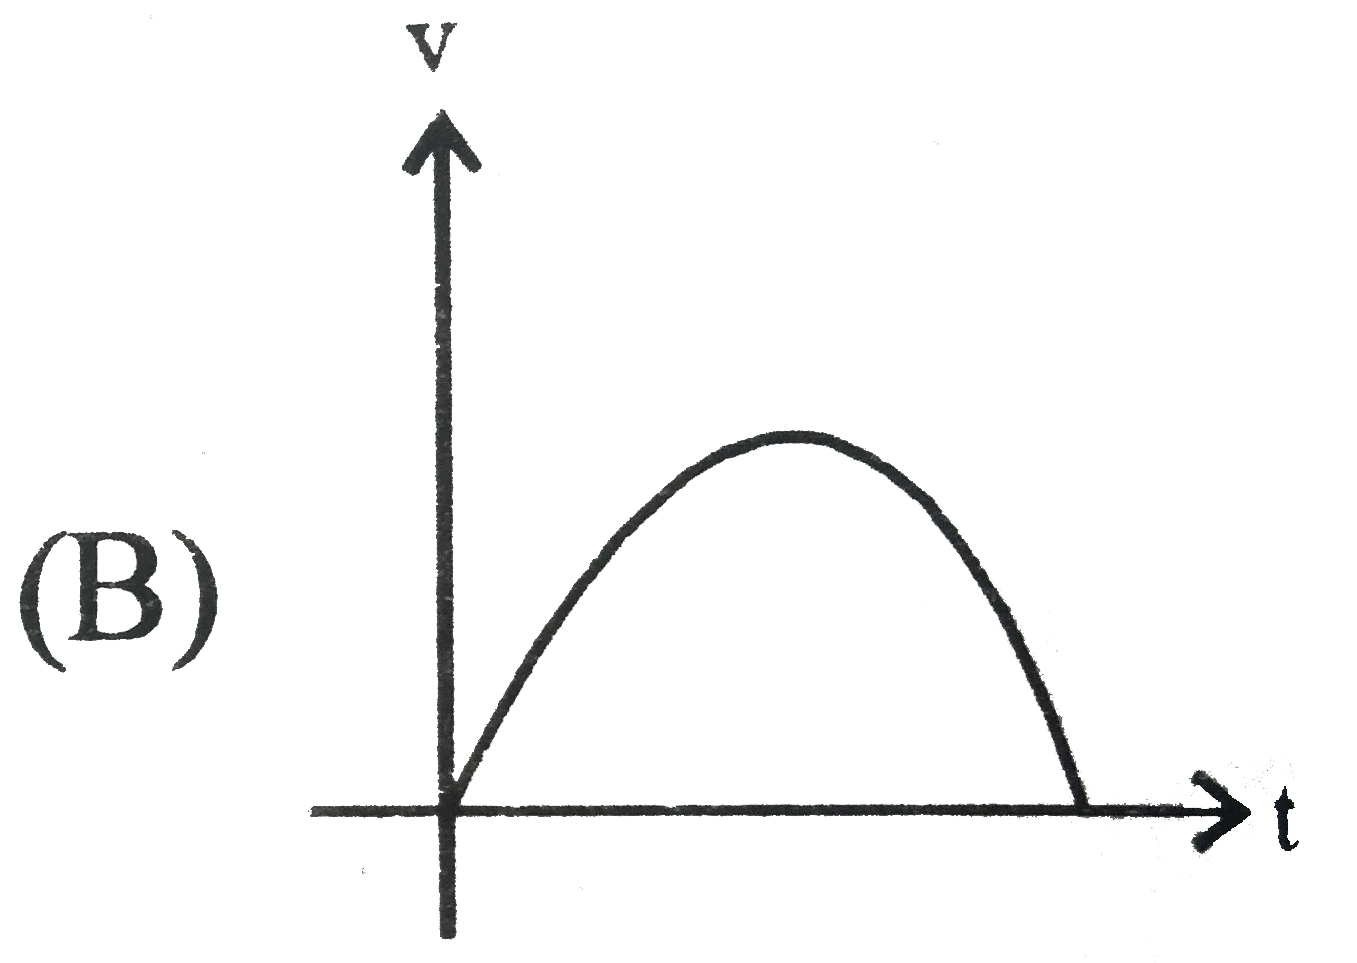 C
C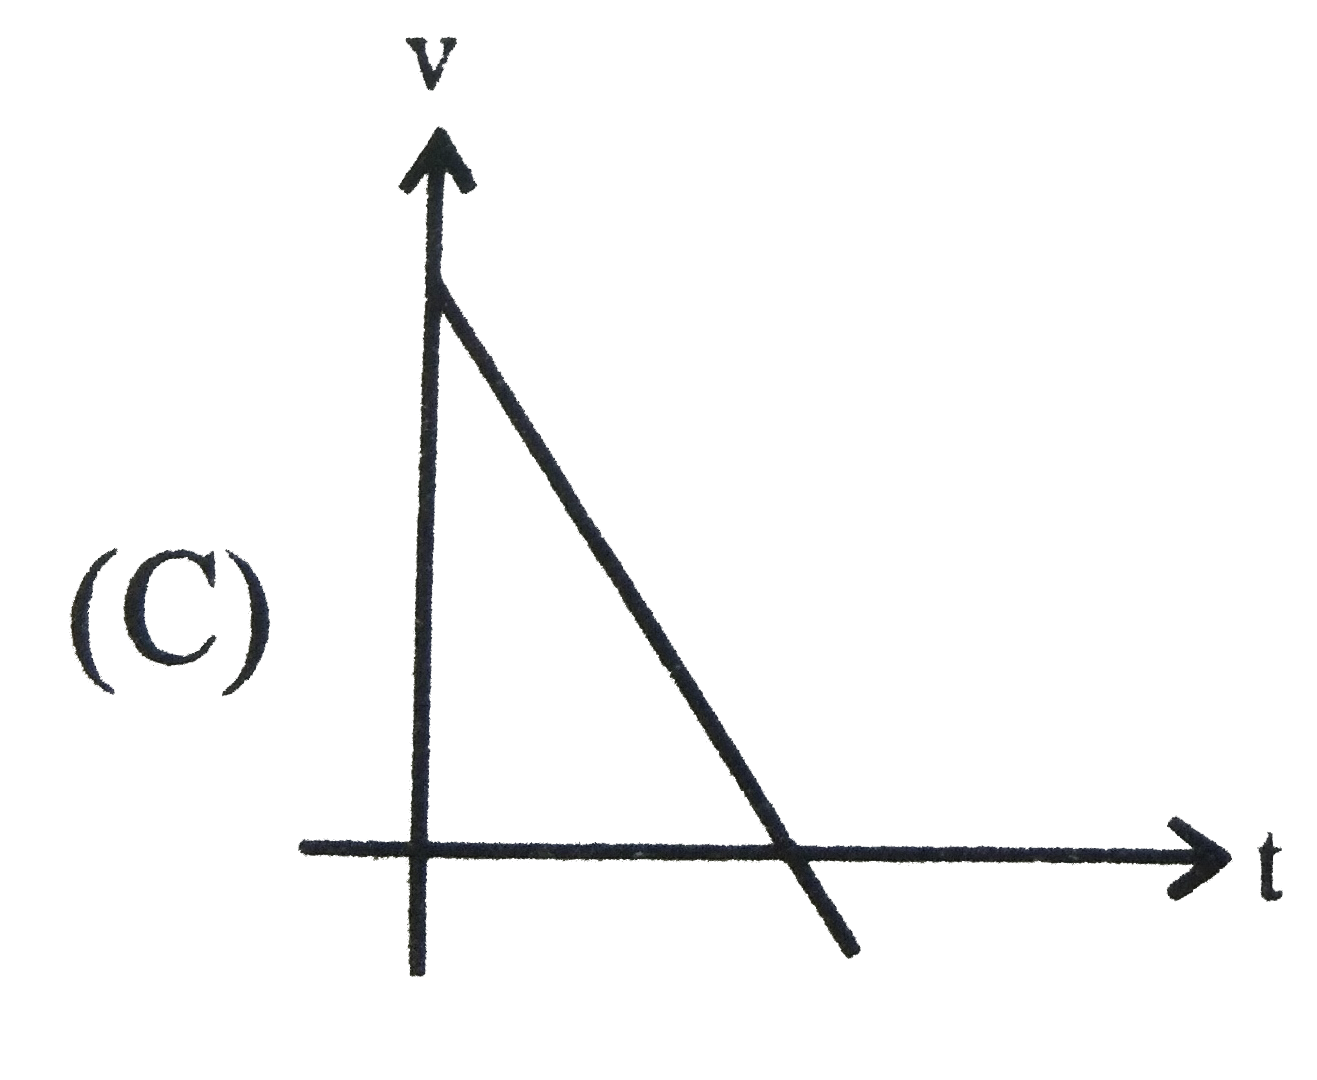 D
D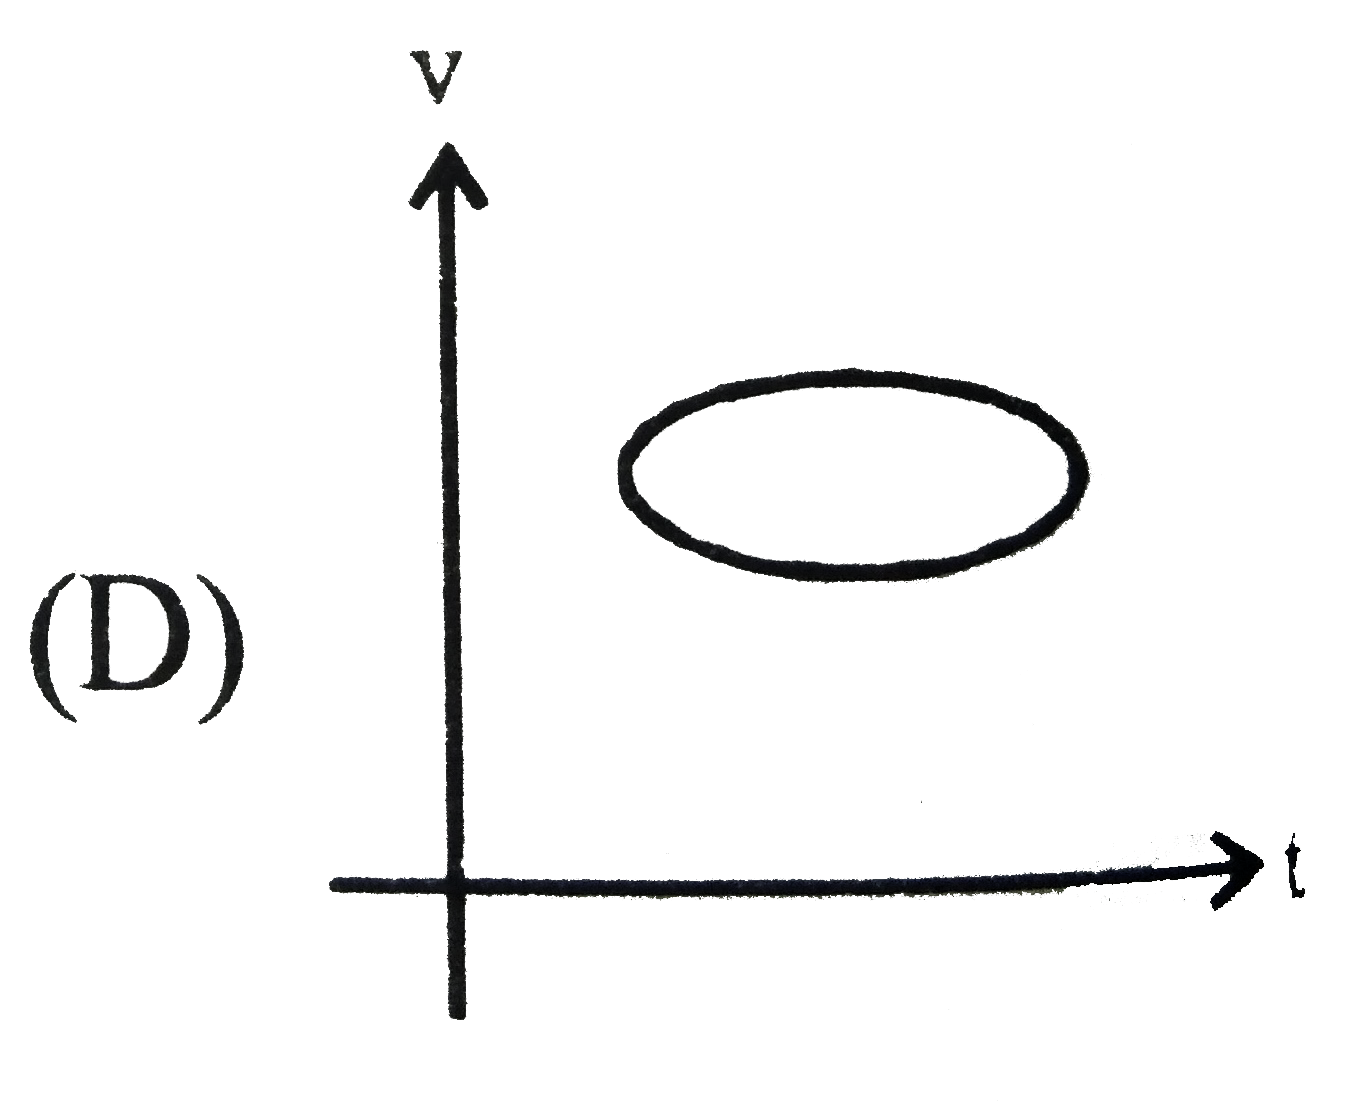
For a particle in motion which of the following speed-time graphs can be realized in practice :
 AA,C and D onlyBA and D onlyCA,B and D onlyDA only
In the following graph (Fig. 2.4) of displacement versus time,
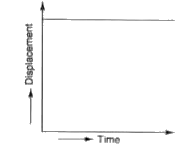 Athe body is at restBthe body has some initial speedCthe body moves with sonstant speedDthe body moves with constant velocity
Which of the following speed - time (v - t) graphs is physically not possible?
View SolutionWhich of the following speed - time (υ−t) graph is physically not possible ?
View SolutionVelocity-time graph AB (Fig. 2.2) show that the body has
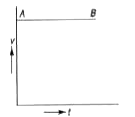
View SolutionWhich of the following cannot be speed-time graph of a body in motion?
View SolutionThe speed -time graph of the ball in the above situation is.
View Solution

