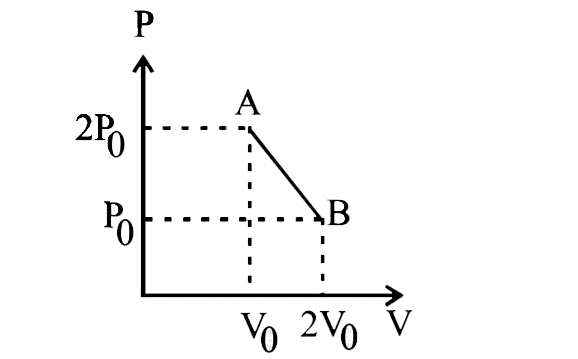
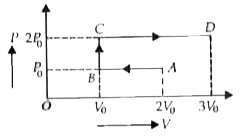
p-V diagram of an ideal gas for a process ABC is as shown in the figure. 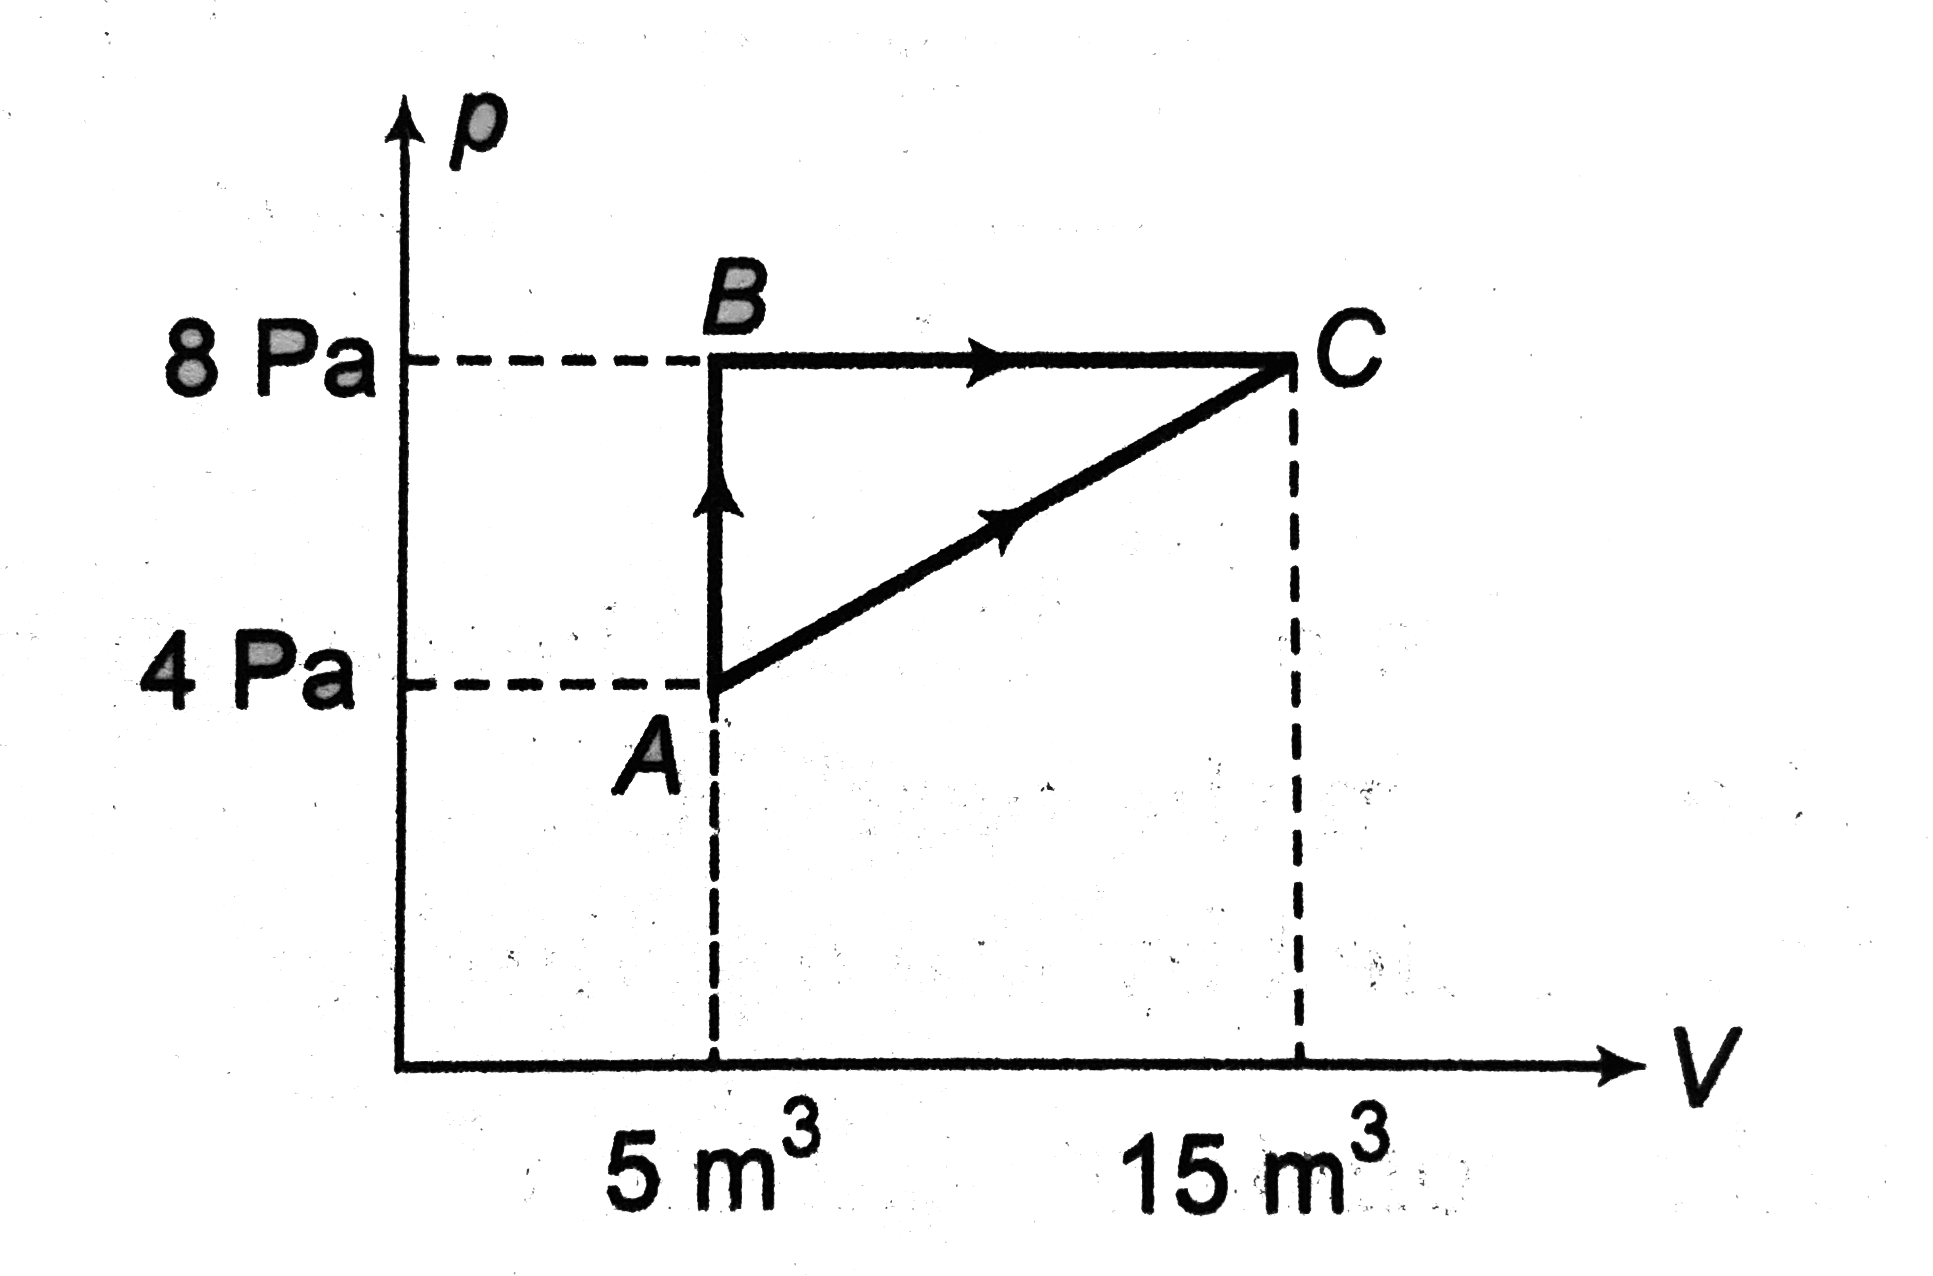
(a) Find total heat absorbed or released by the gas during the process ABC.
(b) Change in internal energy of the gas during the process ABC.
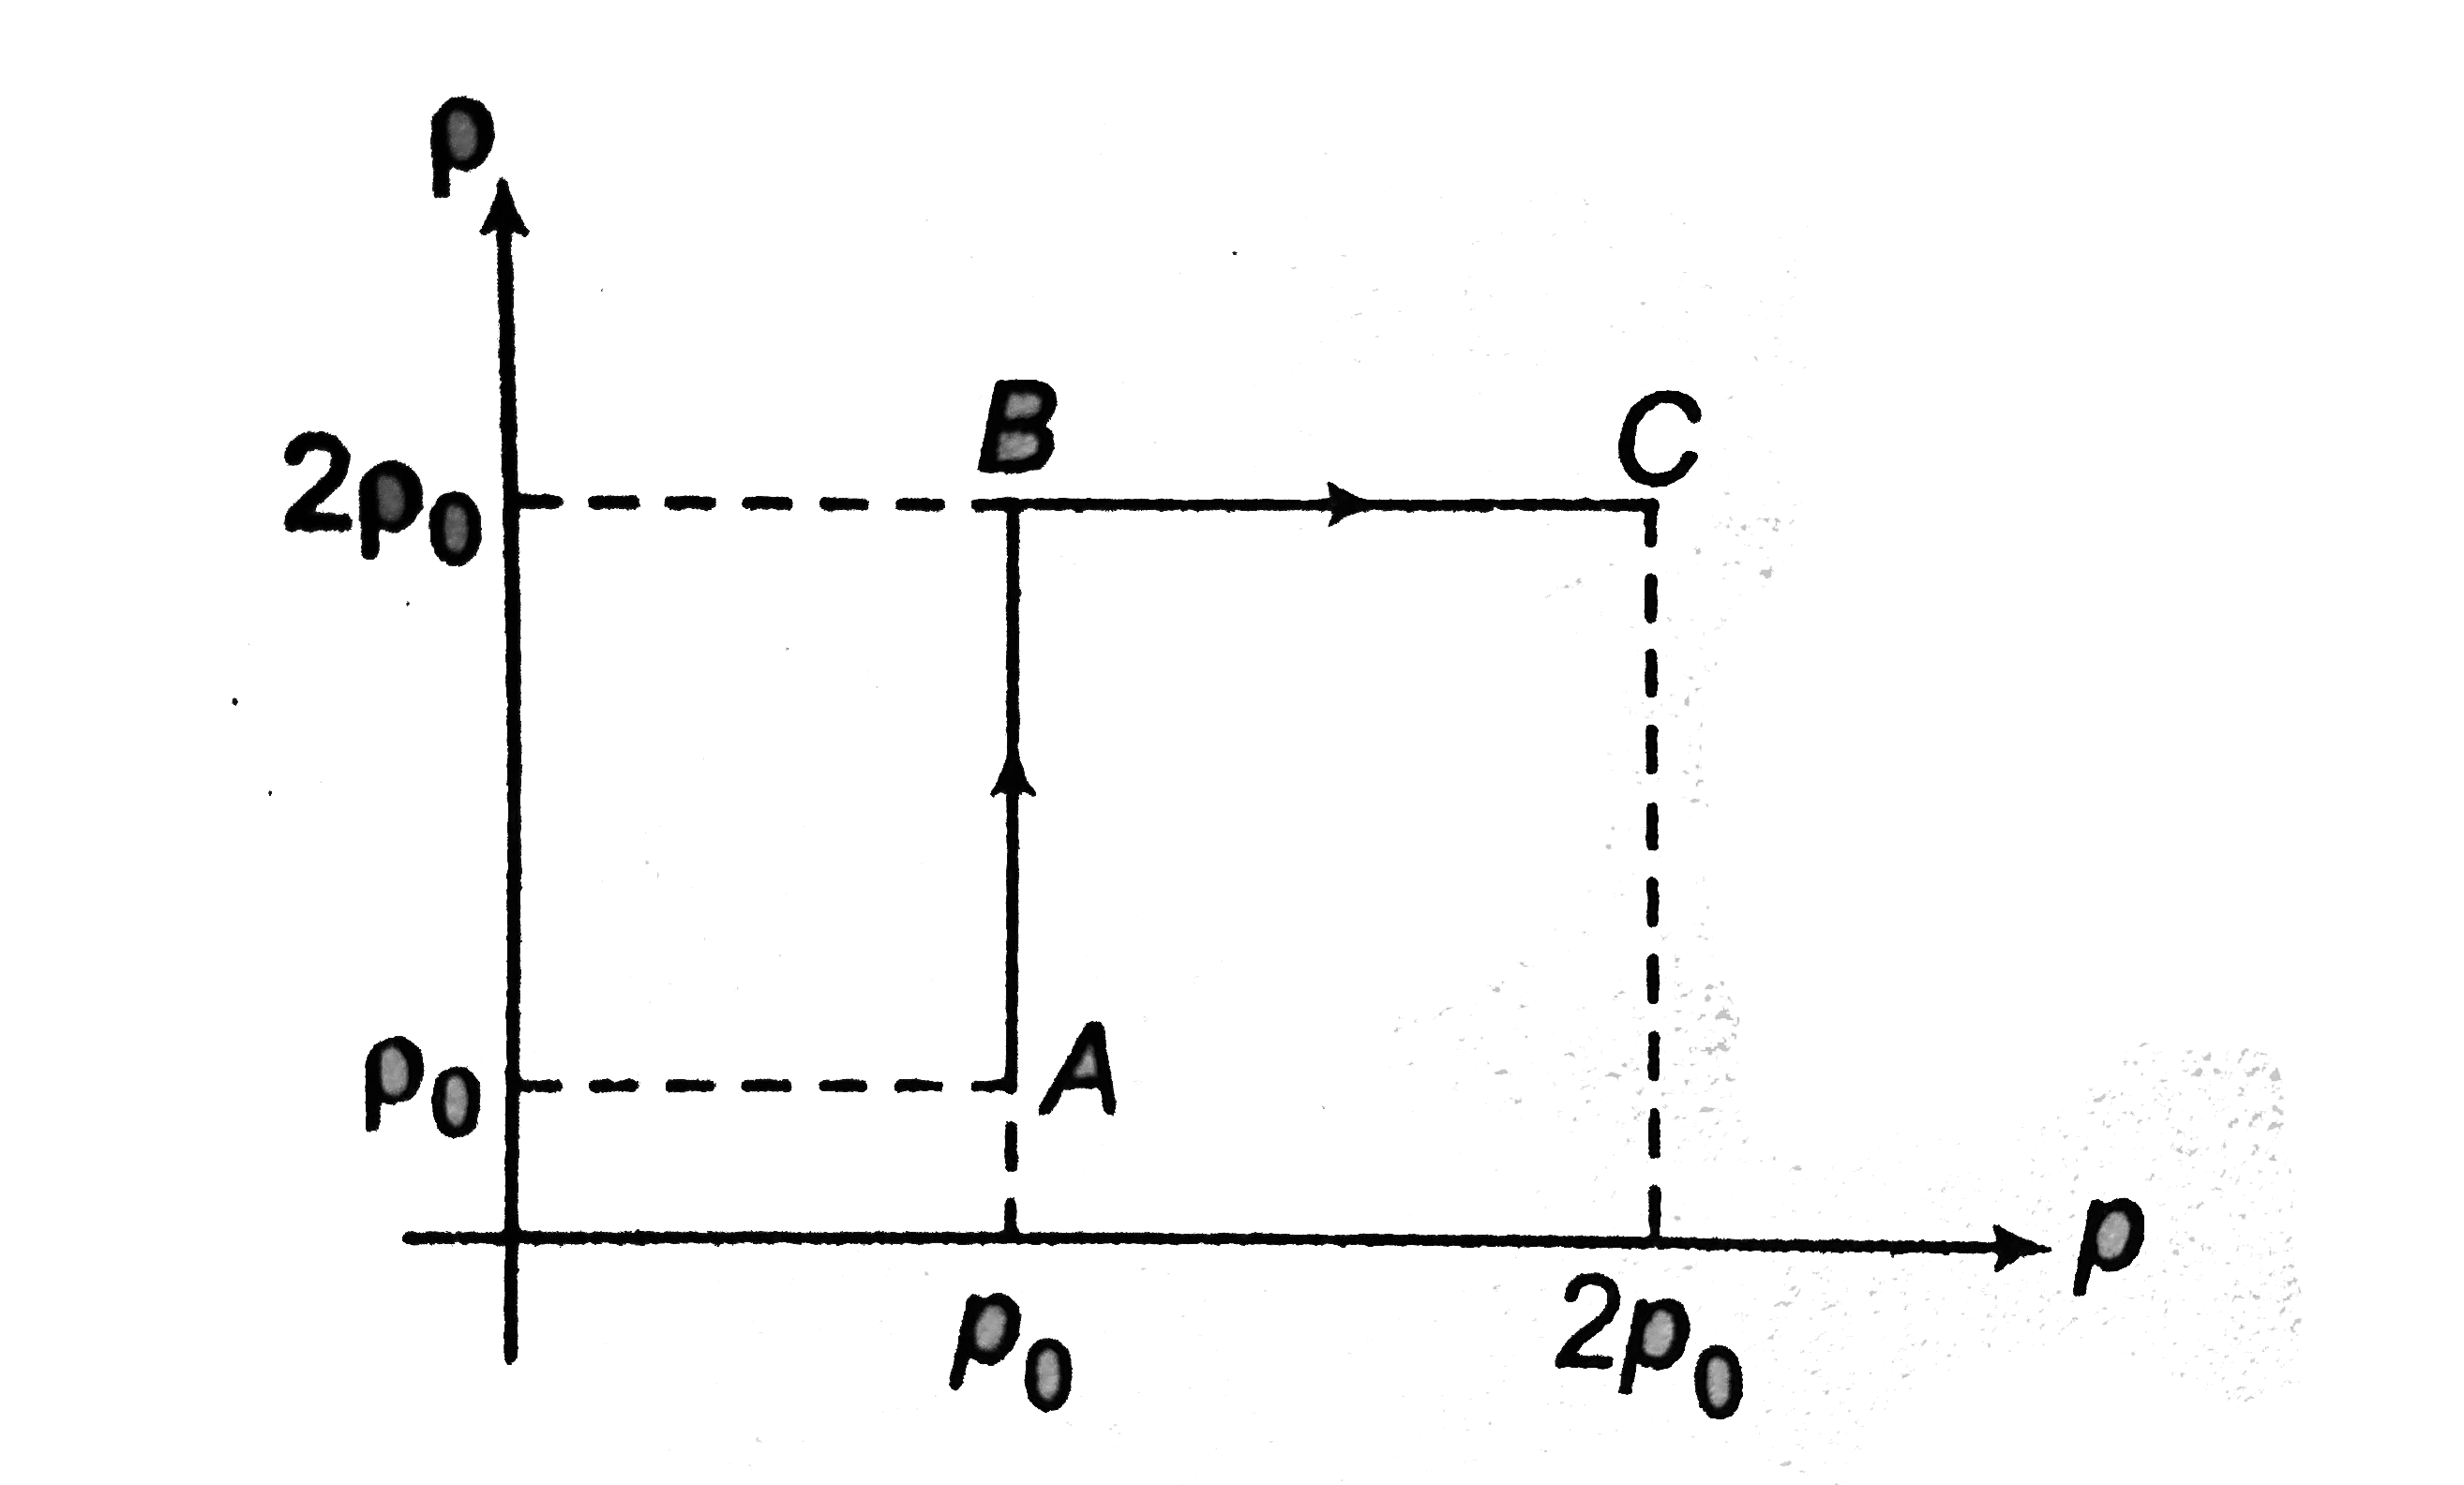
(c) Plot pressure versus density graph of the gas for the process ABC.
Video Solution
Text Solution
The correct Answer is:A, B, C, D
(a) and (b)
or
Area under the graph
i.e. Heat is released during the process.
(c) Process AB
-p graph will be a straight line parallel to -axis because pressure is constant. Further, V is decreasing. Therefore, will increase.
Process BC
Therefore, -p graph is a straight line parallel to p-axis.
-p graph is as shown below.
|
Topper's Solved these Questions
- LAWS OF THERMODYNAMICSBOOK - DC PANDEYCHAPTER - LAWS OF THERMODYNAMICSEXERCISE - Level 2 Single Correct
27 Videos
- LAWS OF THERMODYNAMICSBOOK - DC PANDEYCHAPTER - LAWS OF THERMODYNAMICSEXERCISE - Level 2 More Than One Correct
6 Videos
- LAWS OF THERMODYNAMICSBOOK - DC PANDEYCHAPTER - LAWS OF THERMODYNAMICSEXERCISE - Level 1 Objective Questions
1 Videos
- LAWS OF MOTIONBOOK - DC PANDEYCHAPTER - LAWS OF MOTIONEXERCISE - Medical entrances gallery
39 Videos
- MAGNETIC EFFECT OF CURRENT AND MAGNETISMBOOK - DC PANDEYCHAPTER - MAGNETIC EFFECT OF CURRENT AND MAGNETISMEXERCISE - Integer type Questions
10 Videos
Similar Questions
Knowledge Check
Find the work done by the gas in the process ABC.
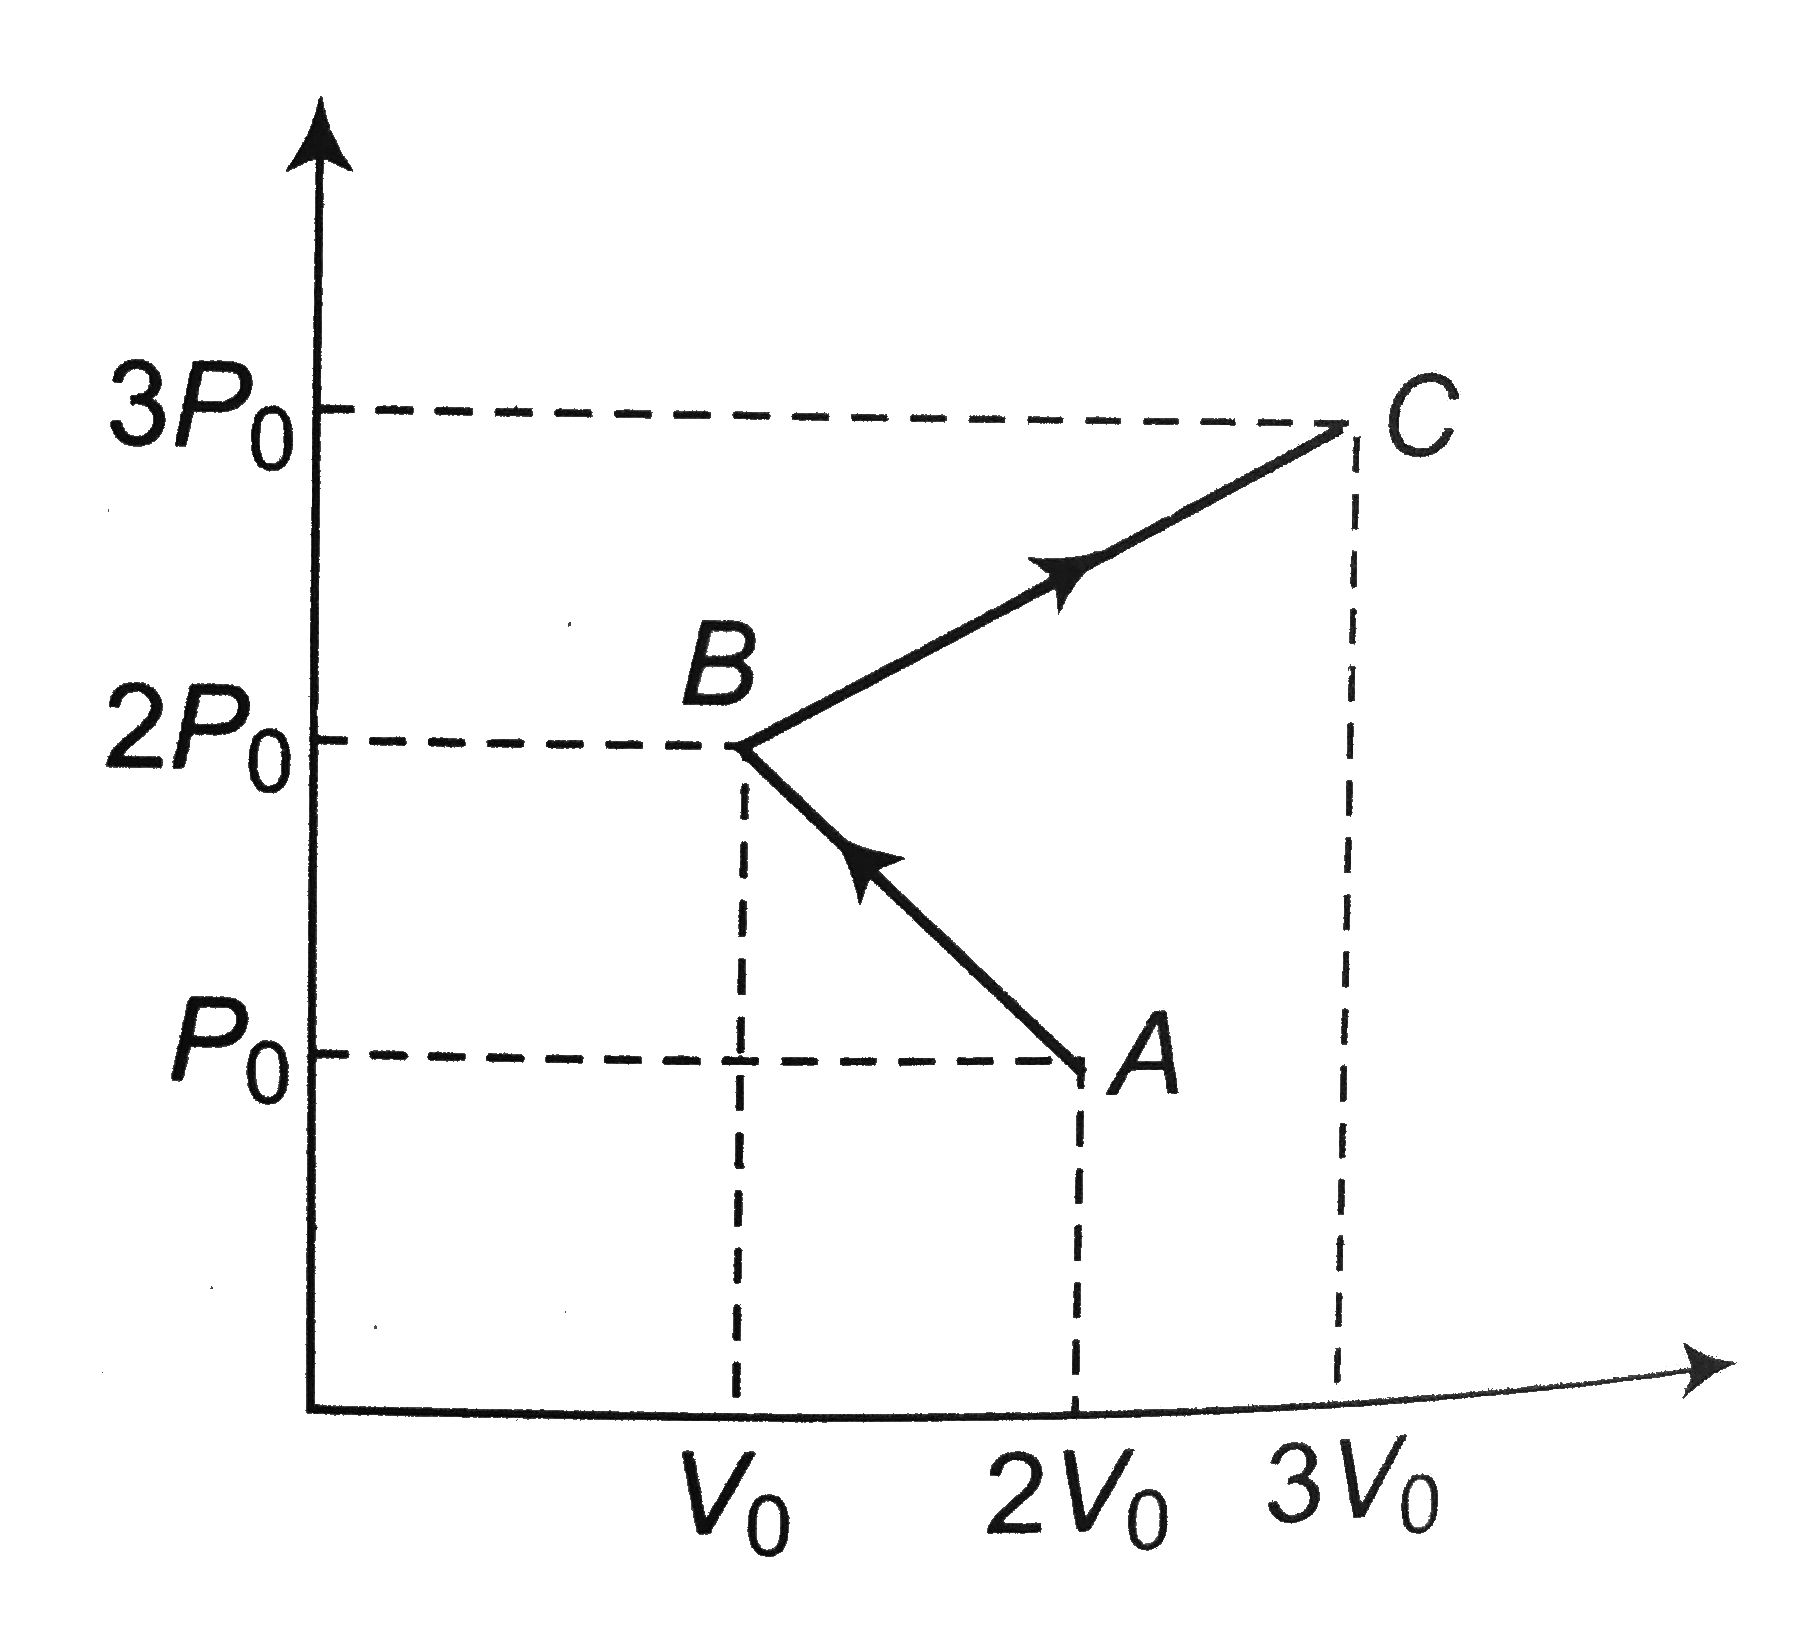 A32P0V0B52P0V0C72P0V0D4P0V0
During the process AB of an ideal gas
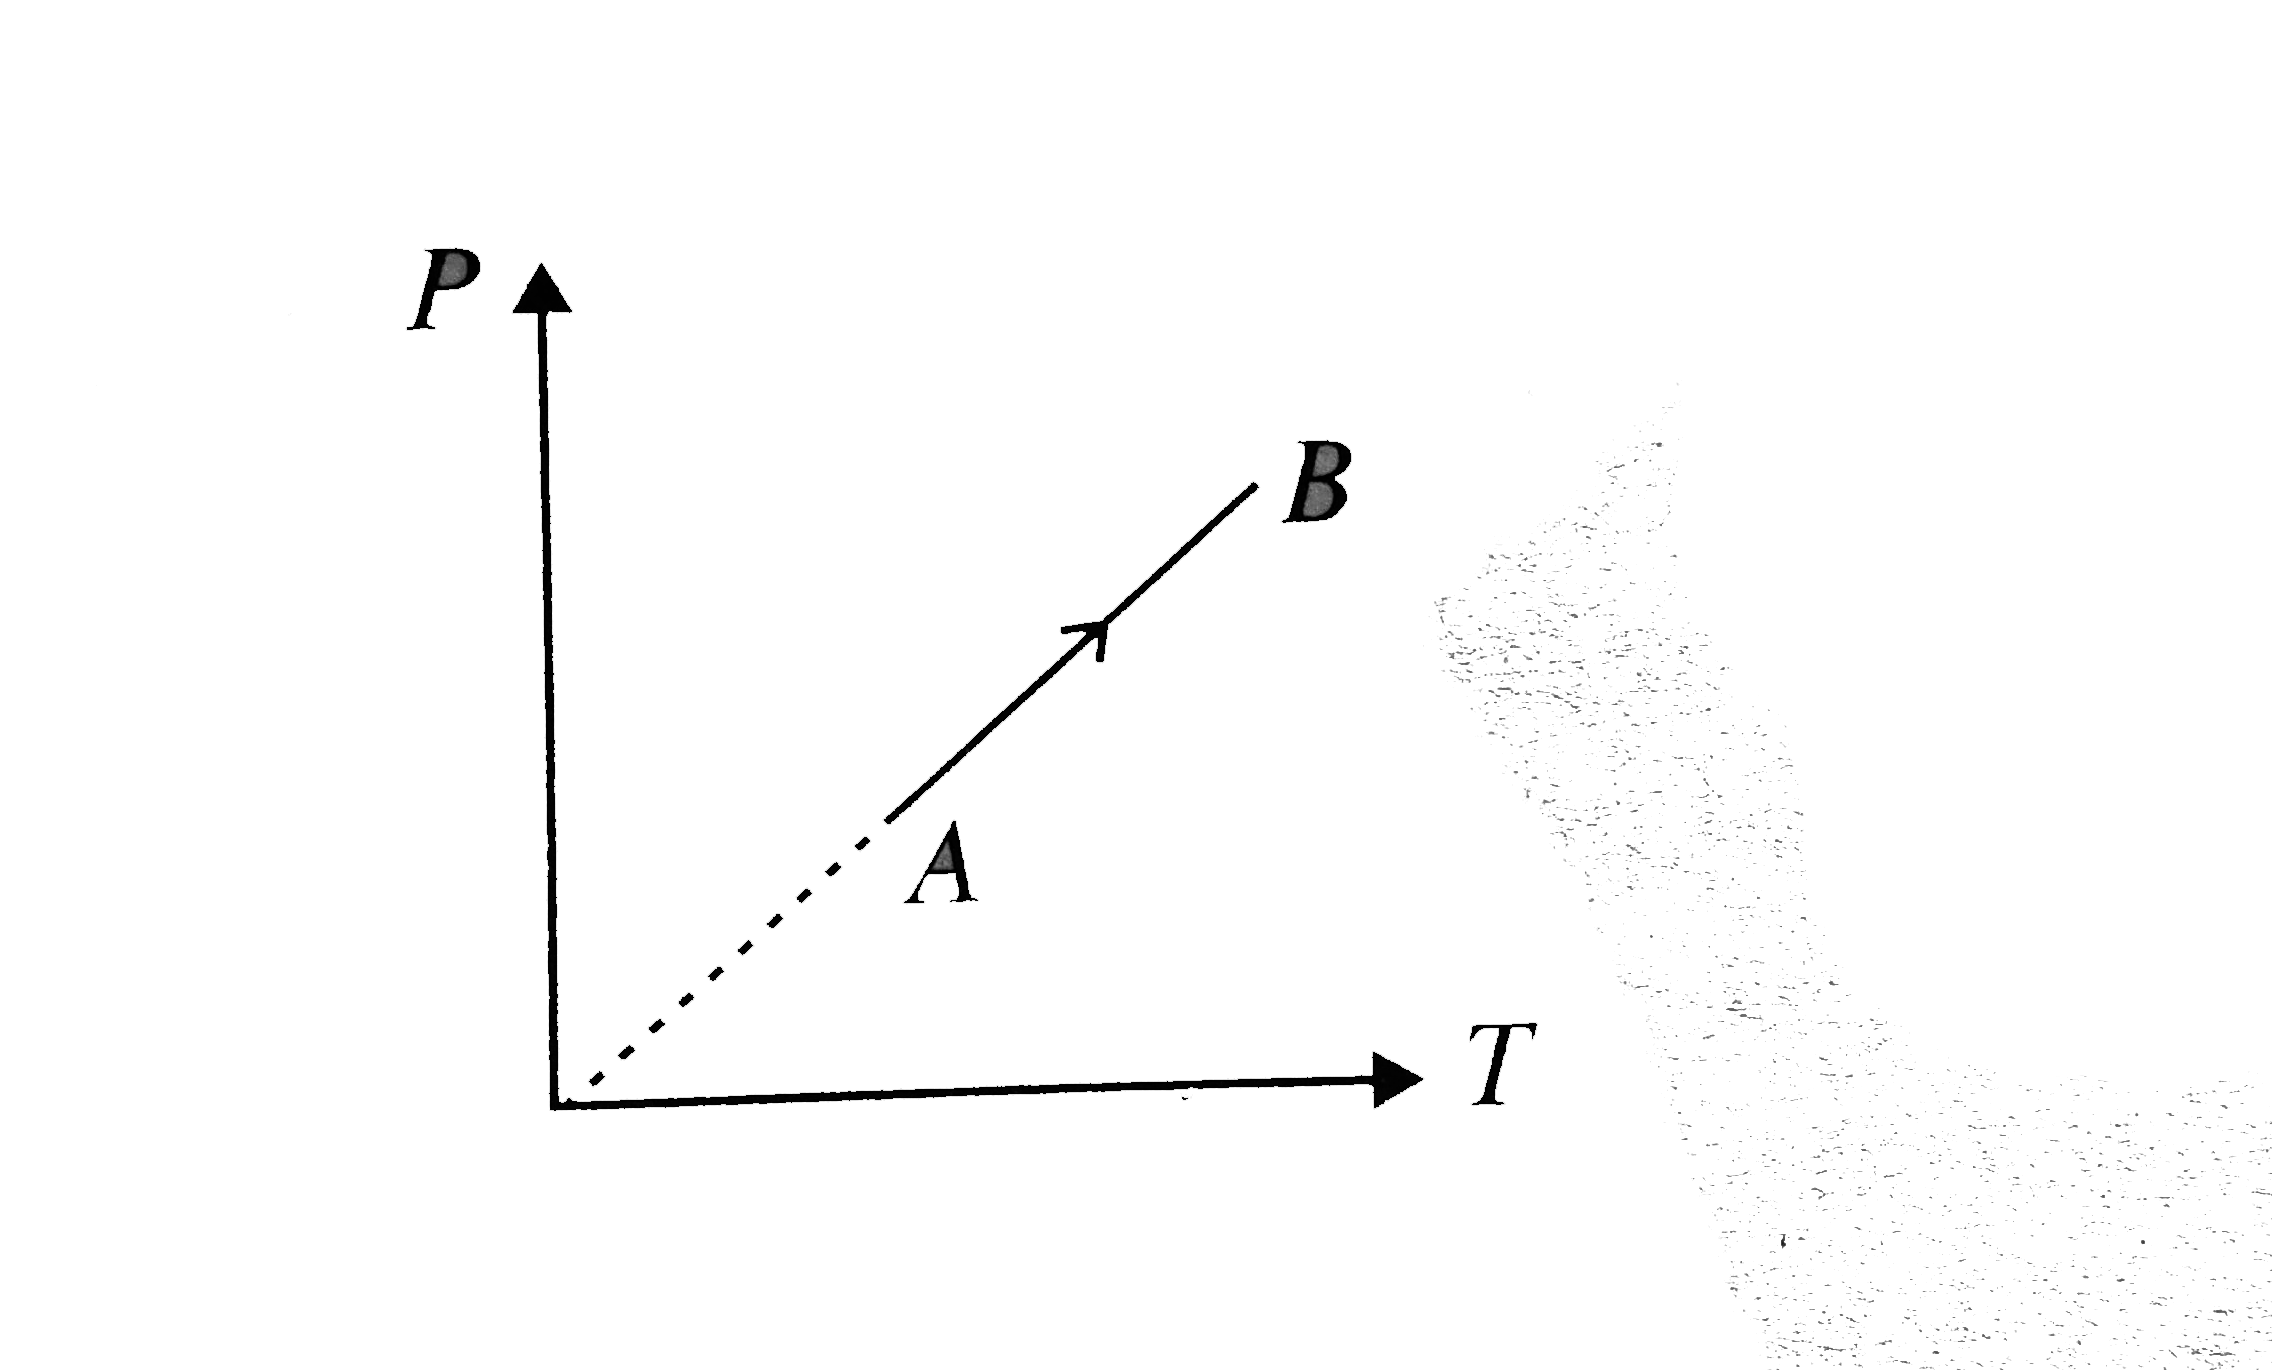 Awork done on the gas is zeroBdensity of the gas is constantCslope of line AB from the T-axis is inversely proportional to the number of moles of the gasDslope of line AB from the T-axis is directly proportional to the number of moles of the gas
The P−V diagram of 2 gm of helium gas for a certain process A→B is shown in the figure. What is the heat given to the gas during the process A→B?
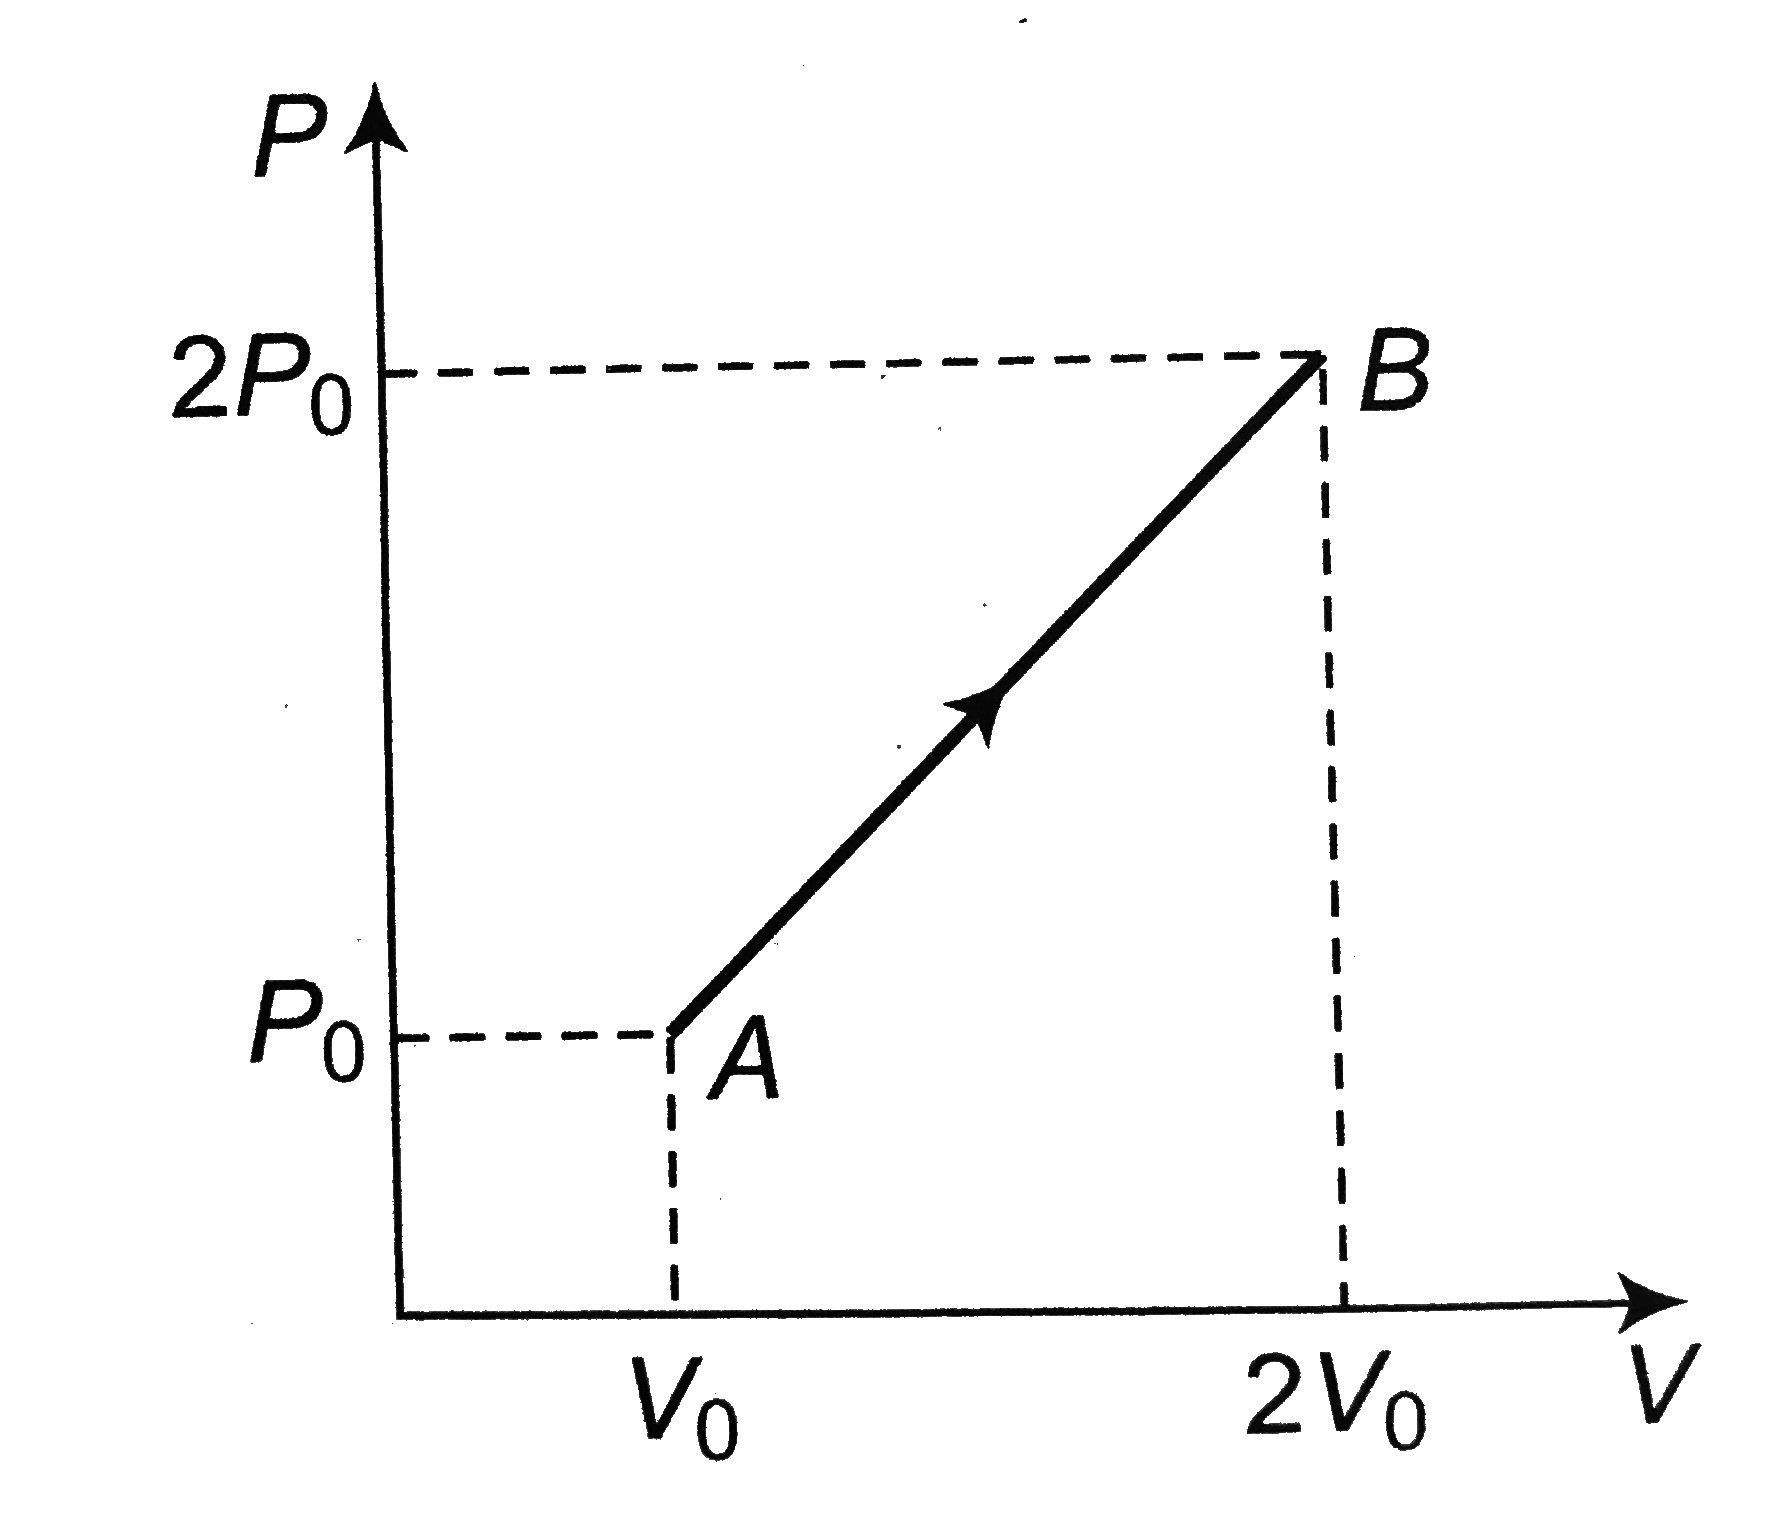 A4P0V0B6P0V0C4.5P0V0D2P0V0
Change in internal energy in an isothermal process for ideal gas is
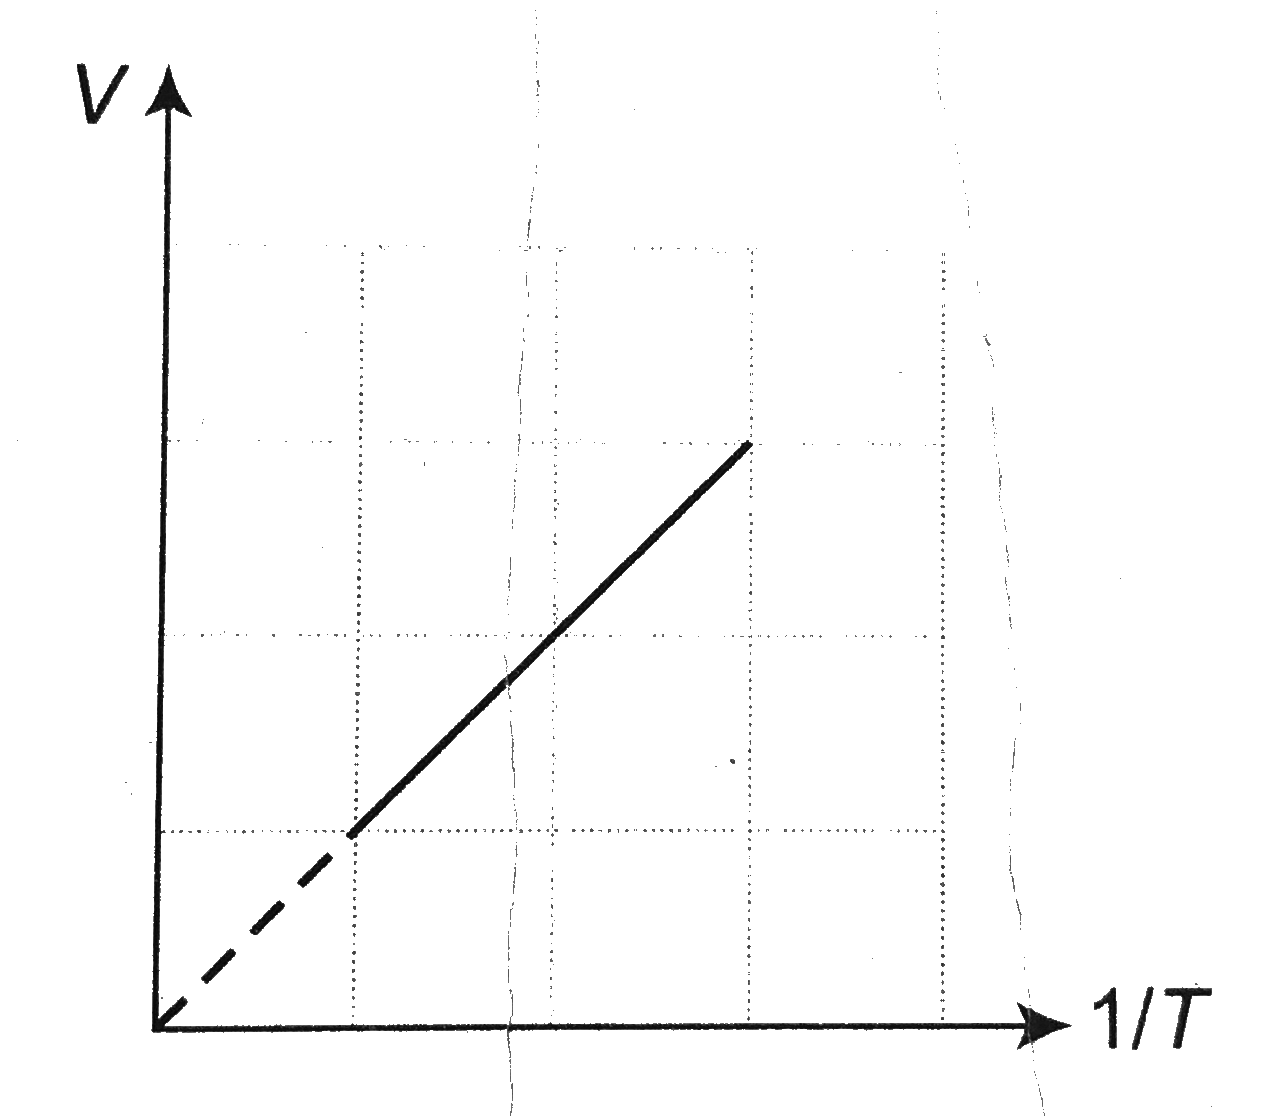
View SolutionTwo moles of an ideal monoatomic gas undergoes a cyclic process ABCA as shown in V-T diagram below:

Heat supplied to the gas during the process AB is :
View SolutionP−V diagram of an ideal gas is as shown in figure. Work done by the gas in process ABCD is
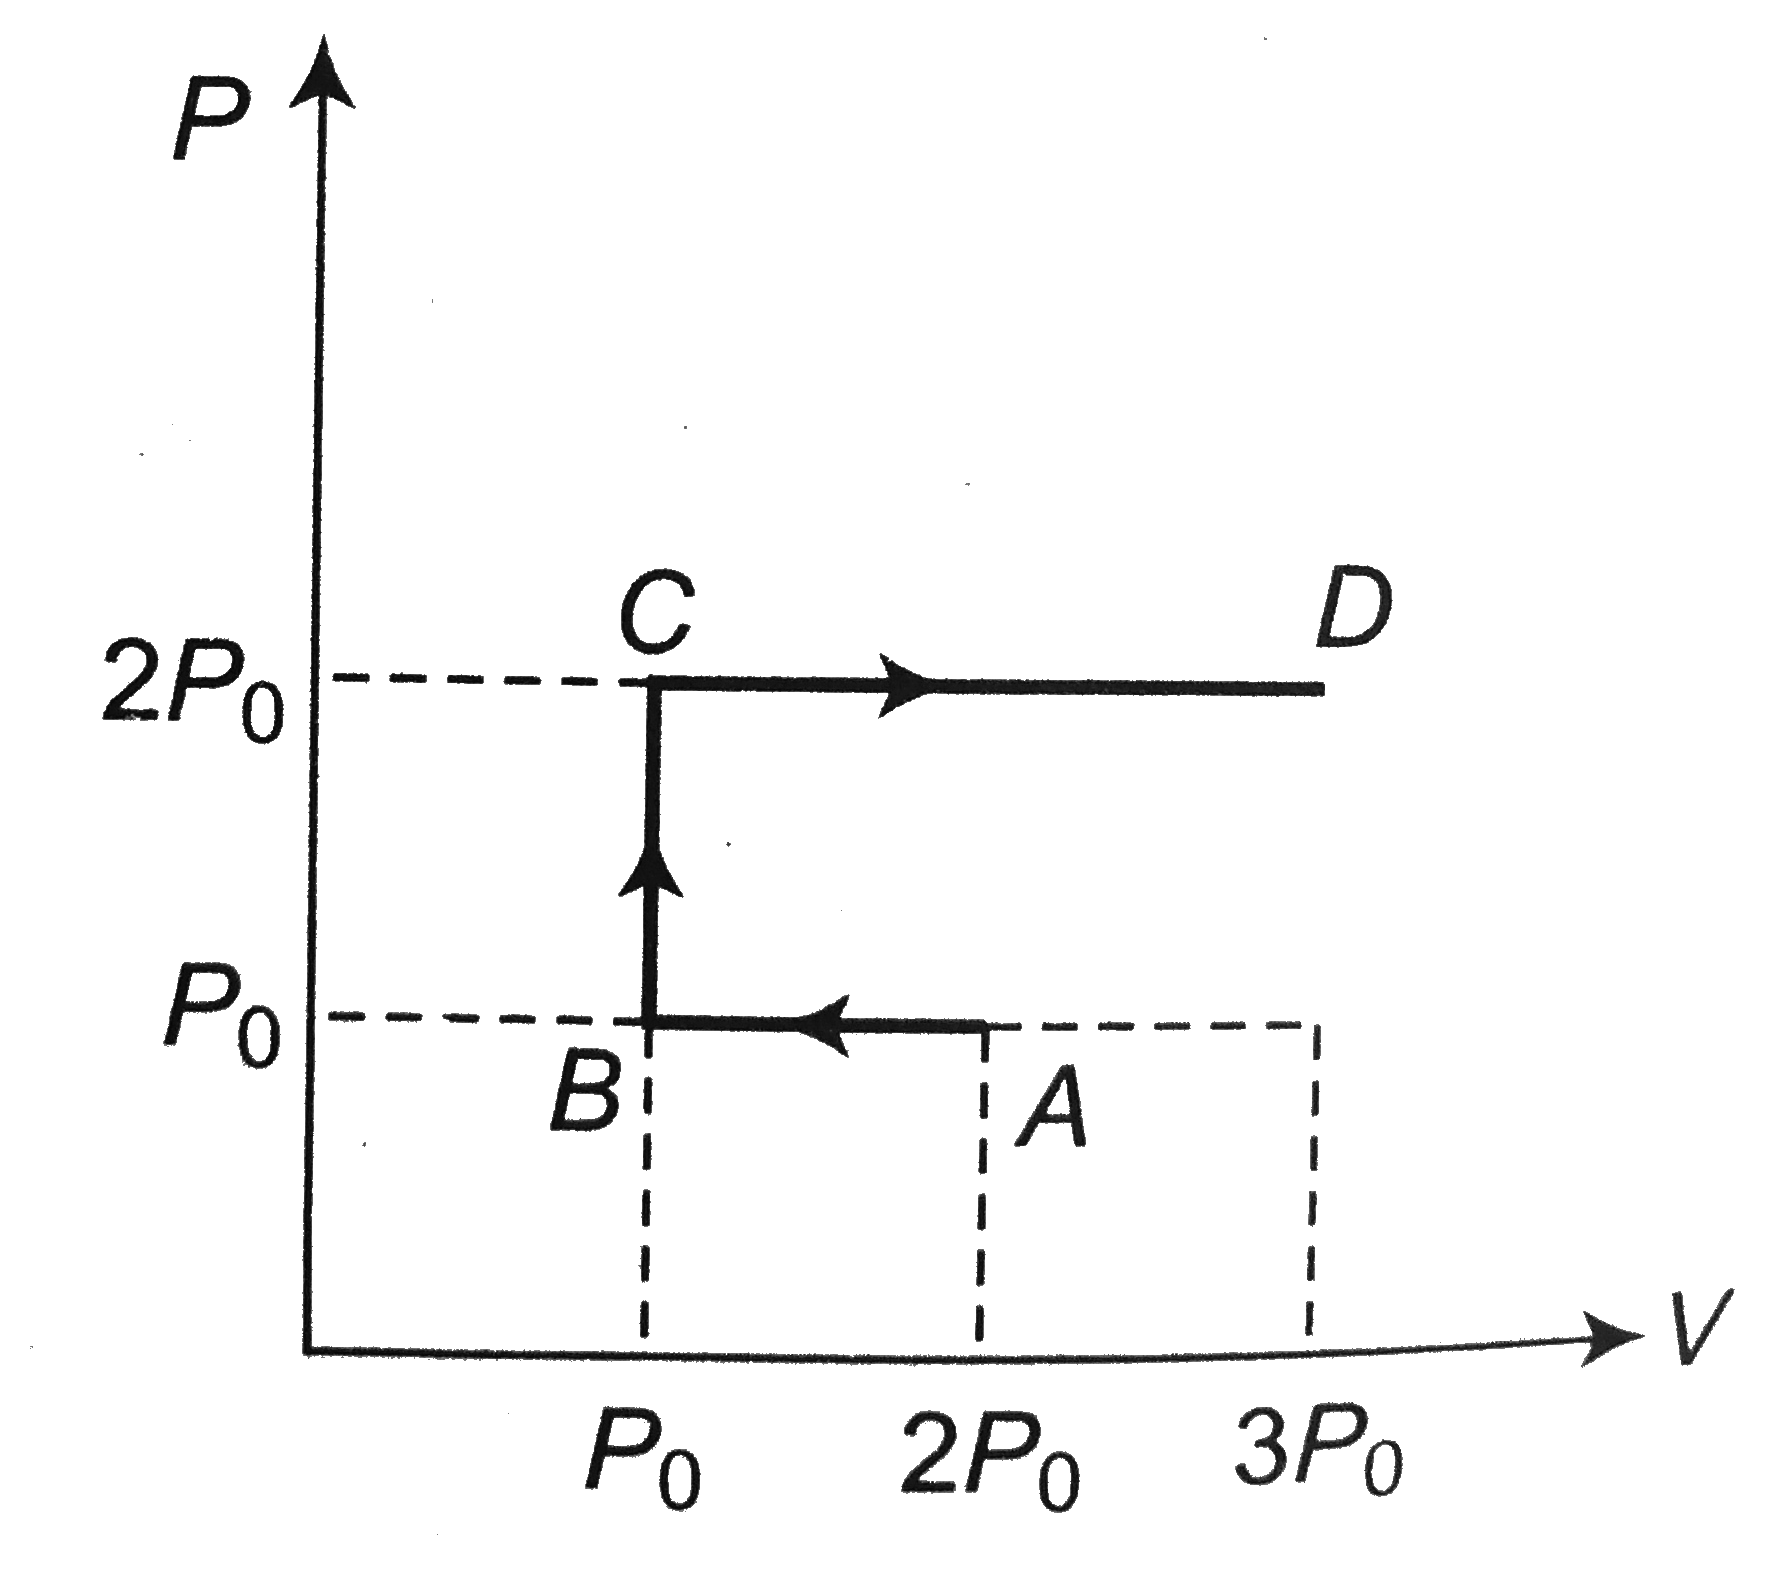
View SolutionP-V diagram of an ideal gas is as shown in figure. Work done by the gas in the process ABCD is
View SolutionOne mole of an ideal monoatomic gas undergoes a process as shown in the figure. Find the molar specific heat of the gas in the process.
R is a gas constant.
View Solution

