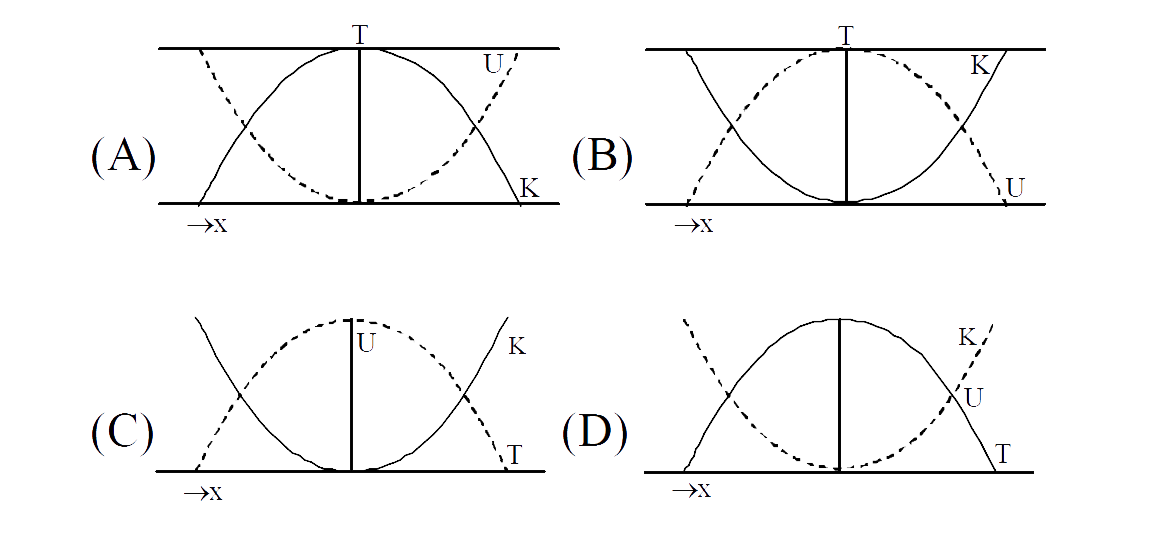
Paragraph : A particle vibrates in S.H.M. along a straight line. Its velocity is 4 cm/s when its displacement is 3 cm and velocity is 3 cm/s when displacement is 4 cm.
For a particle executing SHM the displacement x is given by x = A sin ωt. Identify the graph which represents the variation of potential energy (P.E.) as a function of time and displacement x.

I, III
II, III
I, IV
II, IV.
The correct Answer is:B
P.E.=12mω2x2
P.E.=12mω2A2sin2ωt
∴ The graph between P.E. and t will be similar to curve II and graph between P.E. and x is same as curve III.
So correct choice is (b).
Topper's Solved these Questions
- OSCILLATIONSBOOK - MODERN PUBLICATIONCHAPTER - OSCILLATIONSEXERCISE - MCQ (LEVEL-III) Questions From AIEEE/JEE Examination
10 Videos
- OSCILLATIONSBOOK - MODERN PUBLICATIONCHAPTER - OSCILLATIONSEXERCISE - RCQ
7 Videos
- OSCILLATIONSBOOK - MODERN PUBLICATIONCHAPTER - OSCILLATIONSEXERCISE - RCQ
7 Videos
- MOCK TEST-3BOOK - MODERN PUBLICATIONCHAPTER - MOCK TEST-3EXERCISE - MCQs
49 Videos
- PROPERTIES OF MATTERBOOK - MODERN PUBLICATIONCHAPTER - PROPERTIES OF MATTEREXERCISE - RECENT COMPETITIVE QUESTIONS
17 Videos
Similar Questions
A body executing S.H.M. has its velocity 10cm/s and 7cm/s when its displacement from the mean positions are 3cm and 4cm respectively. Calculate the length of the path.
View SolutionA body executing S.H.M. has its velocity 10cm/s and 7cm/s when its displacement from the mean positions are 3cm and 4cm respectively. Calculate the length of the path.
View Solution
Knowledge Check
For a particle executing S.H.M. the displacement x is given by x=Acosωt . Identify the graph which represents the variation of potential energy (P.E.) as a function of time
 AI,IIIBII, IVCII, IIIDI,IV
Graph between velocity and displacement of a particle, executing S.H.M. is
AA straight lineBA parabolaCA hyperbolaDAn ellipseA body executing linear simple harmonic motion has a velocity of 3 cm/s when its displacement is 4 cm and a velocity of 4 cm/s when its displacement is 3 cm. Then amplitude of oscillation with be
A5 cmB7.5 cmC10 cmD12.5 cm
A body of mass 40g is executing linear simple harmonic motion and has a velocity of 2cm/s when its displacement is 3cm and a velocity of 3 cm/s when its displacement is 2cm . Then
View SolutionA particle executing SHM has a velocity of 2 ms−1 when its displacement from mean position is 1 cm and a velocity of 1ms−1 when its displacement is 2 cm. Its amplitude of oscillationis
View SolutionA particle executes SHM along a straight line 4cm long. When the displacement is 1cm its velocity and acceleration are numerically equal. The time period of SHM is
View SolutionA particle executes SHM. Then the graph of velocity as a function of displacement is
View SolutionA particle is executing S.H.M. along a straight line. The graph showing the variation of kinetic, potential and total energy K, U and T respectively with displacement is -

View Solution
