Read the given passage and answer the following questions.
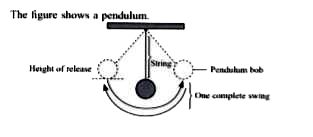
The figure shows a pendulum.

Dcepak wanted to fi nd out the time taken by the pendulum to make a complete swing as shown in the figure. He adjusted the factors used in the experiment. The time period of a simple pendulum is calculated by using T=2π√1g
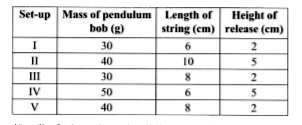
where I= length of pendulum, g=980cm/s2. He then tabulated his results in the following table :

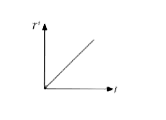
Which of the fo llowing graphs best represents the variation of T2 with I ?


The correct Answer is:A
Time period T=2π√lgorT2=kl, where k is some constant. So, T2 increases linearly with I.
Topper's Solved these Questions
- NSO QUESTION PAPER 2018- 19 SET - BBOOK - SCIENCE OLYMPIAD FOUNDATION CHAPTER - NSO QUESTION PAPER 2018- 19 SET - BEXERCISE - ACHIEVERS SECTION
2 Videos
- NSO QUESTION PAPER 2018- 19 SET - ABOOK - SCIENCE OLYMPIAD FOUNDATION CHAPTER - NSO QUESTION PAPER 2018- 19 SET - AEXERCISE - SCIENCE
9 Videos
- NSO QUESTION PAPER 2019-20 SET ABOOK - SCIENCE OLYMPIAD FOUNDATION CHAPTER - NSO QUESTION PAPER 2019-20 SET AEXERCISE - ACHIEVERS SECTION
2 Videos
Similar Questions
Knowledge Check
Time period of simple pendulum is
AT=2π√lgBT=2π√glCT=√2πlgDT=12π√glIf the time period of a simple pendulum is T=2π√l/g , then the fractional error in acceleration due to gravity is
A4π2ΔlΔT2BΔll−2ΔlTCΔll+2ΔTTDNone of these
Show that the expression of the time period T of a simple pendulum of length l given by T=2π√lg is dimensionally currect
View SolutionShow that the expression of the time period T of a simple pendulum of length l given by T=2π√lg is dimensionally correct
View SolutionThe time period of a simple pendulum is given by T=2π√lg
where 'l' is the length of the pendulum and 'g' is the acceleration due to gravity at that place.
(a) Express 'g' in terms of T
(b) What is the length of the seconds pendulum ? (Take g=10ms−2)
View SolutionWhat is the time period of a simple pendulum if length of the pendulum is equal to the radius of Earth ?
View SolutionState how does the time period of a simple pendulum depend on length of pendulum.
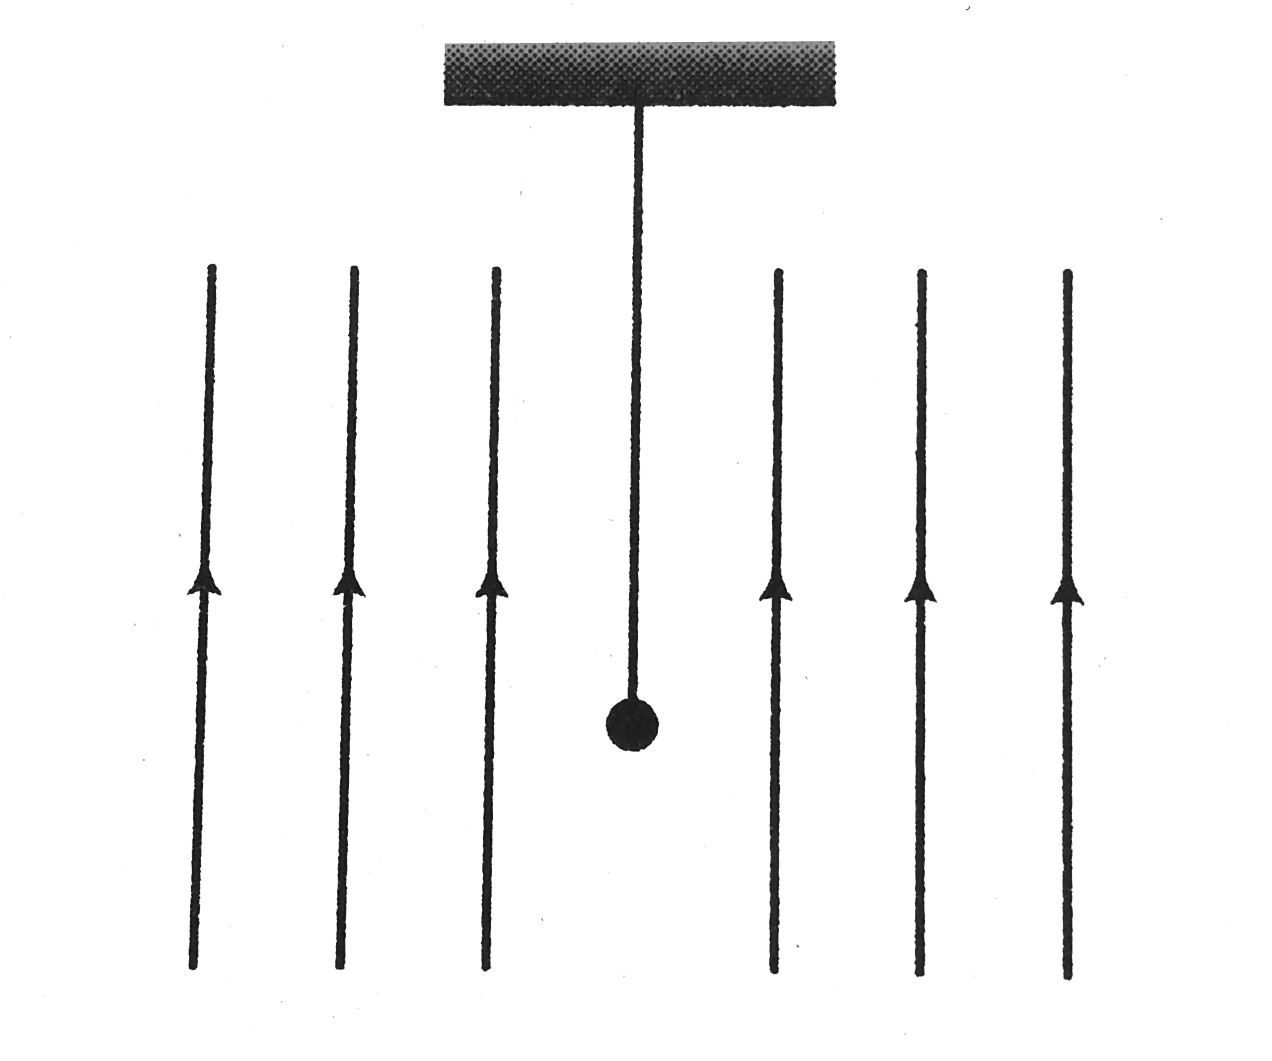
View SolutionA neutral pendulum oscillates in a uniform electric field as shown in figure. If a positive charge is given to the pendulum, then its time period

View Solution
