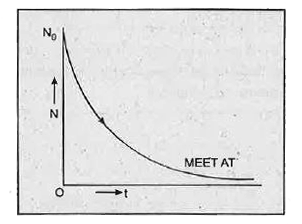
Sketch a graph to illustrate radioactive decay. Define the half life of a radioactive element and find its value in terms of decay constant λ
Text Solution
According to radioactive decay law
N=N0e−λT
A graph between N and t is as shown in the figure.

|
Topper's Solved these Questions
- ATOMS AND NUCLEIBOOK - MBD -HARYANA BOARDCHAPTER - ATOMS AND NUCLEIEXERCISE - LONG ANSWER TYPE QUESTIONS
3 Videos
- ATOMS AND NUCLEIBOOK - MBD -HARYANA BOARDCHAPTER - ATOMS AND NUCLEIEXERCISE - OBJECTIVE TYPE QUESTIONS
23 Videos
- ATOMS AND NUCLEIBOOK - MBD -HARYANA BOARDCHAPTER - ATOMS AND NUCLEIEXERCISE - OBJECTIVE TYPE QUESTIONS
23 Videos
- BOARD QUESTION PAPER (SOLVED) - 2019BOOK - MBD -HARYANA BOARDCHAPTER - BOARD QUESTION PAPER (SOLVED) - 2019EXERCISE - LONG ANSWER TYPE QUESTIONS
4 Videos
Similar Questions
Knowledge Check
The decay constant λ of a radioactive sample:
ADecreases with increase of external pressure and temperatureBIncrease with increase of external pressure and temperatureCDecreases with increase of temperature and increase of pressureDIs independent of temperature and pressure.The half-life of a radioactive decay is x times its mean life. The value of zx is
A0.3010B0.6930C0.6020D10.6930
Define decay constant of a radioactive sample.
View SolutionThe half life of a radioactive substance is 13 years. The decay constant is
View SolutionState the laws of radioactive decay. Define the term 'decay constant' for a radioactive substance.
View SolutionThe half-life of a radioactive decay is x times its mean life. The value of zx is
View SolutionDefine radioactive decay constant.
View SolutionDefine half-life period of a radioactive substance. Establish its relationship with the decay constant.
View Solution
