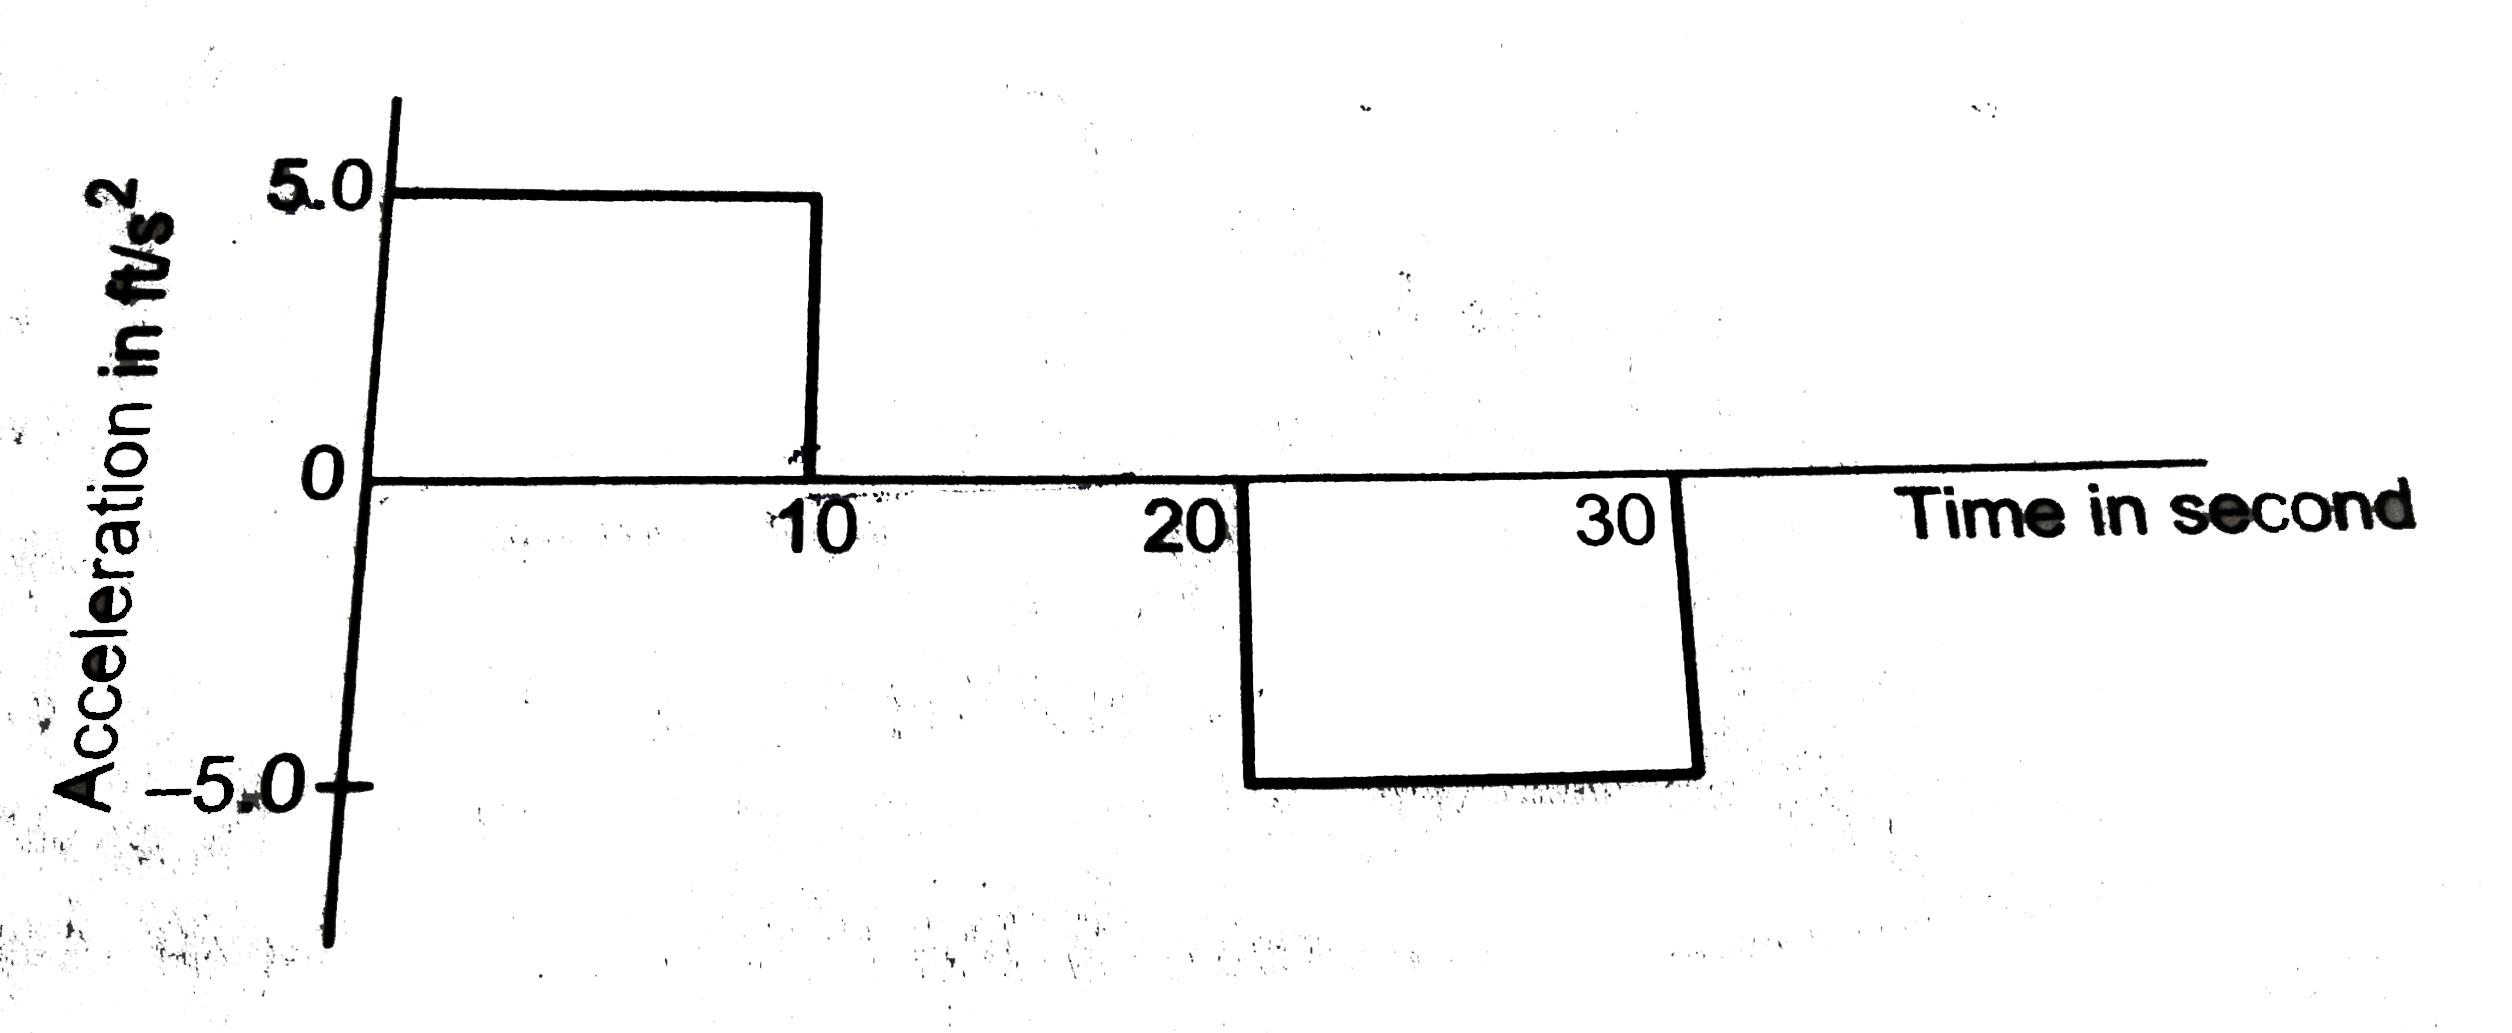
The acceleration of a cart started at t=0 varies with time as shown in figure. Find the distance travelled in 30 seconds and draw the position time graph.
 Solution in Tamil
The correct Answer is:A
In first 10sec<br>S1=ut+12at2<br>=0+125.102=250ft.<br>At10sec<br>v=u=∗<br>=0+5×10=50ftsec.∴ From 10 to 20 sc (△t=20−10=10) it moves with uniform velocity of 50 ft/sec.
Distance
S2=50×10=500ft
Between 20 sec to 30 sec acceleration is constant i.e. −5fts2<br><imga≤ocr_imageload∈g=lazysrc=https://d10lpgp6xz60nq.cloudfront.net/physics_images/HCV_VOL1_C03_E01_044_S01.pngwh=80%mx-autosty≤=background:white;><br>At20sec<br>velocityis50ftsec<br>t=30-20=10 s
S_3= ut+ 1/2 at^2
=50xx10+1/2(-5)10^2
=500-250=250m<br>Totaldistancetravel≤dis30sec=S_1+S_2+S_3
=250+500+250
=1000 ft.
Topper's Solved these Questions
- REST AND MOTION : KINEMATICSBOOK - HC VERMACHAPTER - REST AND MOTION : KINEMATICSEXERCISE - Objective -2
10 Videos
- PHYSICS AND MATHEMATICSBOOK - HC VERMACHAPTER - PHYSICS AND MATHEMATICSEXERCISE - Exercises
34 Videos
- ROTATIONAL MECHANICSBOOK - HC VERMACHAPTER - ROTATIONAL MECHANICSEXERCISE - Exercises
86 Videos
Similar Questions
Consider the motion of the tip of the minute hand of a clock. In one hour
View SolutionA vector →A makes an angle of 20∘and→B makes an angle of 110∘ with the X-axis. The magnitude of these vectors are 3 m and 4 m respectively.Find the resultant
View SolutionA wheel is making revolutions about its axis with uniform angular acceleration. Starting from rest, till it reaches 100 rev/sec in 4 seconds. Find the angular acceleration.
View SolutionA body starts from rest at time t = 0 , the acceleration time graph is shown in the figure . The maximum velocity attained by the body will be
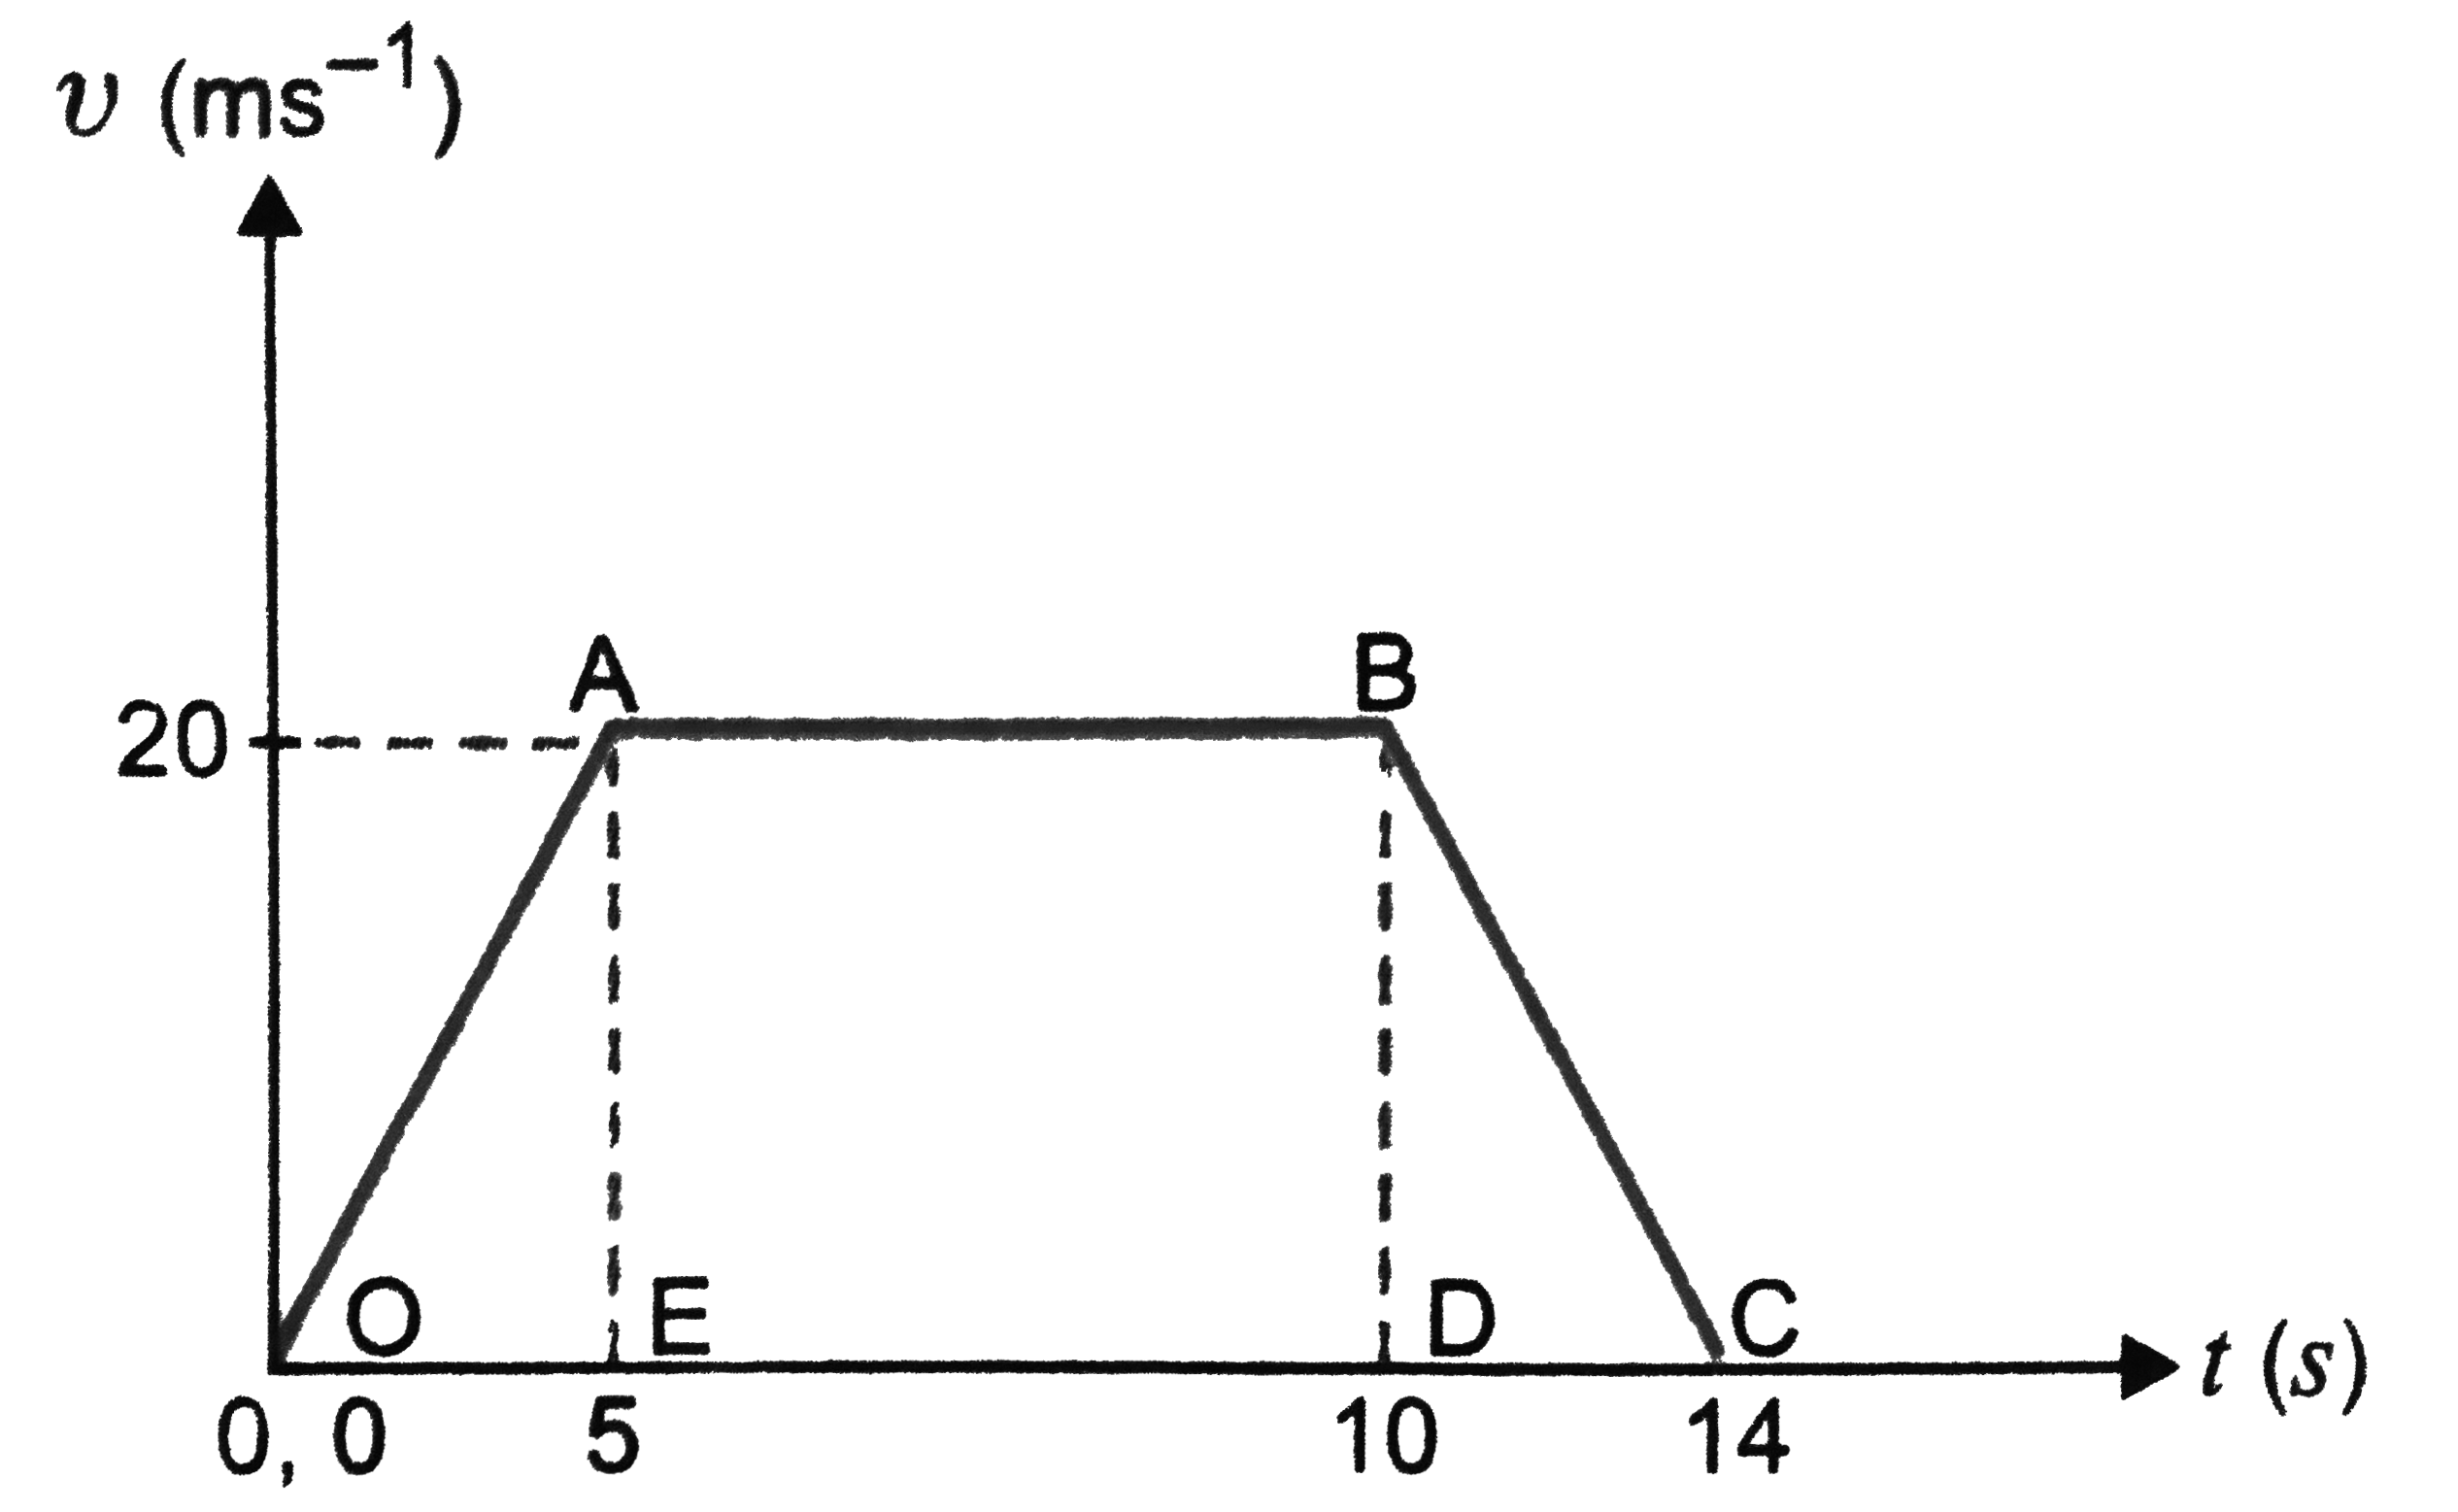
View SolutionVelocity (v) time (t) graph of a car starting from rest is shown in Fig. 2(b). 13. Draw acceleration (a) -time (t) graph for the motion of the car and find total distance travelled by car.
 .
.
View SolutionThe acceleration vs time of a particle moving along +x direction is shown in figure-1.23. If starts at t = 0 , from rest, Draw the position -time graph for the motion.
View Solutionसरल रेखा में गति करते हुए एक कण का त्वरण समय ग्राफ चित्र में प्रदर्शित है। कण का वेग समय ग्राफ प्रापत कीजिए, यदि t=0 पर v=0 है।
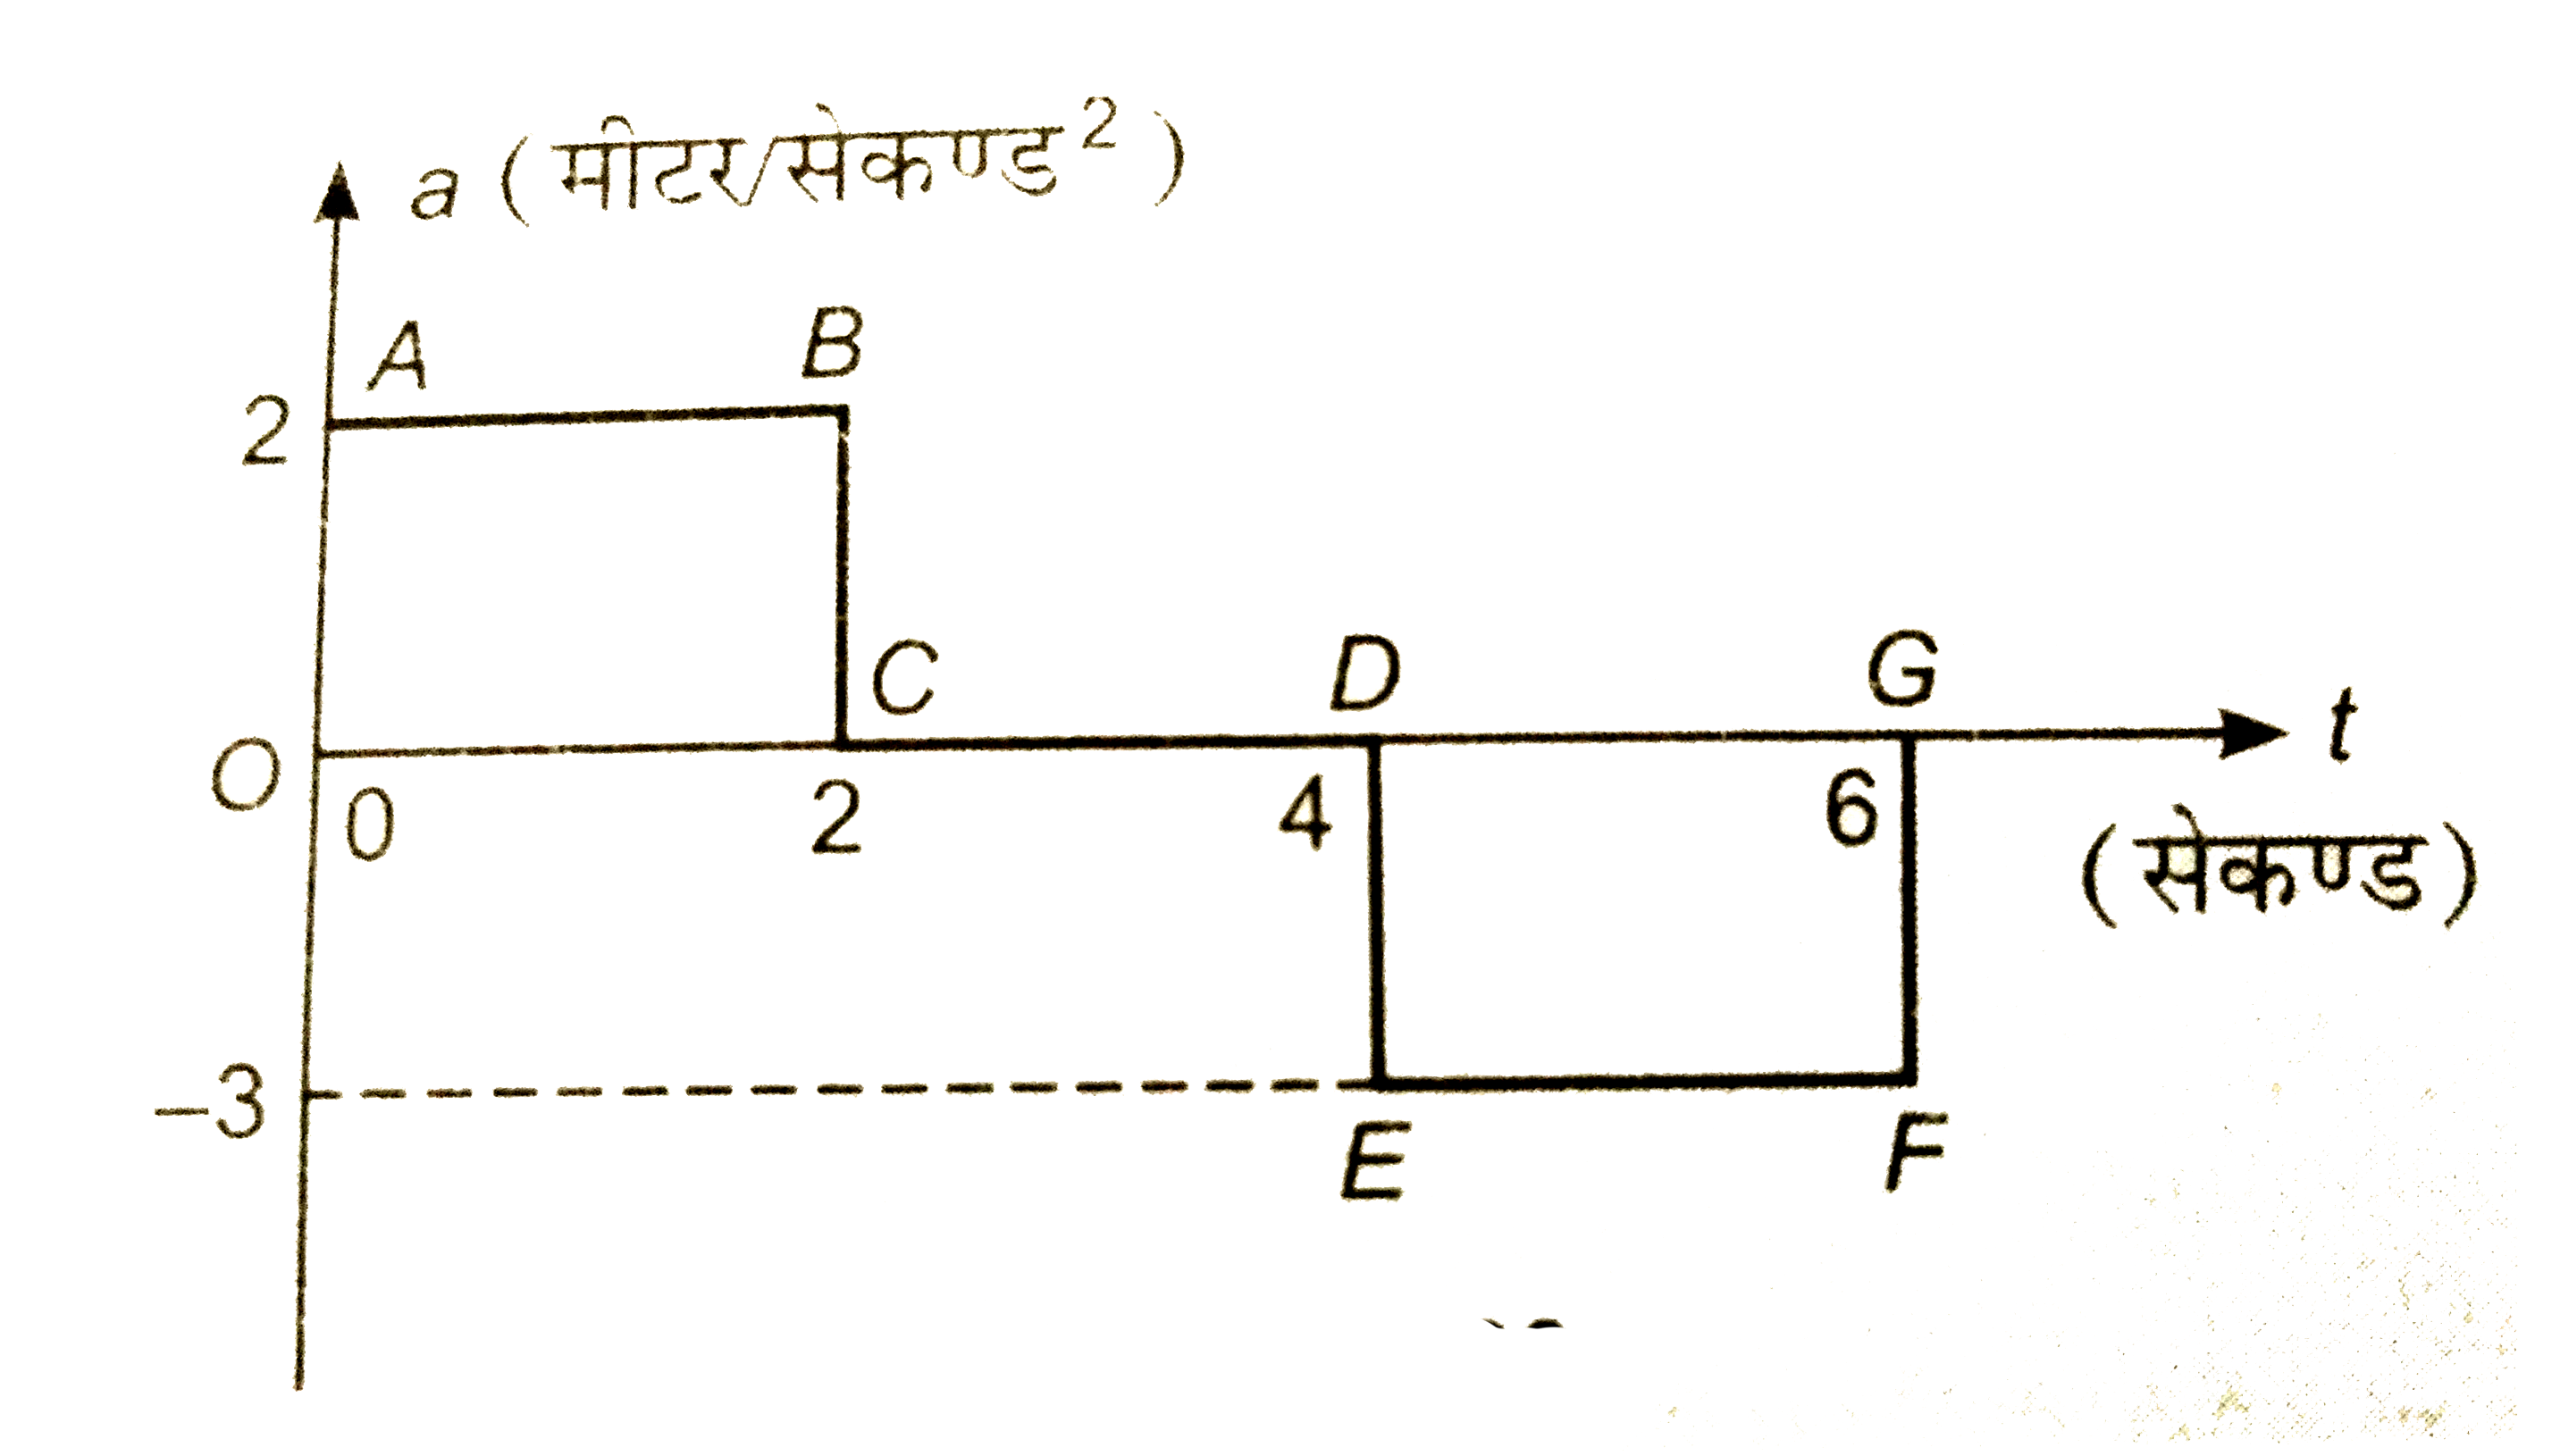
View Solutionसमय t =0 पर एक कूड़ा गाडी सीधी सड़क पर चलना प्रारम्भ करती है | इसका त्वरण चित्र में दिखाया गया है | (a) गाड़ी द्वारा 30 s में चली गई दुरी निकले | (b) गाडी के स्थान एवं समय के बीच ग्राफ खींचे |
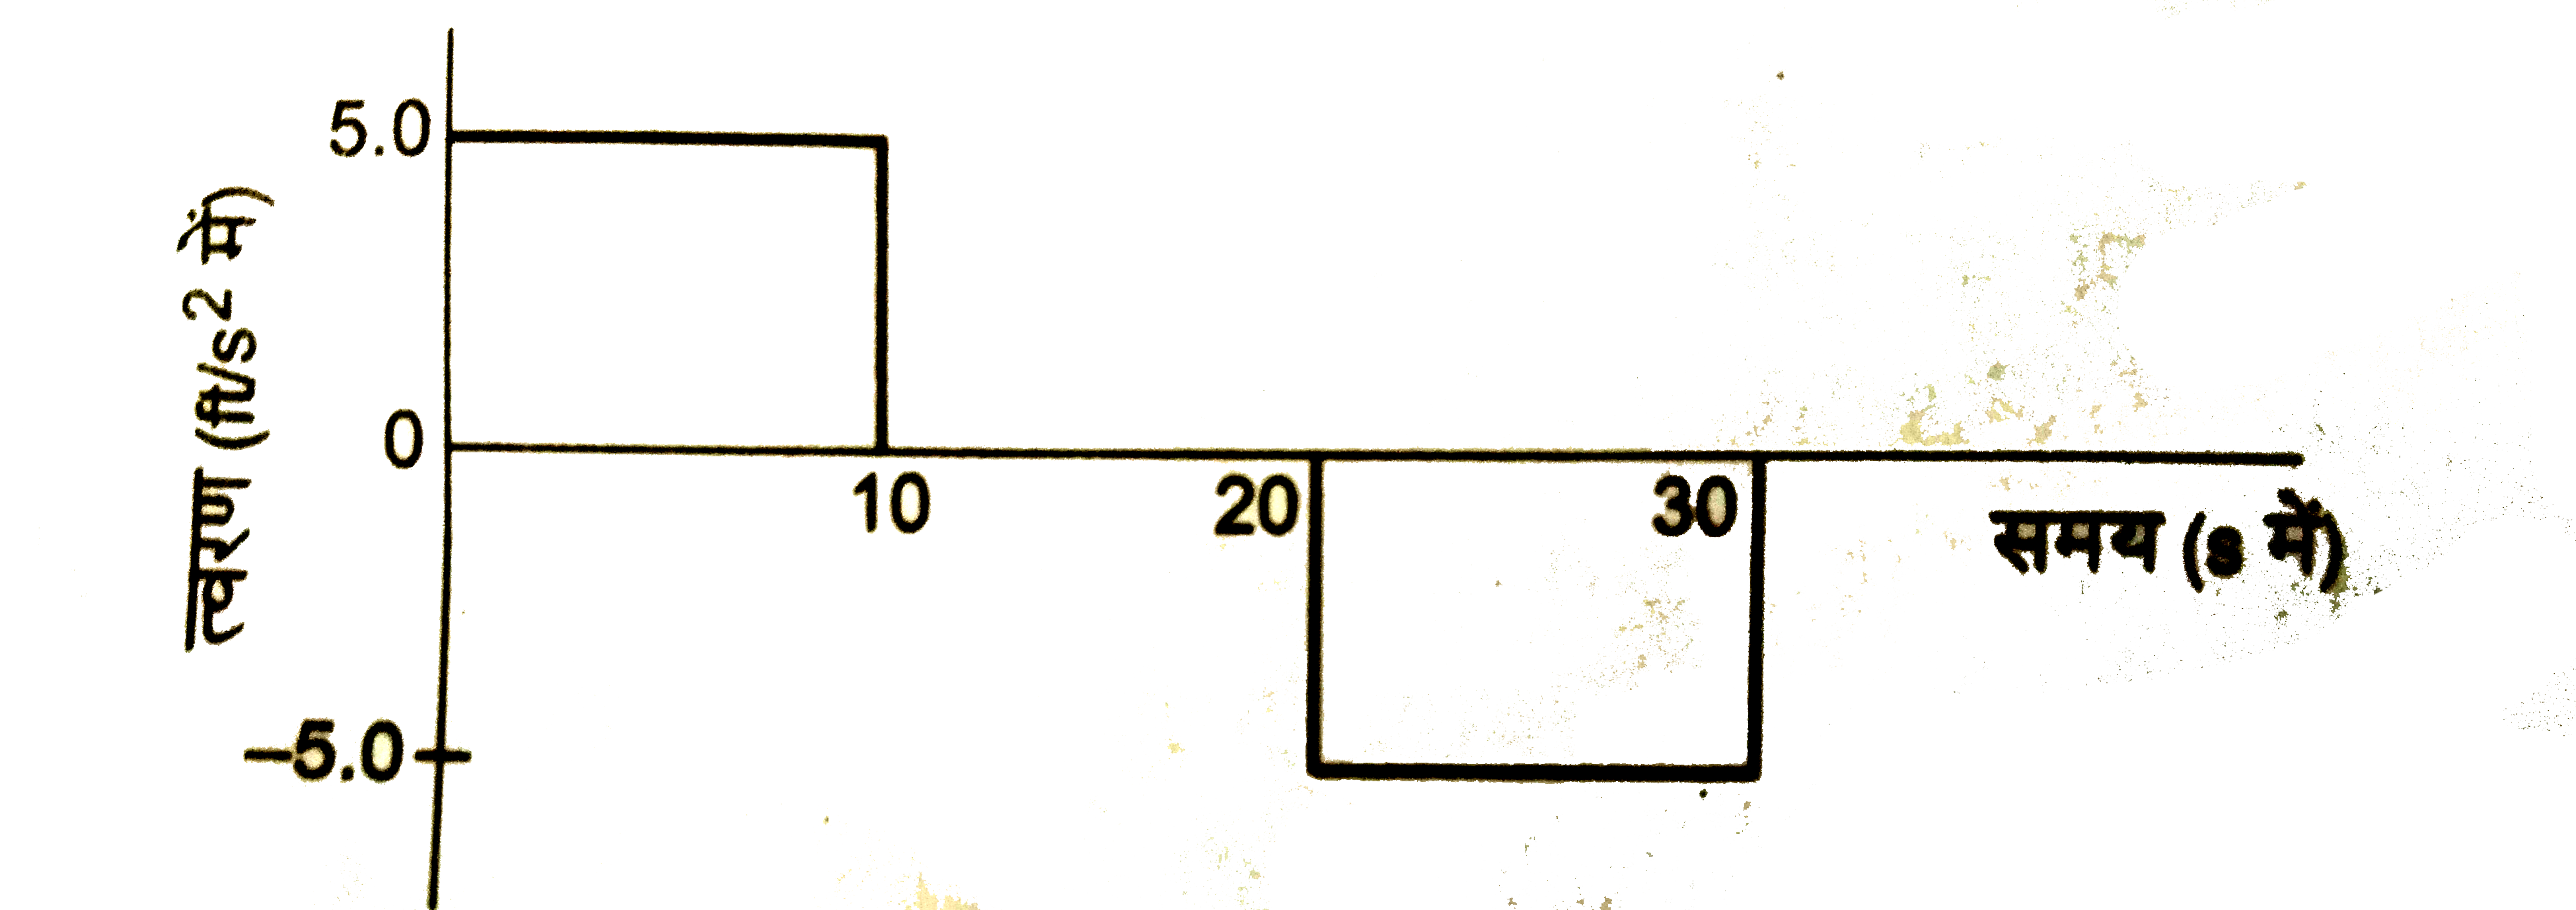
View Solutionएक वस्तु t=0 पर विरामावस्था से चित्र 3.44 में प्रदर्शित त्वरण - समय ग्राफ द्वारा प्रदर्शित त्वरण के अंतर्गत चलना प्रारम्भ करती है । इसकी सहायता से t=0 से t=4 सेकण्ड तक वस्तु की गति का वेग - समय ग्राफ खींचिए ।
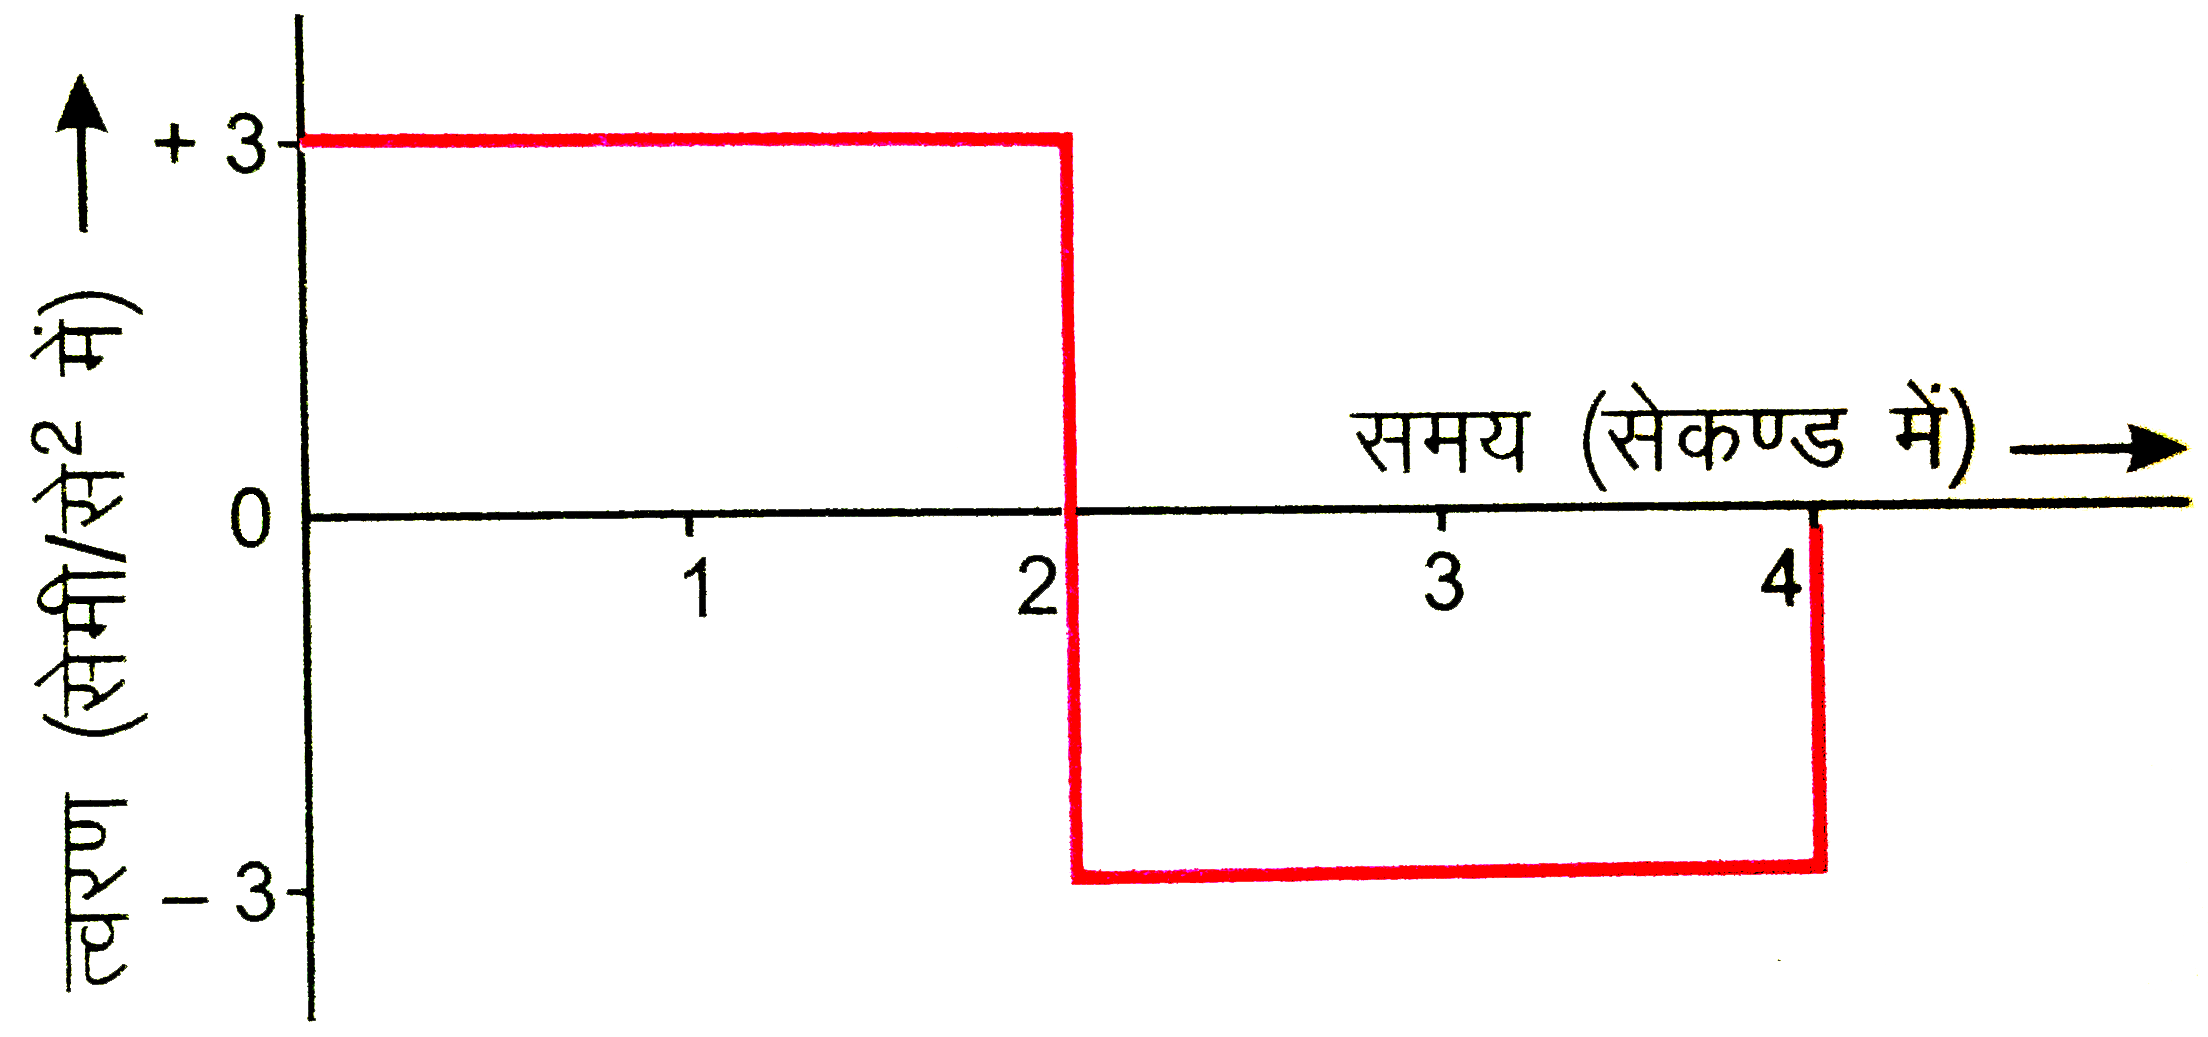
View SolutionA graph of acceleration versus time of a particle starting from rest at t=0 is as shown in figure. The speed of the particle at t = 14s is
View SolutionThe position - time graph for a particle moving along a straight line is shown in figure. The total distance travelled by it in time t = 0 to t = 10 s is
View SolutionPosition - time graph for a particle is shown in figure. Starting from t = 0, at what time t, the average velocity is zer?
View SolutionAcceleration - time graph for a particle is given in figure. If it starts motion at t = 0, distance travelled in 3 s will be
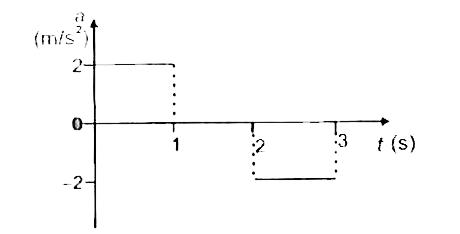
View SolutionSpeed time graph of a particle shown in figure. Find distance travelled by particle in 5 second .
View SolutionCart A ,of mass m ,starts from rest and travels in a straight line with acceleration a. It traverses a distance x in time t .Cart B ,of mass 4m ,starts from rest and travels in a straight line with acceleration a/2. At time t it has traversed the distance
View SolutionSpeed time graph of a particle shown in figure. Find distance travelled by particle in 5second.
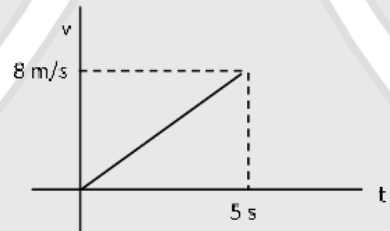
View Solution
