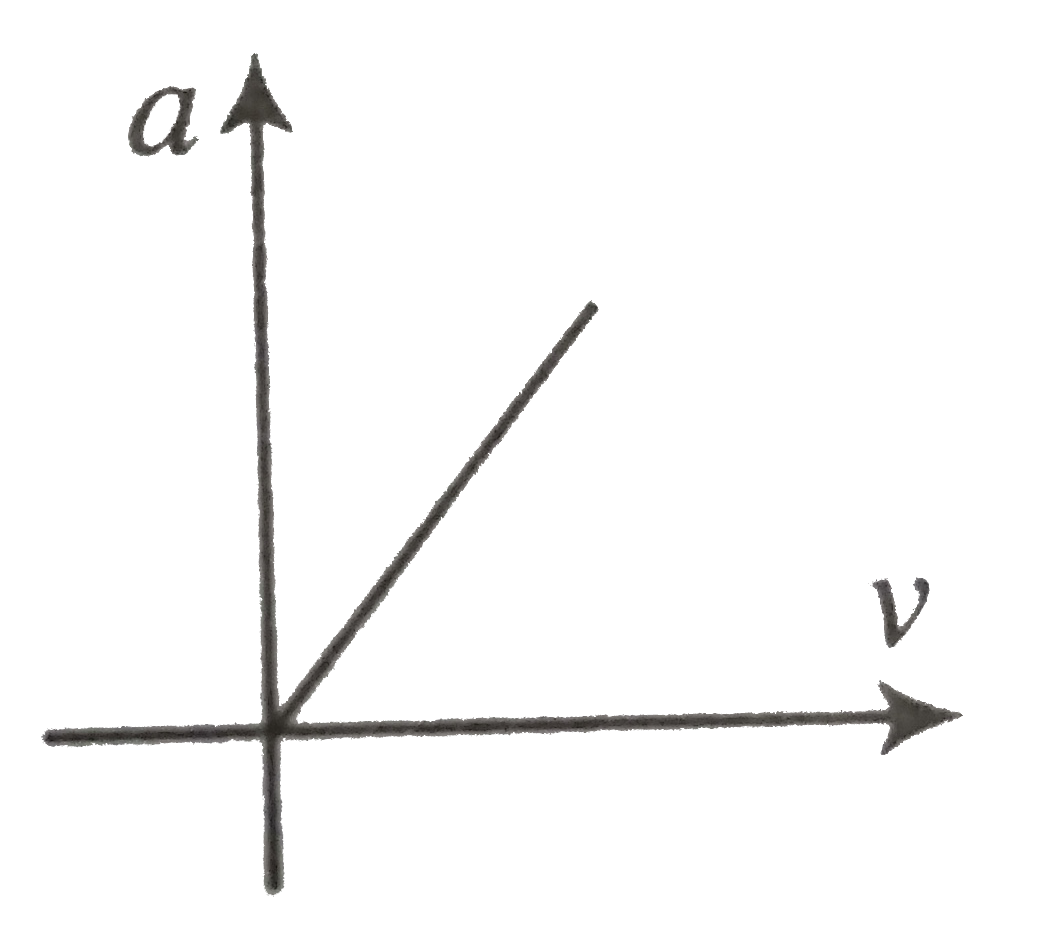
The acceleration - velocity graph of a particle moving in a straight line is shown in figure. Then the slope of the velocity- displacement graph
increases linearly
decreases linearly
is constant
increases parabolically
The correct Answer is:C
c. Acceleration- velocity equation from the graph is
a = kv, where k is the slope of given line.
This can also be written as
vdvds=kv⇒dvds=k
i.e. slope of velocity - displacement graph is same as slope of
acceleration- velocity graph which is constant.
Topper's Solved these Questions
- MISCELLANEOUS KINEMATICSBOOK - CENGAGE PHYSICSCHAPTER - MISCELLANEOUS KINEMATICSEXERCISE - Multiple Correct Answer Type
26 Videos
- MISCELLANEOUS KINEMATICSBOOK - CENGAGE PHYSICSCHAPTER - MISCELLANEOUS KINEMATICSEXERCISE - Linked Comprehension Type
35 Videos
- LINEAR AND ANGULAR SIMPLE HARMONIC MOTIONBOOK - CENGAGE PHYSICSCHAPTER - LINEAR AND ANGULAR SIMPLE HARMONIC MOTIONEXERCISE - Multiple Correct Answer Type
9 Videos
- MISCELLANEOUS VOLUME 2BOOK - CENGAGE PHYSICSCHAPTER - MISCELLANEOUS VOLUME 2EXERCISE - INTEGER_TYPE
10 Videos
Similar Questions
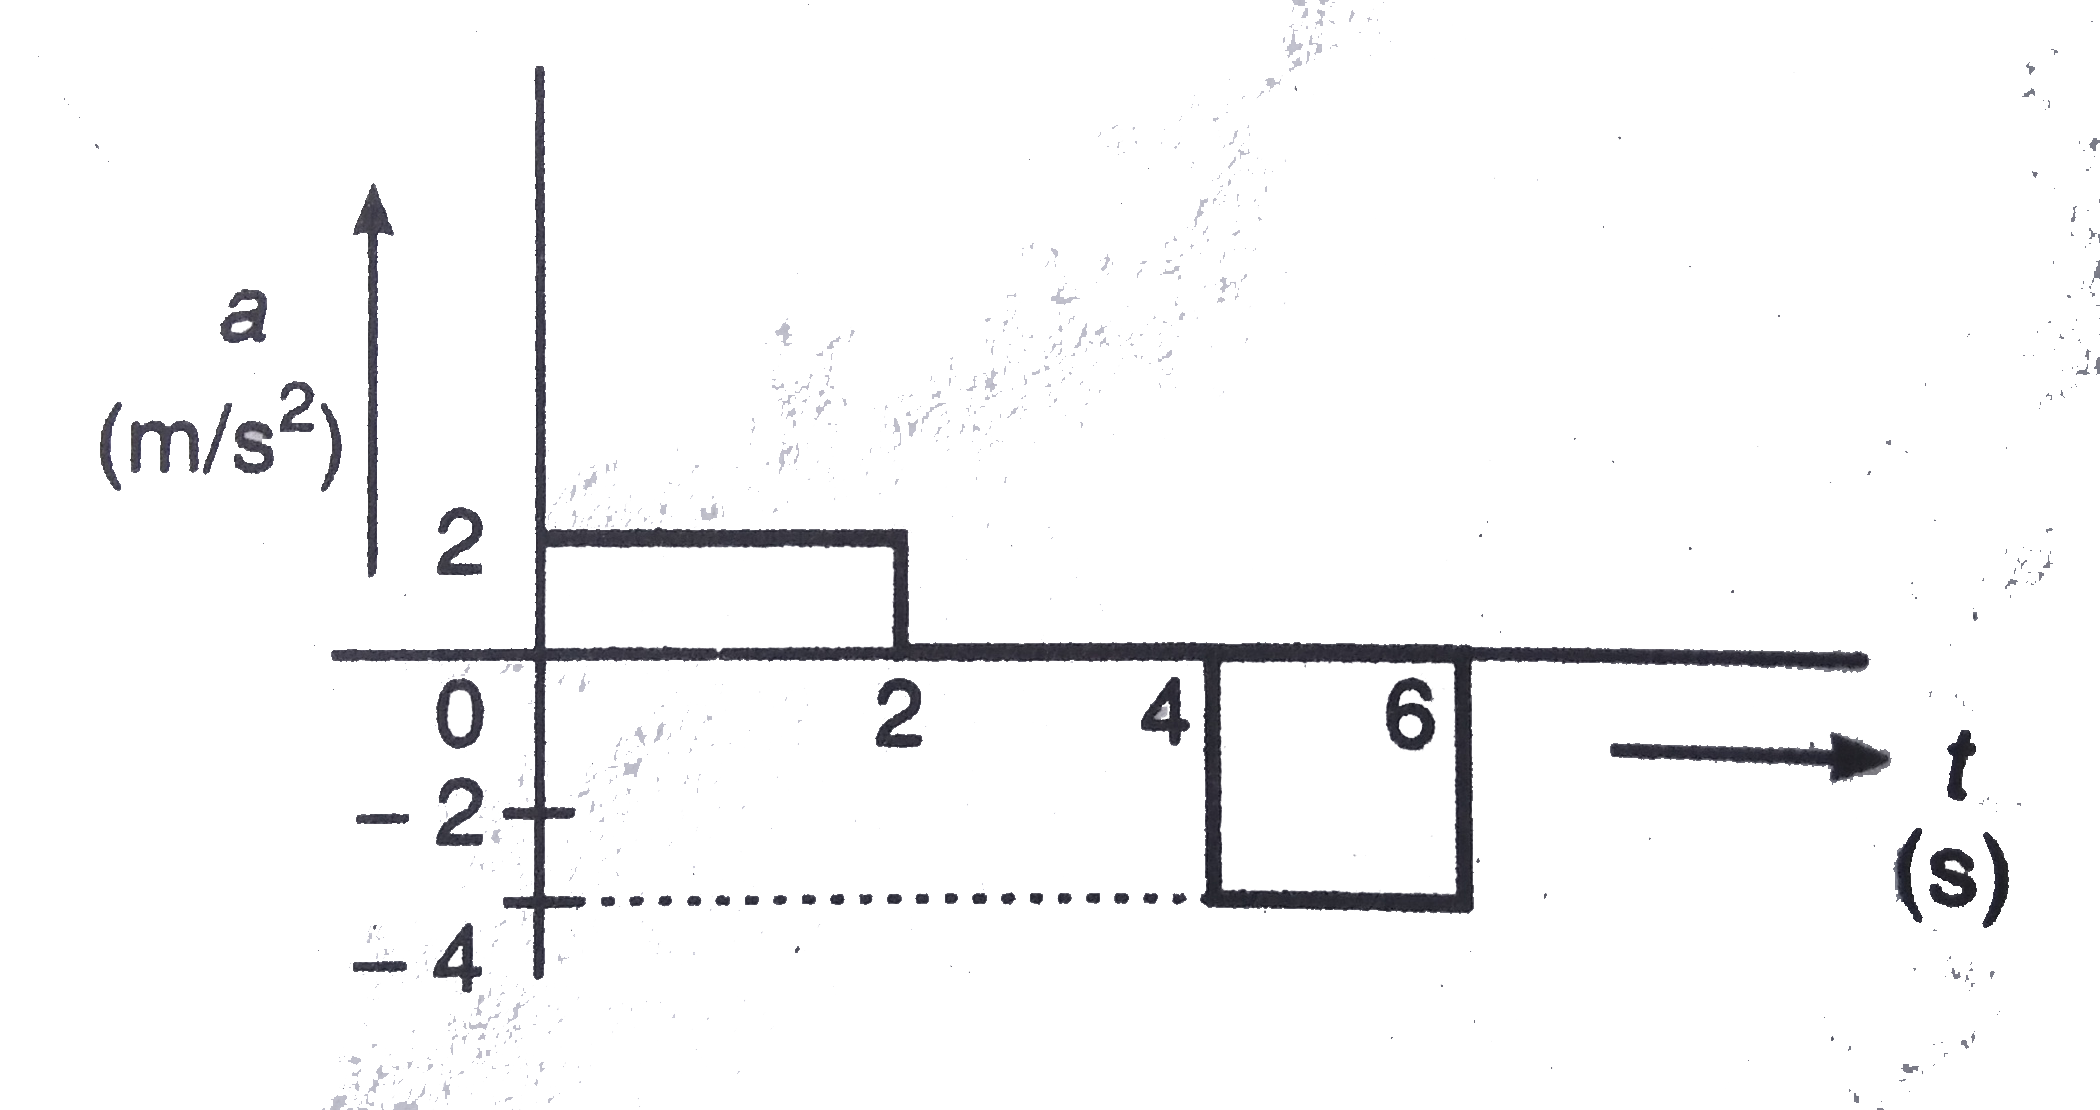
The acceleration versus time graph of a particle moving along a straight line is shown in the figure. Draw the respective velocity-time graph Given v=0 at t=0.
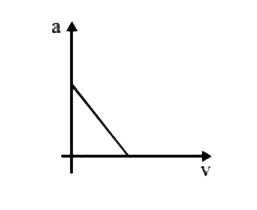
View SolutionAcceleration versus velocity graph of a particle moving in a straight line starting form rest is as shown in figure. The corresponding velocity-time graph would be :
View Solution
Knowledge Check
Acceleration-velocity graph of a particle moving in a straight line is as shown in the figure. Then slope of velocity-displacement graph
 Aincreases linearlyBdecrease linearlyCis constantDincreases parabolically
Displacement time graph of a particle moving in a straight line is a shown in figure.
 Ain region A acceleration is positiveBin region B acceleration is negativeCin region C acceleration is positiveDin region D acceleration is negative
Velocity displacement graph of a particle moving in a straight line is as shown in figure.
 Amagnitude of acceleration of particle is decreasingBmagnitude of acceleration of particlre is increasingCacceleration versus displacement graph straight lineDacceleration versus displacement graph is parabola
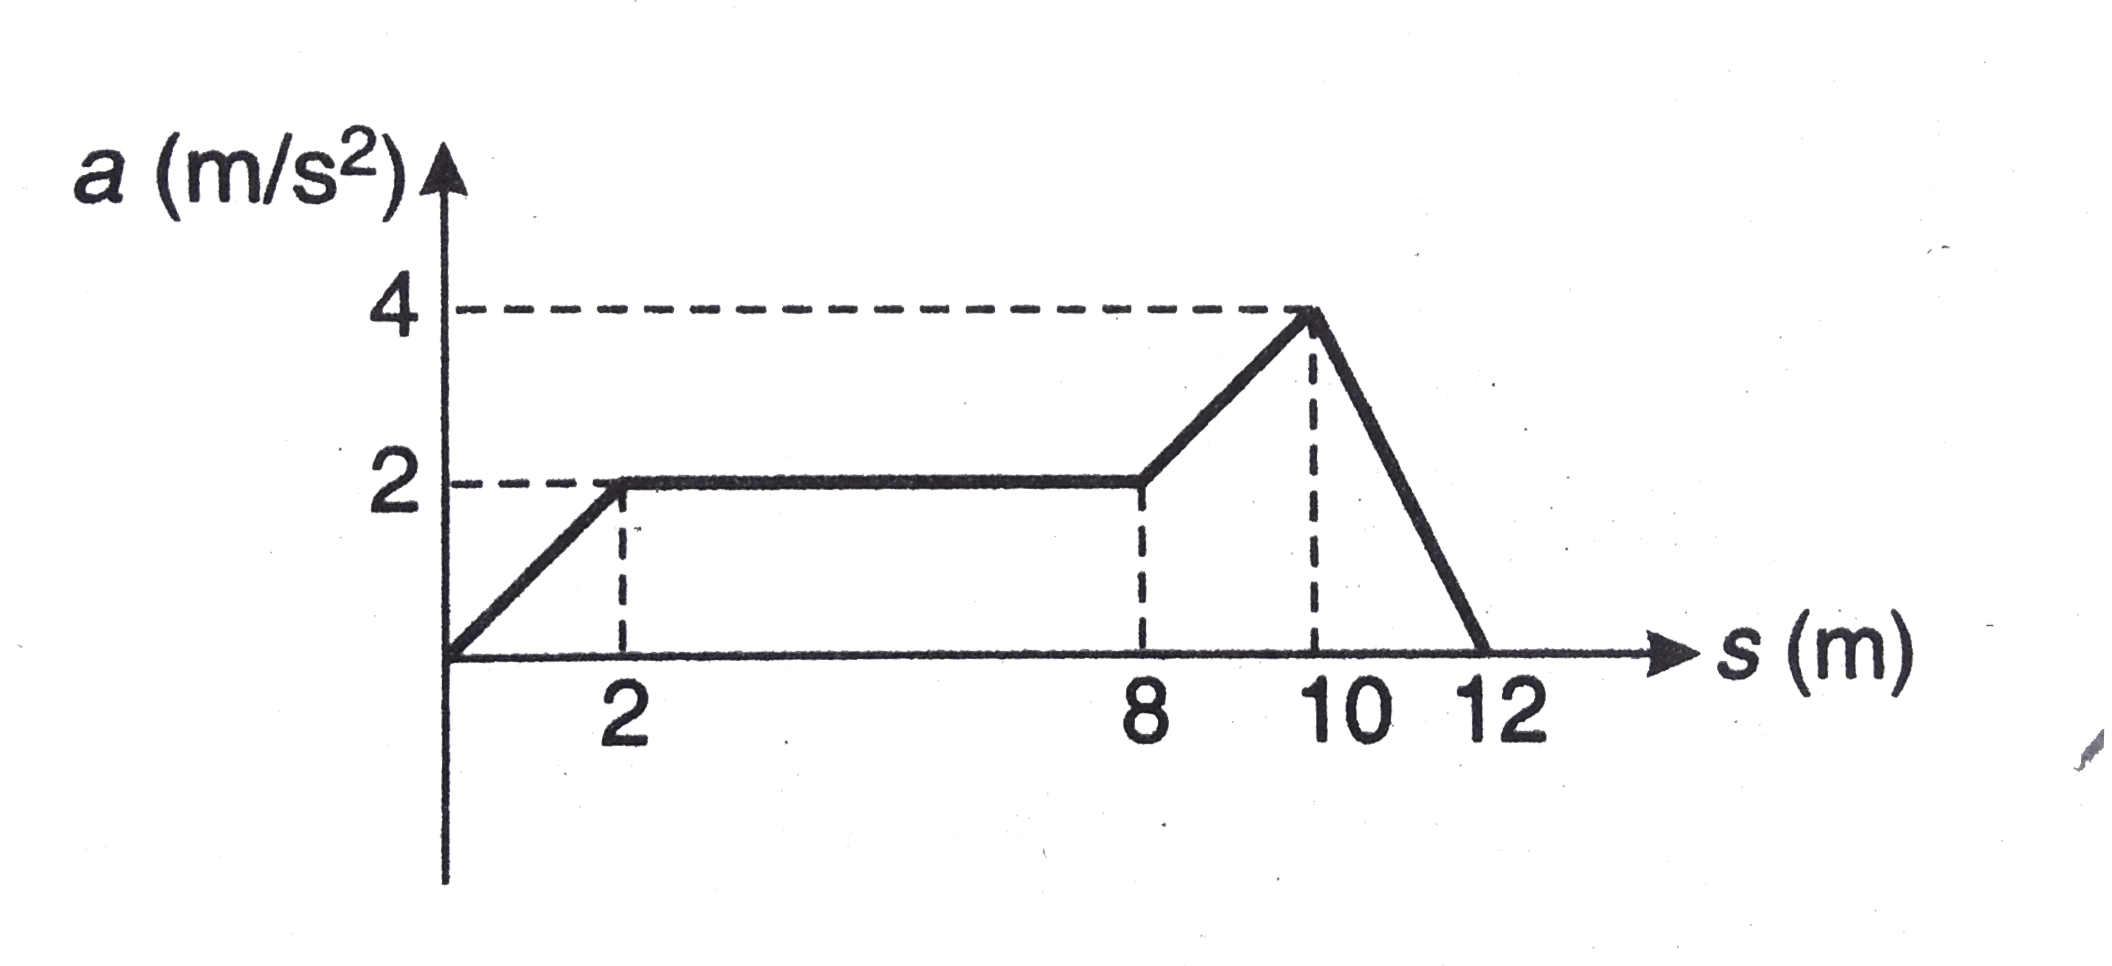
The acceleration-displacement graph of a particle moving in a straight line is as shown in figure, initial velocity of particle is zero. Find the velocity of the particle when displacement of the particle is s=12m.
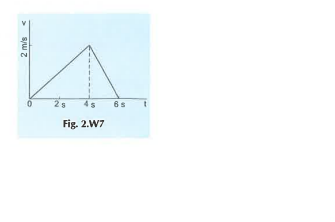
View SolutionThe velocity-time graph of a particle moving along a straight line is shown in Figure 2.W7.Is the motion uniform?
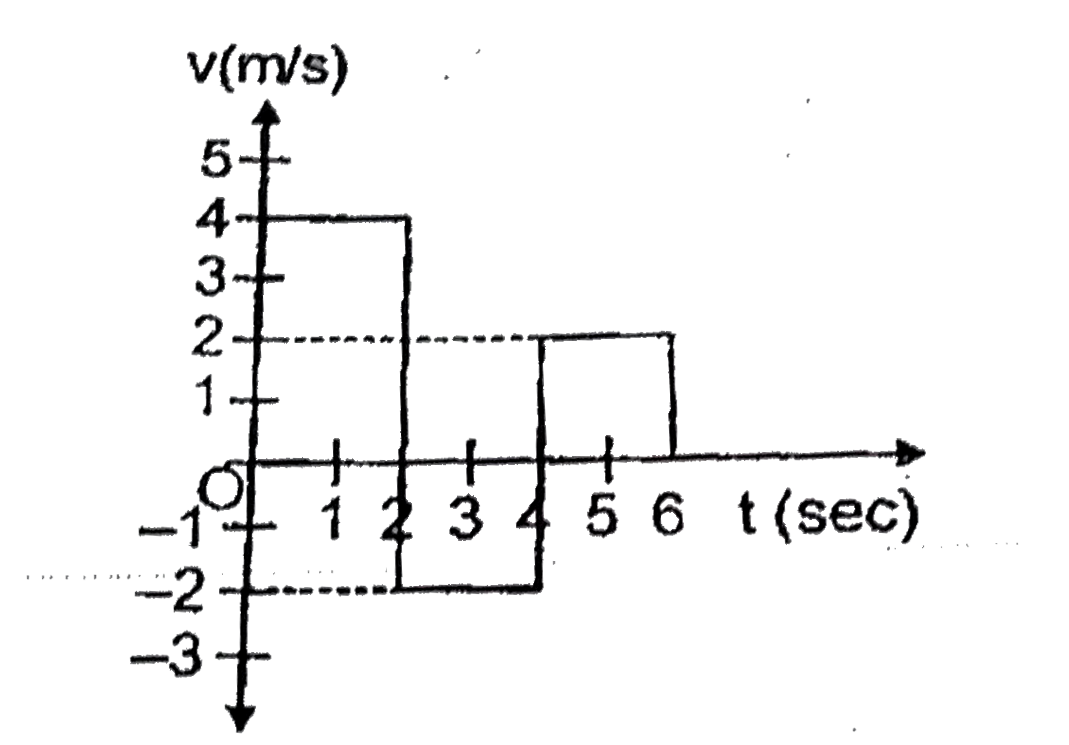
View SolutionThe velocity-time graph of a body moving in a straight line is shown in the figure.
View Solution
The velocity displacement graph of a particle moving along a straight line is shown in figure.
Then the acceleration displacement graph is.
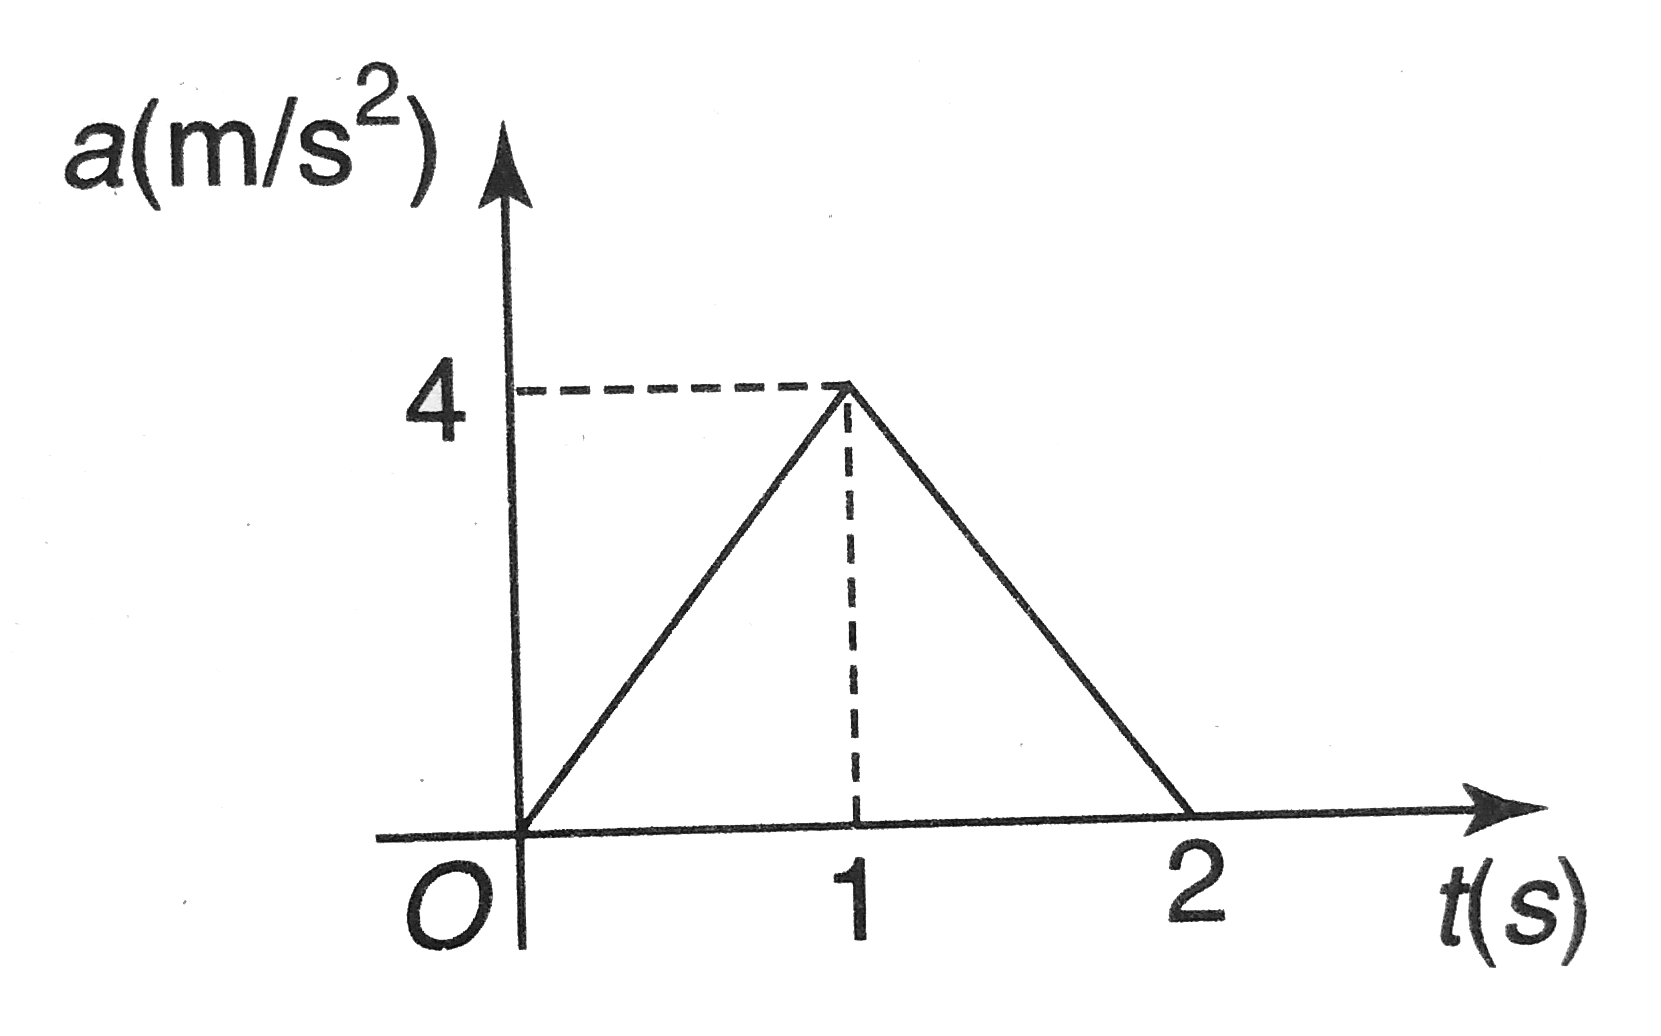
View SolutionThe acceleration-time graph of a particle moving in a straight line is as shown in figure. The velocity of the particle at time t=0 is 2m/s. The velocity after 2 seconds will be
View Solution
