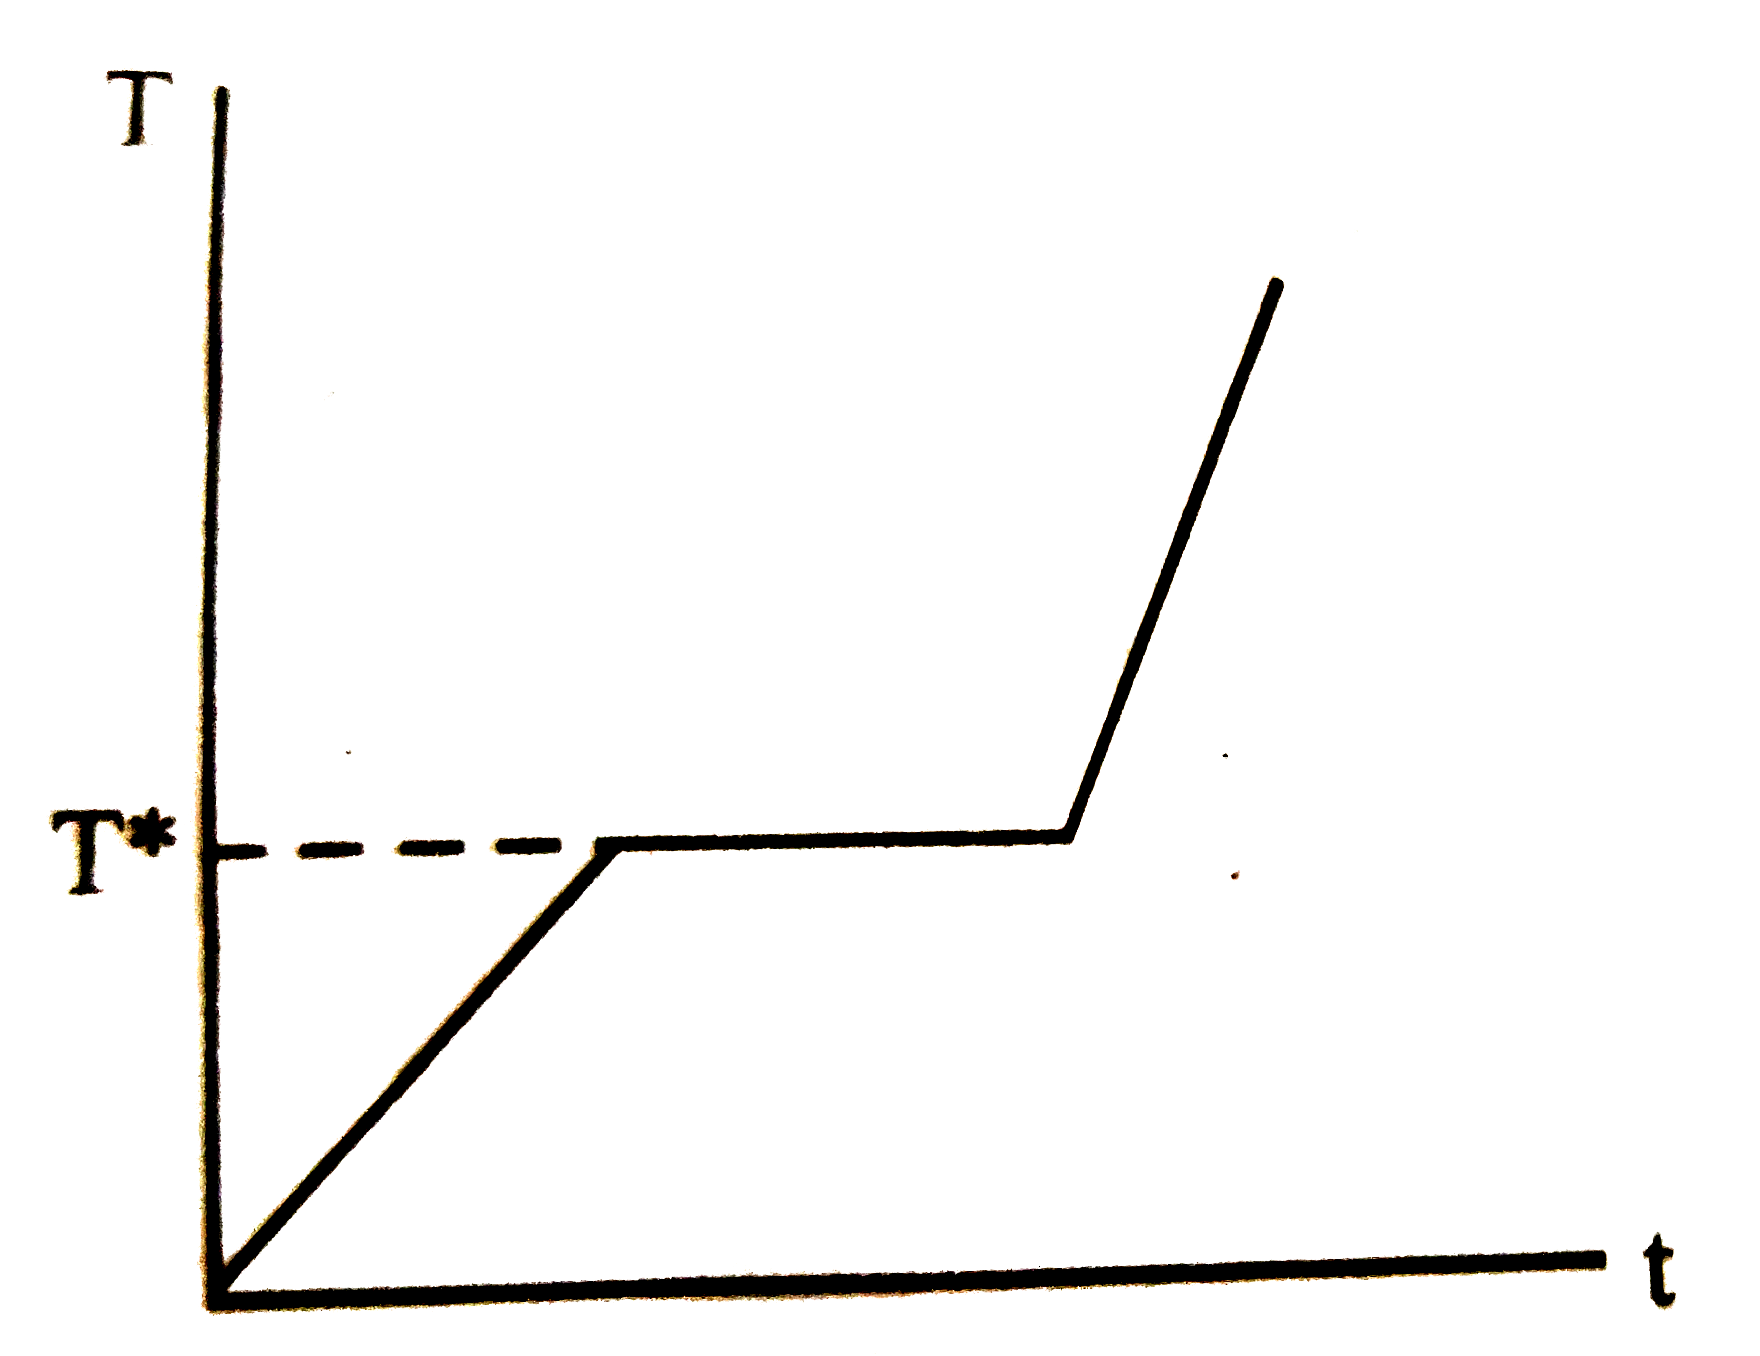
The figure given above shhows the tempreture (T)-time (t) plot when we start heating a piece of naphthalene . The temperature (T*) at the plateau of the curve signifies
boiling point ofnaphthalene
freezing point of naphthalene
melting point of naphthalene.
the temperature when naphthalene undergoes a chemical change upon heatmg.
The correct Answer is:C
The melting point of a substance is the temperature at which its state changes from solid to liquid. Melting point of naphthalene is 80.26∘C.
Topper's Solved these Questions
Similar Questions
Knowledge Check
- Question 1 - Select One or More
The figure shows the velocity (v) of a particle plotted against time (t).
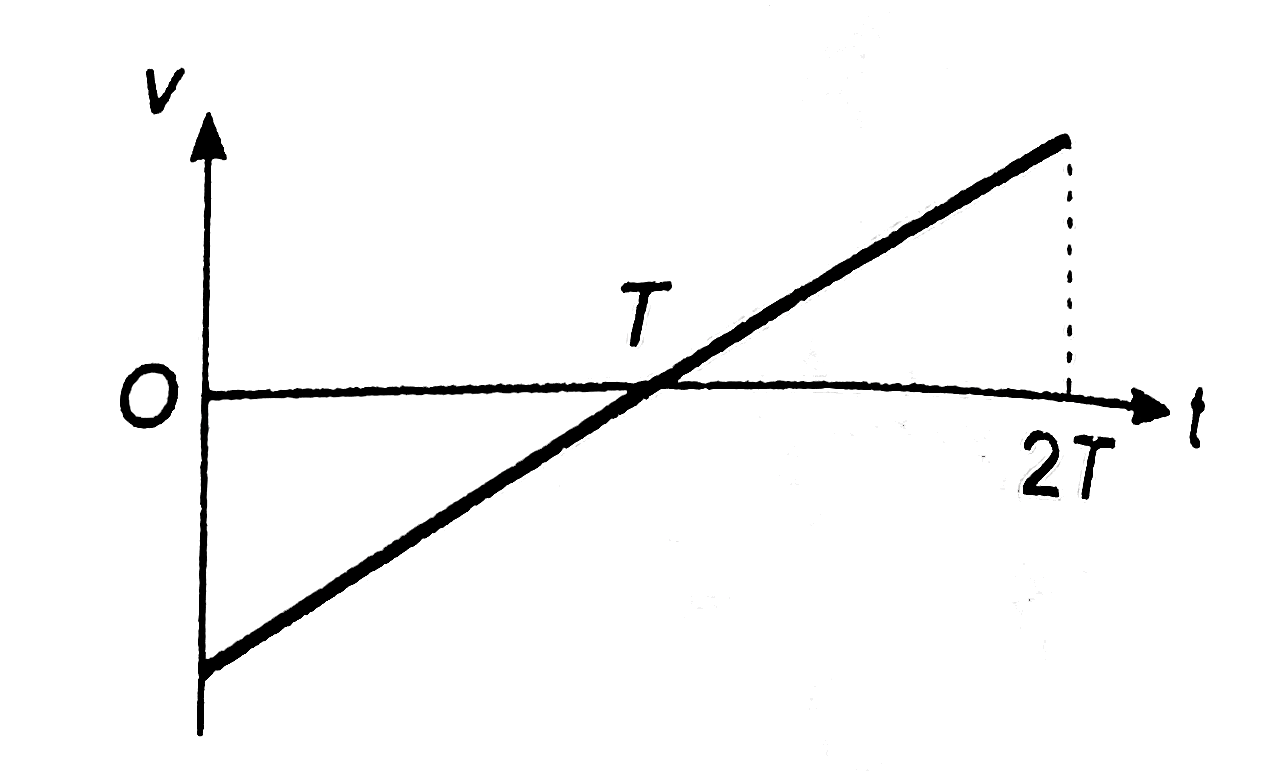 AThe particle changes its direction of motion at some point.BThe acceleration of the particle remains constantCThe displacement of the particle is zeroDThe initial and final speeds of the particle are the same
 - Question 2 - Select One
If the temperature of the body θ and time of cooling 't' and room temperature of the surrounding θ0. The cooling curve is
A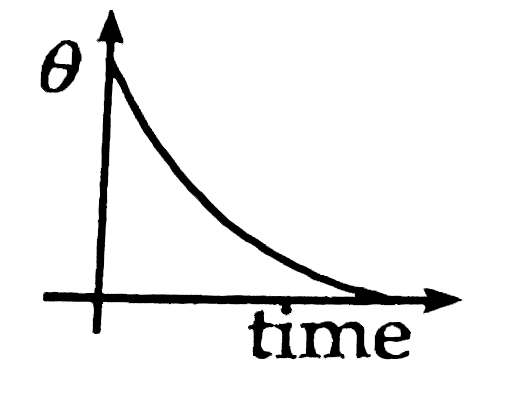 B
B C
C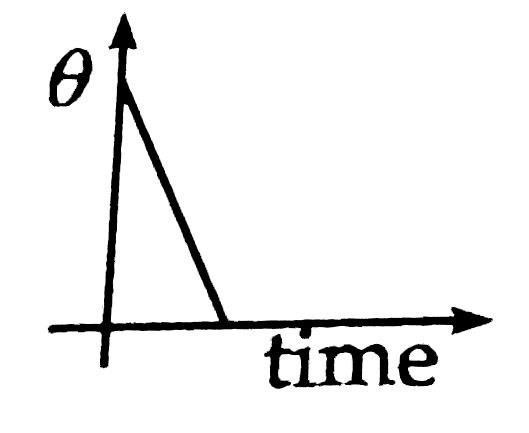 D
D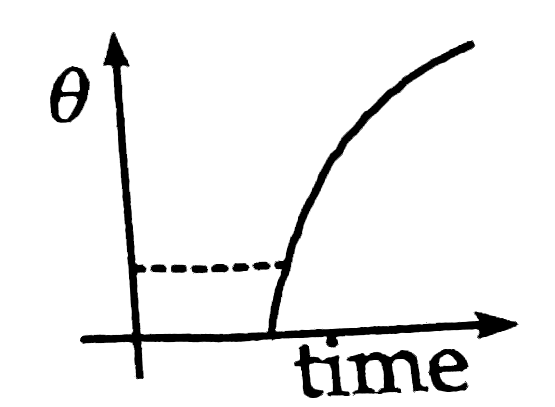
- Question 3 - Select One
Plots showing the variation of the rate constant (k) with temperature (T) are given below. The plot that follows the Arrhenius equation is
A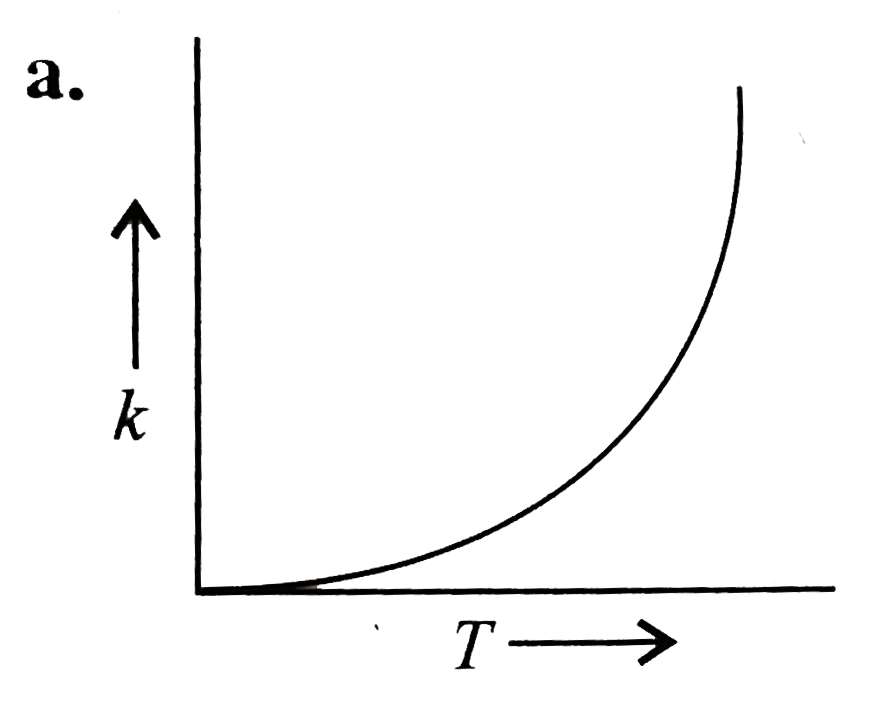 B
B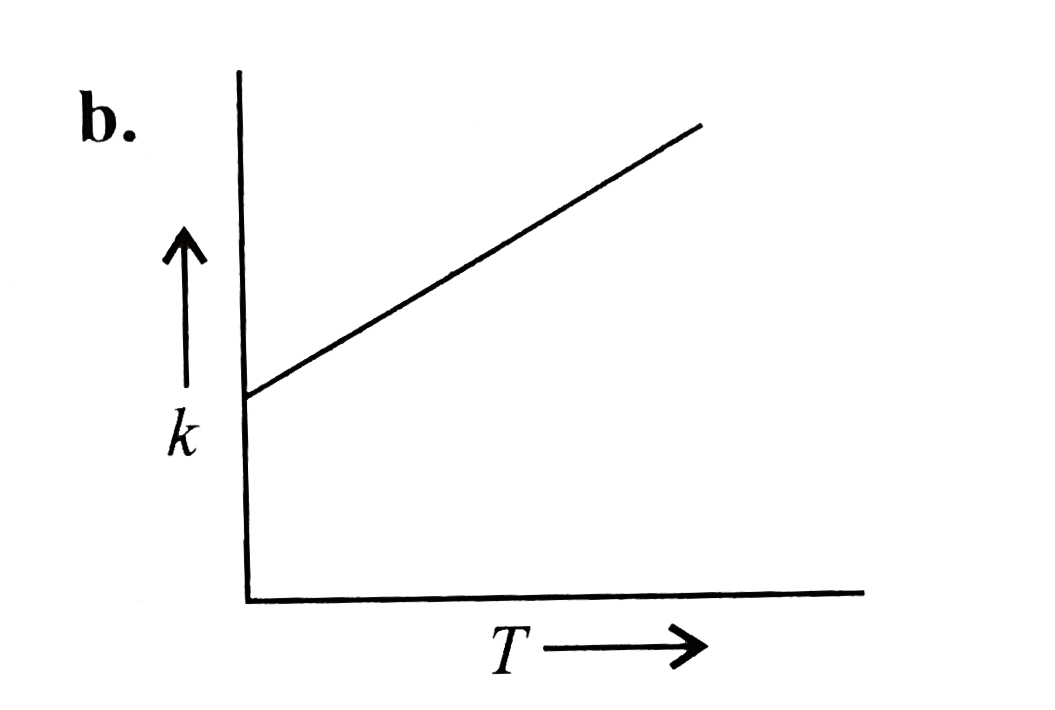 C
C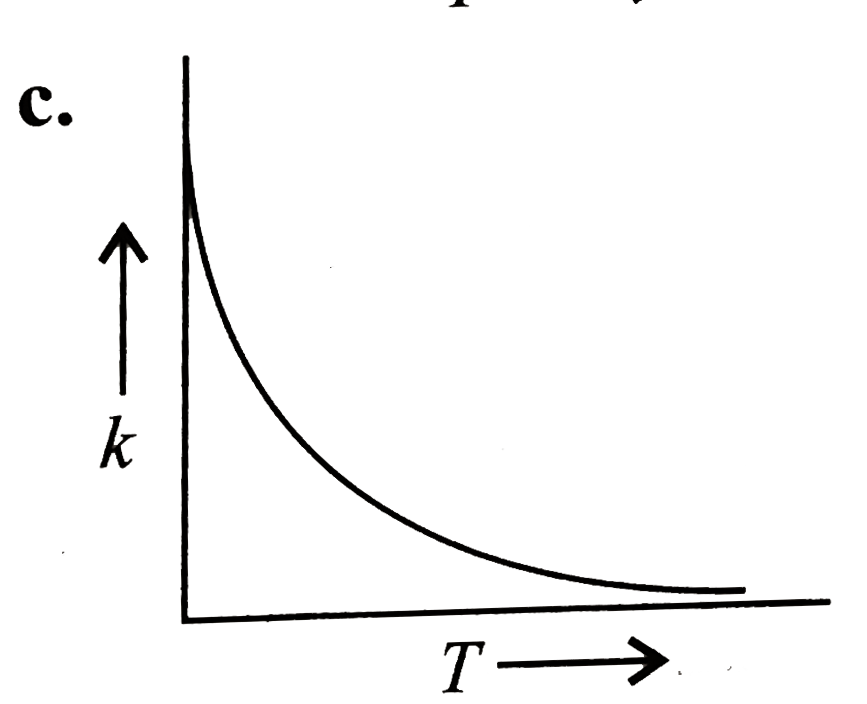 D
D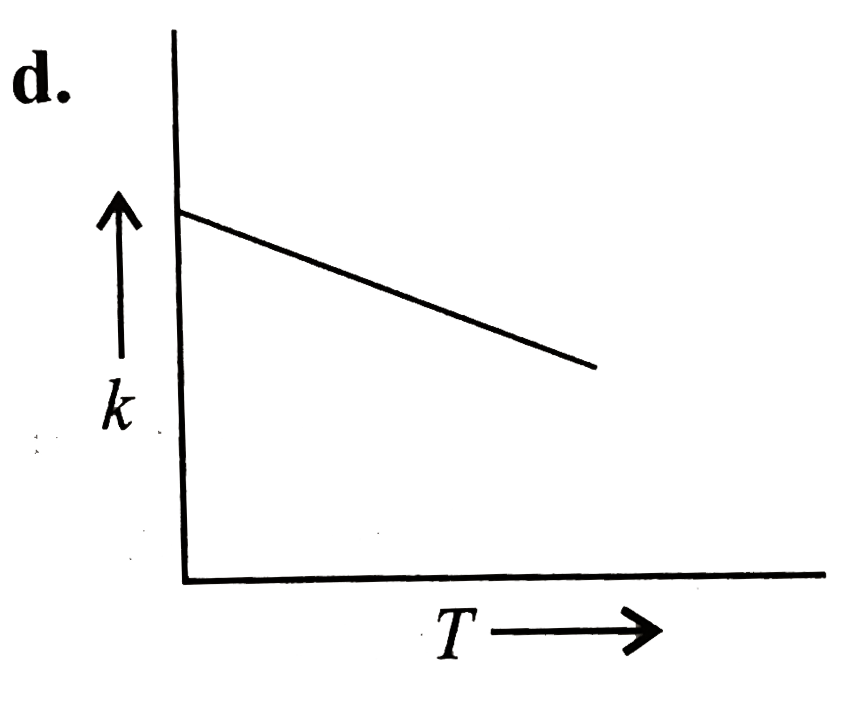
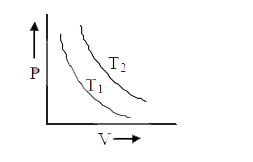
Two curves are given at temperatures T1andT2 in an isothermal process, then-
 View Solution
A cylindrical conductor has a resistance R. When the conductor is at a temperature (T) above its surrounding temperature (T0), the ratio of thermal power dissipated by the conductor to its excess temperature (ΔT=T–T0) above surrounding is a known constant k. The conductor is connected to a cell of emf V. Initially, the conductor was at room temperature T0. Mass and specific heat capacity of the conductor are m and s respectively.
(i) find the time (t) dependence of the temperature (T) of the conductor after it is connected to the cell. Assume no change in resistance due to temperature.
(ii) find the temperature of the conductor after a long time.View Solution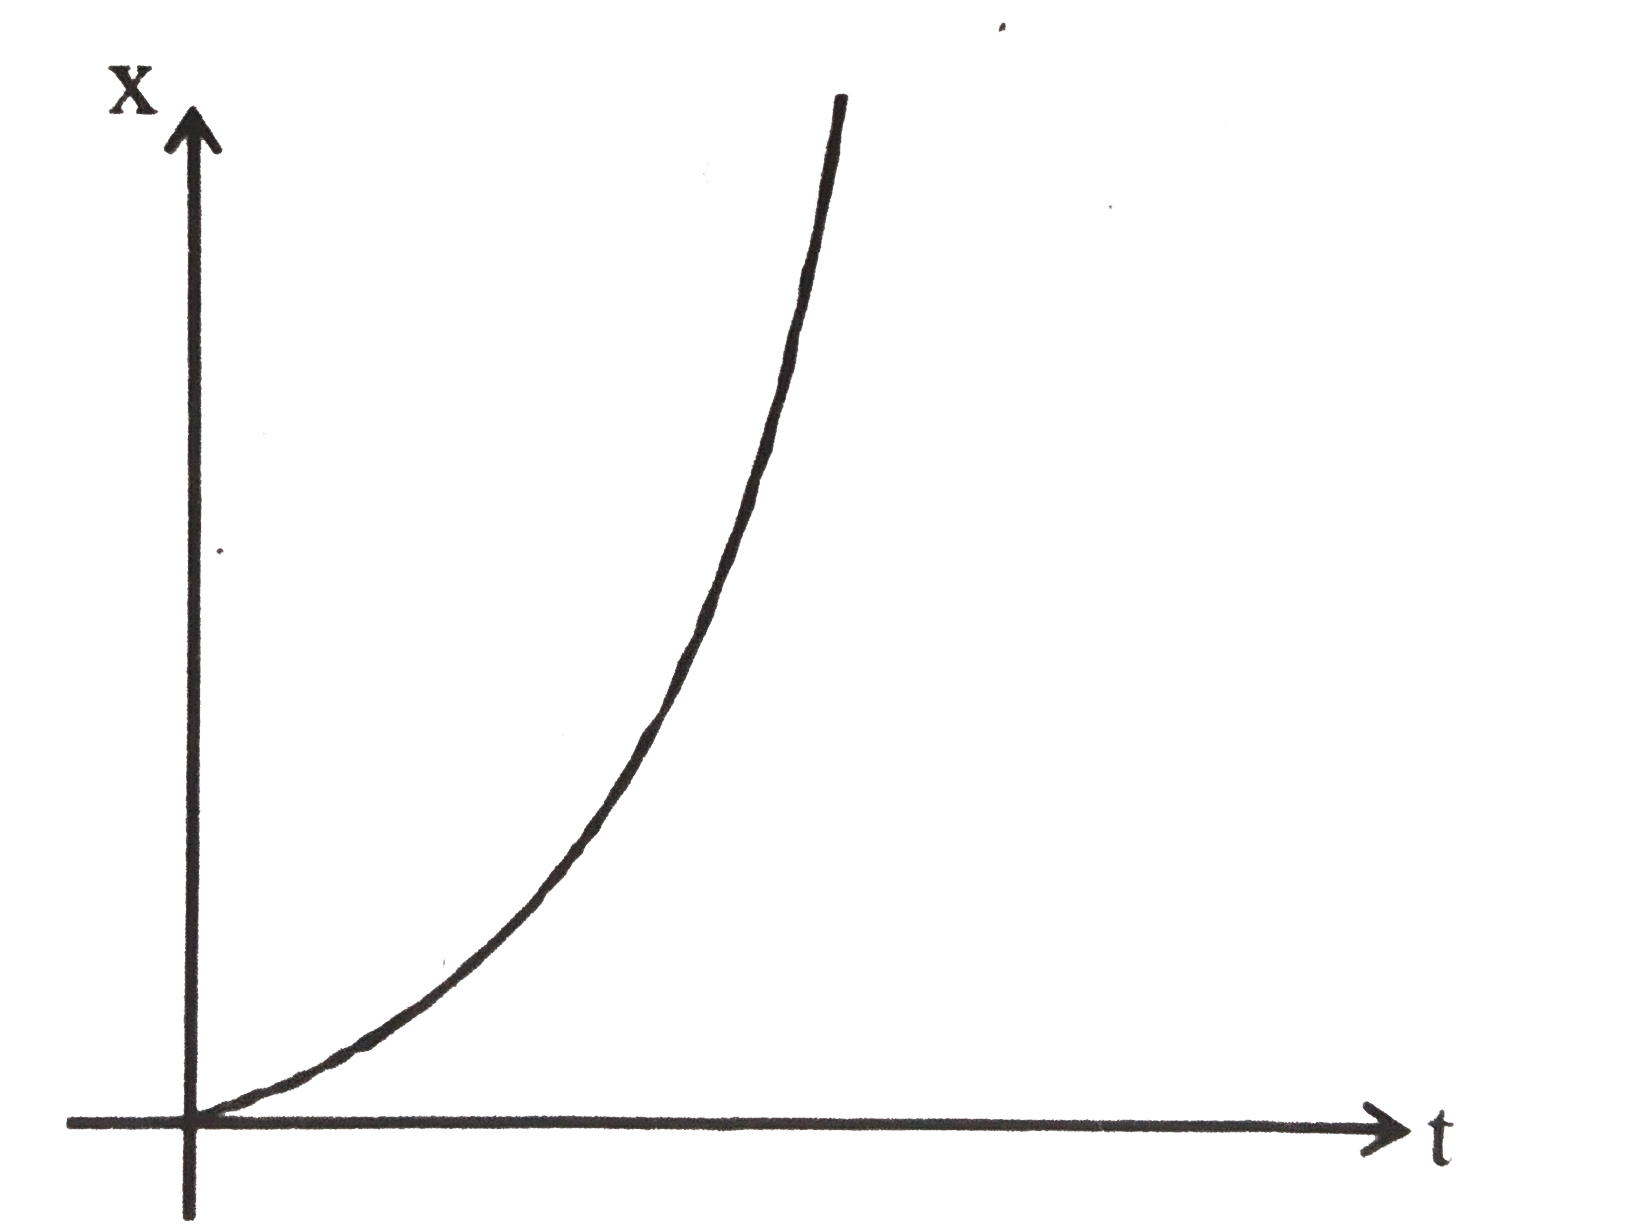
The plot given above represents displacement 'x' of a particle with time 't'. The particle isView SolutionIf a piece of metal is heated to temperature θ and the allowed to cool in a room which is at temperature θ0, the graph between the temperature T of the metal and time t will be closet to
View SolutionPlots showing the variation of the rate constant (k) with temperature (T) are given below. The plot that follows the Arrhenius equation is
View Solution


