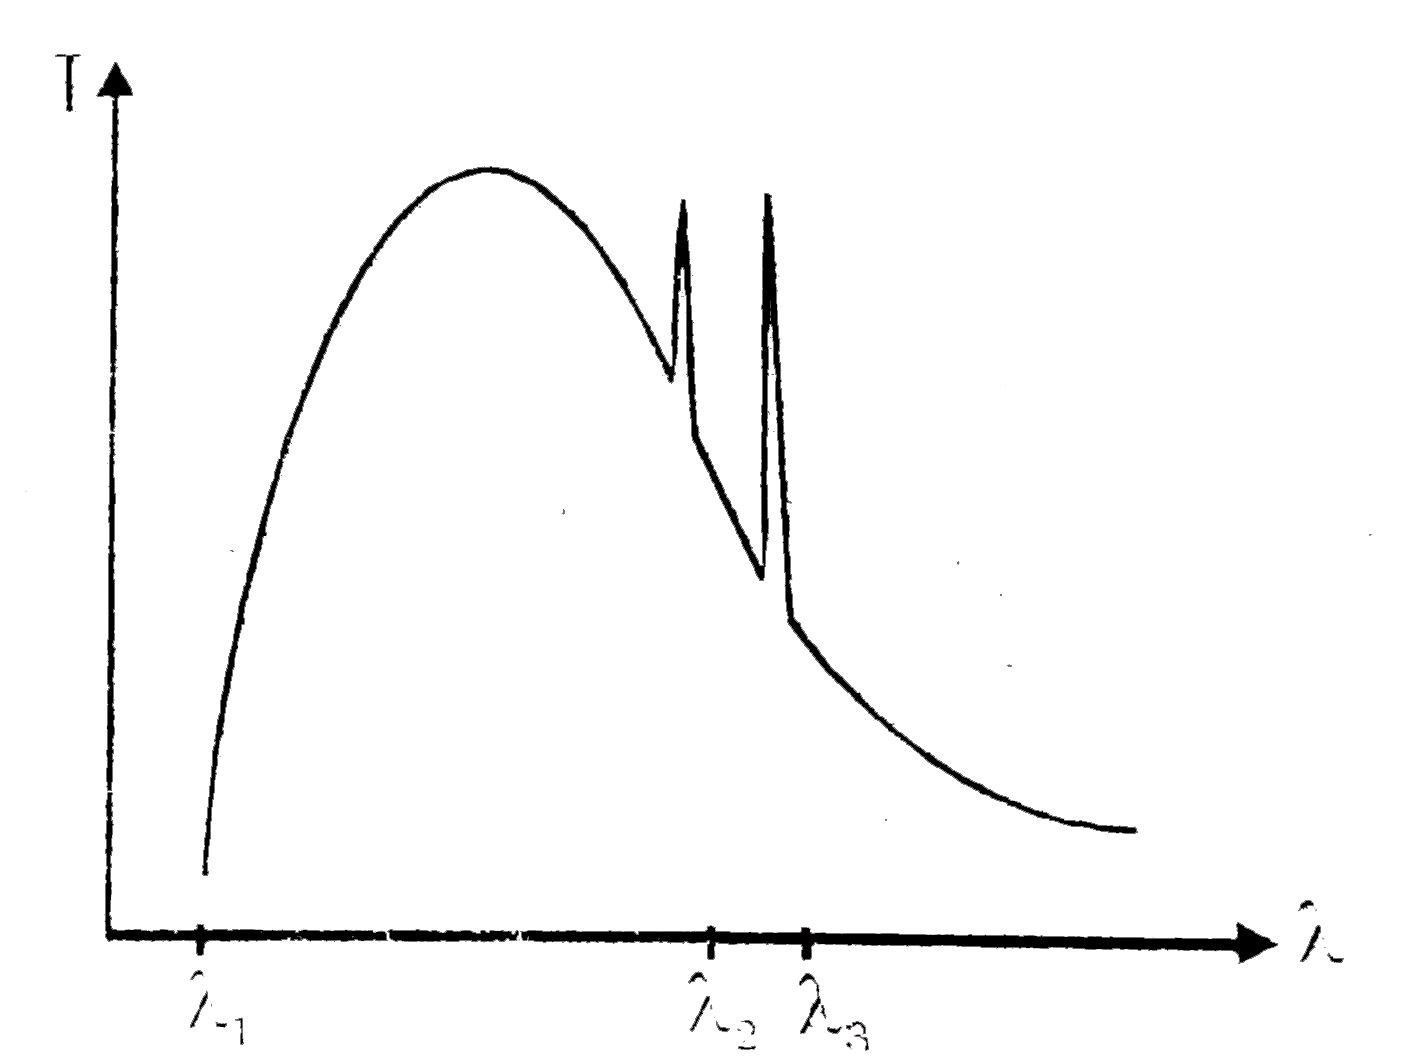
The figure represents the observed intensity of X - rays emitted by an X - ray tube as a function of wavelength . The sharp peaks A and B denote

A
Band spectrum
B
Continuous spectrum
C
Characteristic radiations
D
White radiations
Video Solution
Text Solution
The correct Answer is:C
In X - ray spectra , depending on the accelerating voltage and the target element , we may find sharp peaks super imposed on continuous spectrum. These are at different wavelengths for different elements . They form characteristic X - ray spectrum.
|
Topper's Solved these Questions
- DUAL NATURE OF RADIATION AND MATTERBOOK - A2ZCHAPTER - DUAL NATURE OF RADIATION AND MATTEREXERCISE - Problems Based On Mixed Concepts
42 Videos
- DUAL NATURE OF RADIATION AND MATTERBOOK - A2ZCHAPTER - DUAL NATURE OF RADIATION AND MATTEREXERCISE - Section B - Assertion Reasoning
18 Videos
- DUAL NATURE OF RADIATION AND MATTERBOOK - A2ZCHAPTER - DUAL NATURE OF RADIATION AND MATTEREXERCISE - Photo Electric Effect
61 Videos
- CURRENT ELECTRICITYBOOK - A2ZCHAPTER - CURRENT ELECTRICITYEXERCISE - Section D - Chapter End Test
29 Videos
- ELECTRIC CHARGE, FIELD & FLUXBOOK - A2ZCHAPTER - ELECTRIC CHARGE, FIELD & FLUXEXERCISE - Section D - Chapter End Test
29 Videos
Similar Questions
Knowledge Check
The shorted wavelength of X- rays emitted from an X- rays tube depends on
Athe currect in the tubeBthe vollage applied to the tubeCthe nuture of the gas in tubeDthe atomic number of the target materialX-rays are emitted during
Aα, n reactionBK-captureCn,α reactionDβ-emissionIntensity of x-rays coming from an x-ray tube is plotted against wavelength as shown:-
 AIf accelerating potential is changed keeping target same, then sharp peaks (λ2&λ3) will shift to new position.BIf accelerating potential is changed keeping the target same, then minimum wavelength of spectrum (λ1) will shift to new locationCIn the radiation coming out of the tube photons corresponding to wavelength λ3 will have more energy than those corresponding to λ2DIn the radiation coming out of the tube number of photons corresponding to wavelength λ3 will be more in number than number of photons corresponding to λ2
The X- rays beam coming from an X- rays tube will be
View SolutionThe minimum wavelength of X-ray emitted by X-rays tube is 0.4125 Å. The accelerating voltage is
View SolutionFind the minimum wavelngth of X - ray emitted by X - ray tube , which is operating at 15kV accelerating voltage.
View SolutionAn X-ray tube is operated at 20 kV. The cut off wavelength is
View SolutionIn an X-ray tube, the intensity of the emitted X-ray beam is increased by
View Solution
