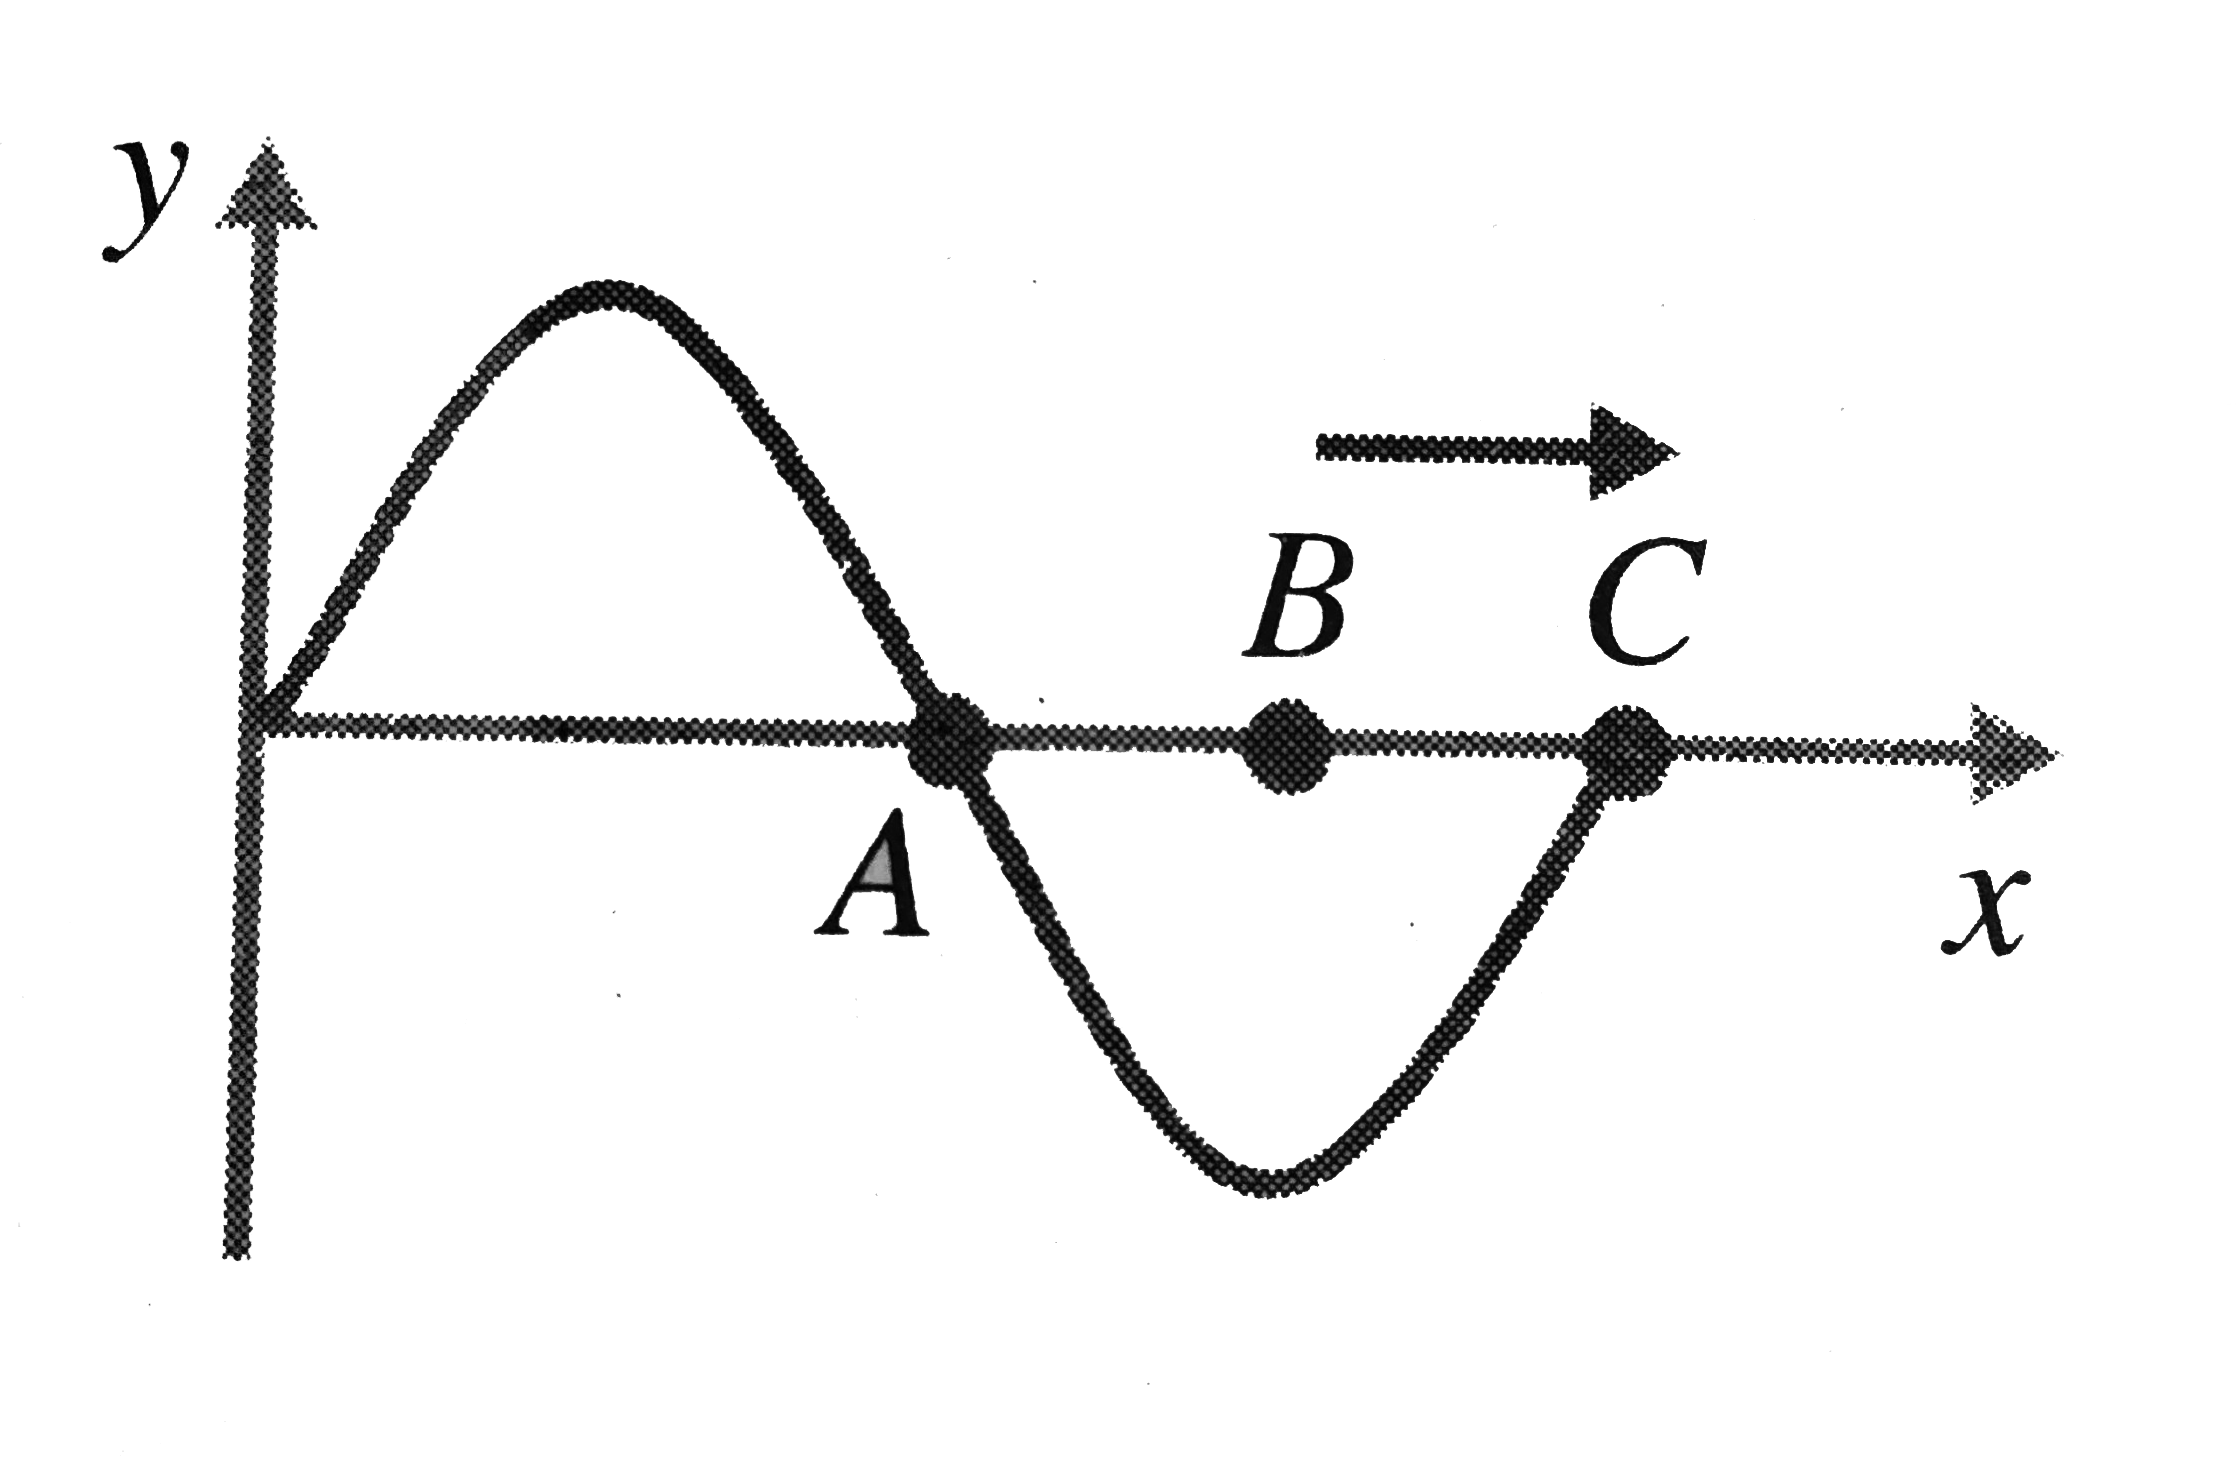
The figure shows an instantaneous displacement position graph of a sound wave travelling along the positive x-axis Identify the points of
i.Maximum pressure,
ii. Minimum pressure and
iii. Atmospheric pressure (or normal pressure.)
(i) A, (ii) C, (iii)B
(i) A, (ii) B, (iii)C
(i) B, (ii) A, (iii)C
(i) B, (ii) C, (iii)A
The correct Answer is:A

i. Maximum pressure occurs at A because air particles are displaced towards it.
ii. Minimum pressure occurs at C because air particles are displaced away from it.
iii. Pressure remains atmospheric at B.
Topper's Solved these Questions
- SOUND WAVES AND DOPPLER EFFECTBOOK - CENGAGE PHYSICSCHAPTER - SOUND WAVES AND DOPPLER EFFECTEXERCISE - Examples
56 Videos
- SOUND WAVES AND DOPPLER EFFECTBOOK - CENGAGE PHYSICSCHAPTER - SOUND WAVES AND DOPPLER EFFECTEXERCISE - Exercise 6.1
56 Videos
- RIGID BODY DYNAMICS 2BOOK - CENGAGE PHYSICSCHAPTER - RIGID BODY DYNAMICS 2EXERCISE - Interger
2 Videos
- SUPERPOSITION AND STANDING WAVESBOOK - CENGAGE PHYSICSCHAPTER - SUPERPOSITION AND STANDING WAVESEXERCISE - Comprehension Type
5 Videos
Similar Questions
Knowledge Check
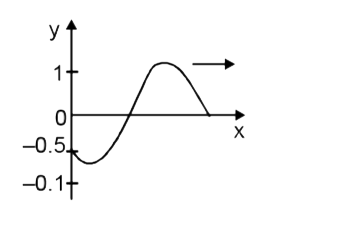
the equation of a wave travelling along the positive x - axis ,as shown in figure at t = 0 is given by
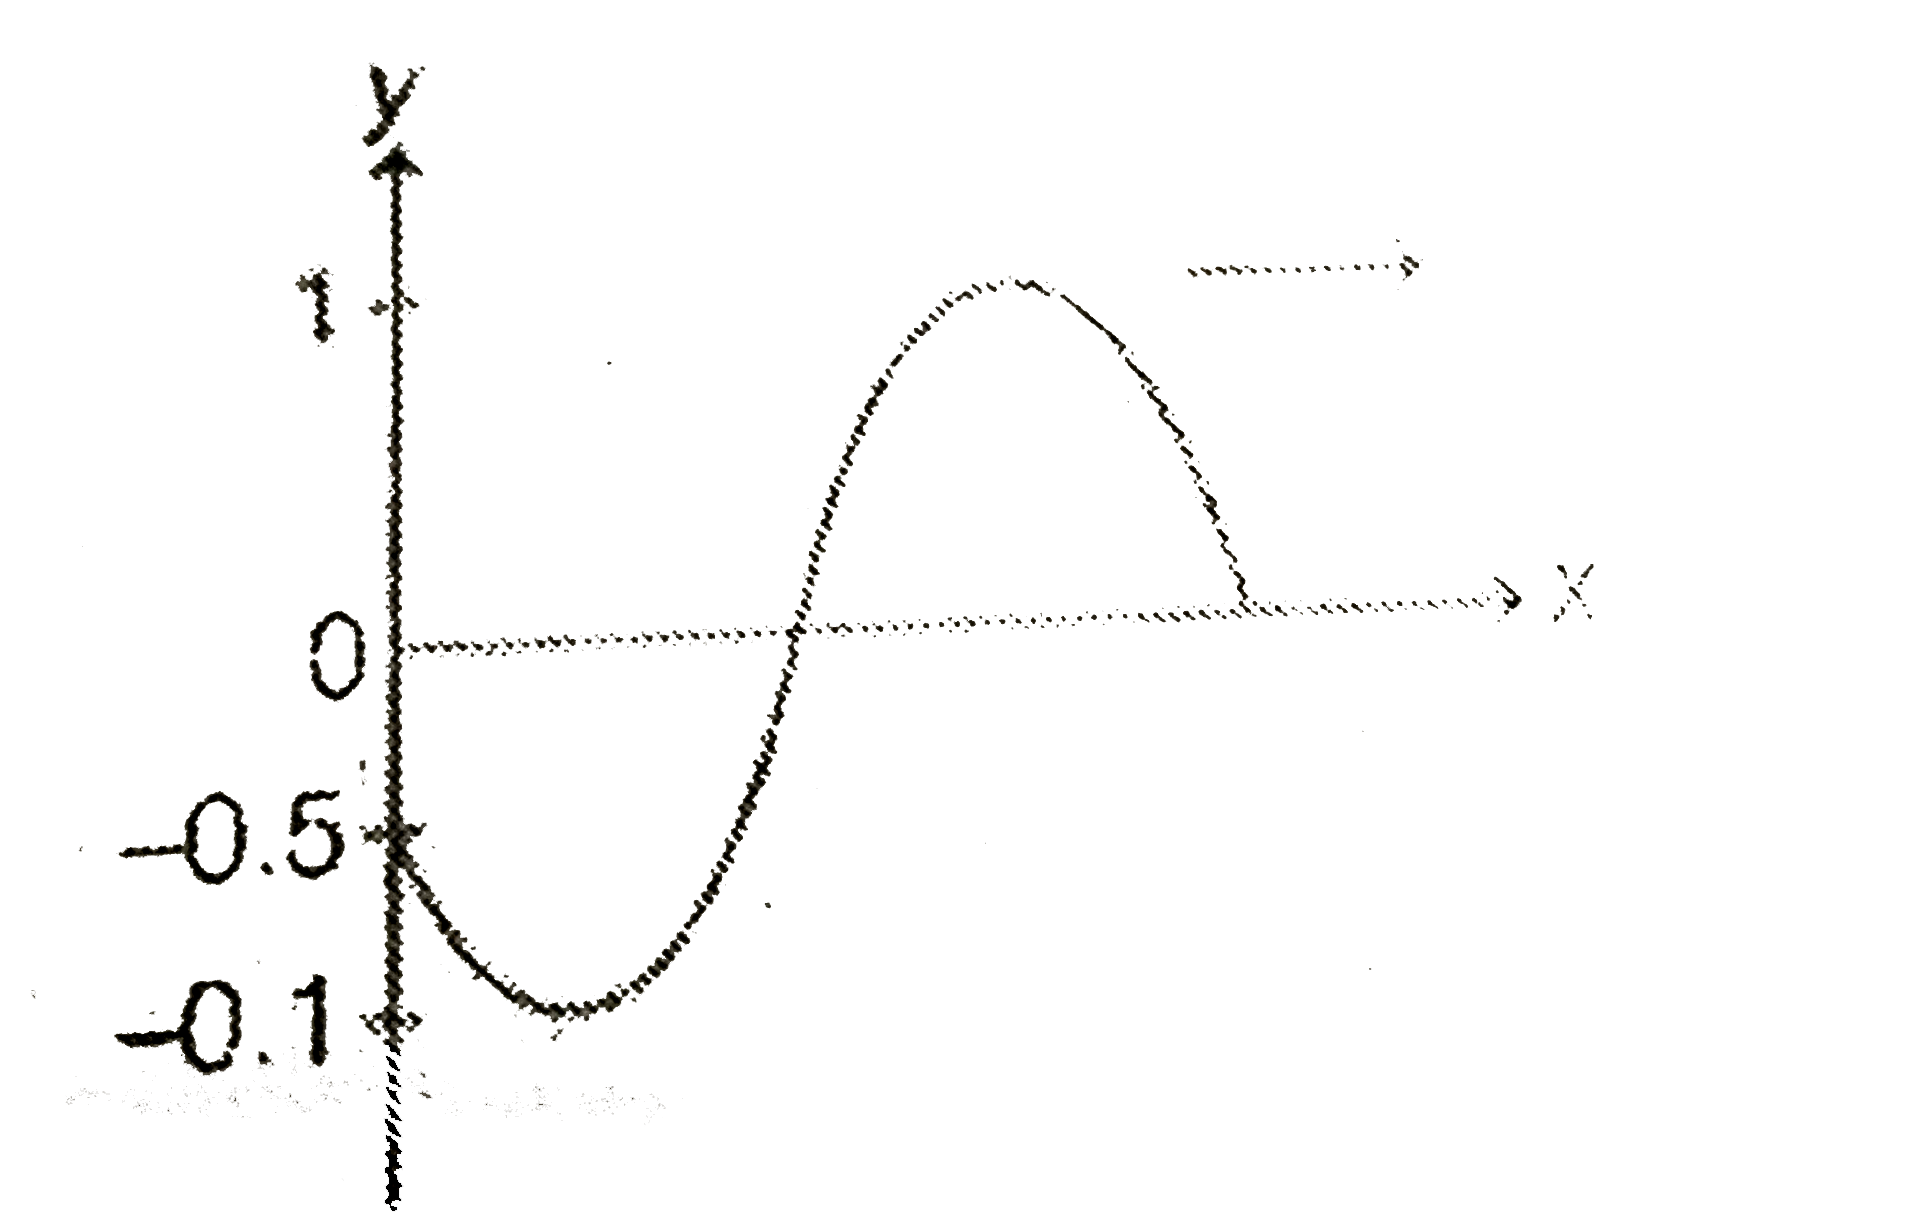 Asin(kx−ωt+π6)Bsin(kx−ωt−π6)Csin(ωt−kx+π6)Dsin(ωt−kx−π6)
The equation of a wave travelling along the positive x-axis, as shown in figure at t=0 is given by :-
_E01_059_Q01.png) .Asin(kx−ωt+π6)Bsin(kx−ωt−π6)Csin(ωt−kx+π6)Dsin(ωt−kx−π6)
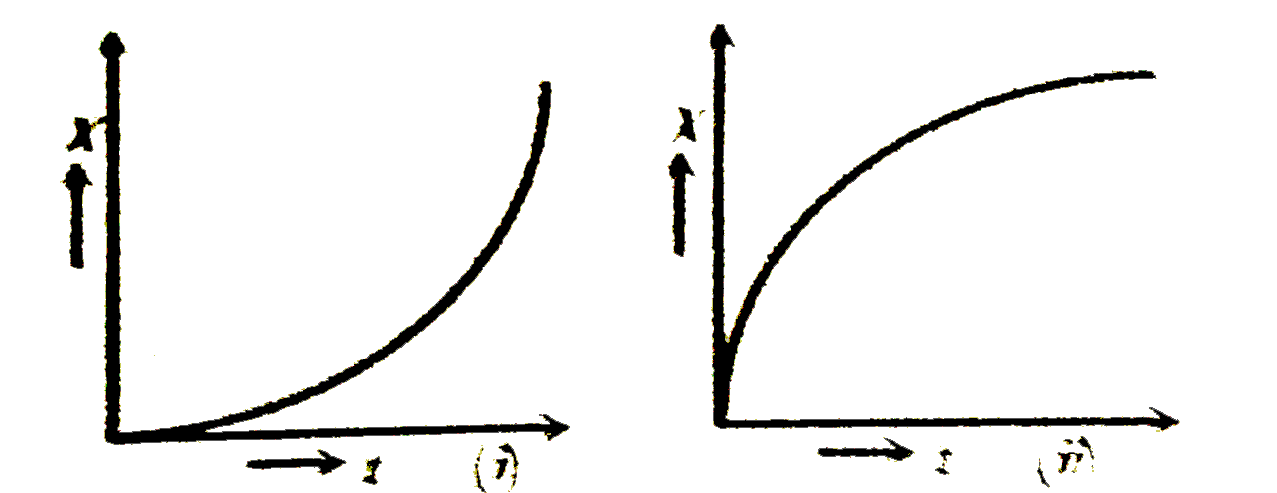
.Asin(kx−ωt+π6)Bsin(kx−ωt−π6)Csin(ωt−kx+π6)Dsin(ωt−kx−π6)Figure (i) and (i) show the displacement-time graphs of two particles moving along the x-axis. We can say that
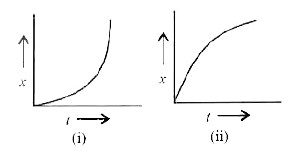 Aboth the particles are having a uniformly retarded motionBboth the particles are having a uniformly acceleraled motionCParticle (1) is having a uniformly accelerated motion while particle (i) is having a uniformly retarded motionDParticle (i) is having a uniformly retarded motion while particle (ii) is having a uniformly accelerated motion
How are the following measured ?
(i) atmospheric pressure (ii) pressure of a gas.
View SolutionThe figure represents the instantaneous picture of a longitudinal harmonic wave travelling along the negative x-axis. Identify the correct statement related to the movement of the points shown in the figure.
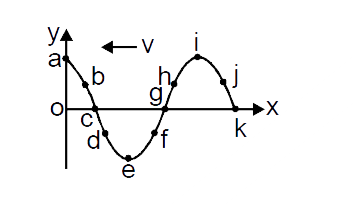
The points of maximum rarefaction are
View SolutionThe figure represents the instantaneous picture of a longitudinal harmonic wave travelling along the negative x-axis. Identify the correct statement related to the movement of the points shown in the figure.
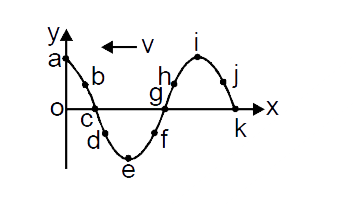
The stationary points are
View SolutionThe figure represents the instantaneous picture of a longitudinal harmonic wave travelling along the negative x-axis. Identify the correct statement related to the movement of the points shown in the figure.
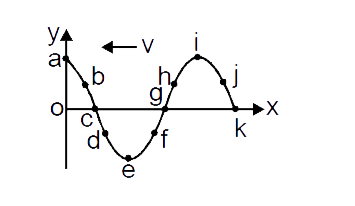
The maximum displaced points are
View SolutionFigures (i) and (ii) below show the displacement-time graphs of two particles moving along the x -axis. We can say that
View Solution

