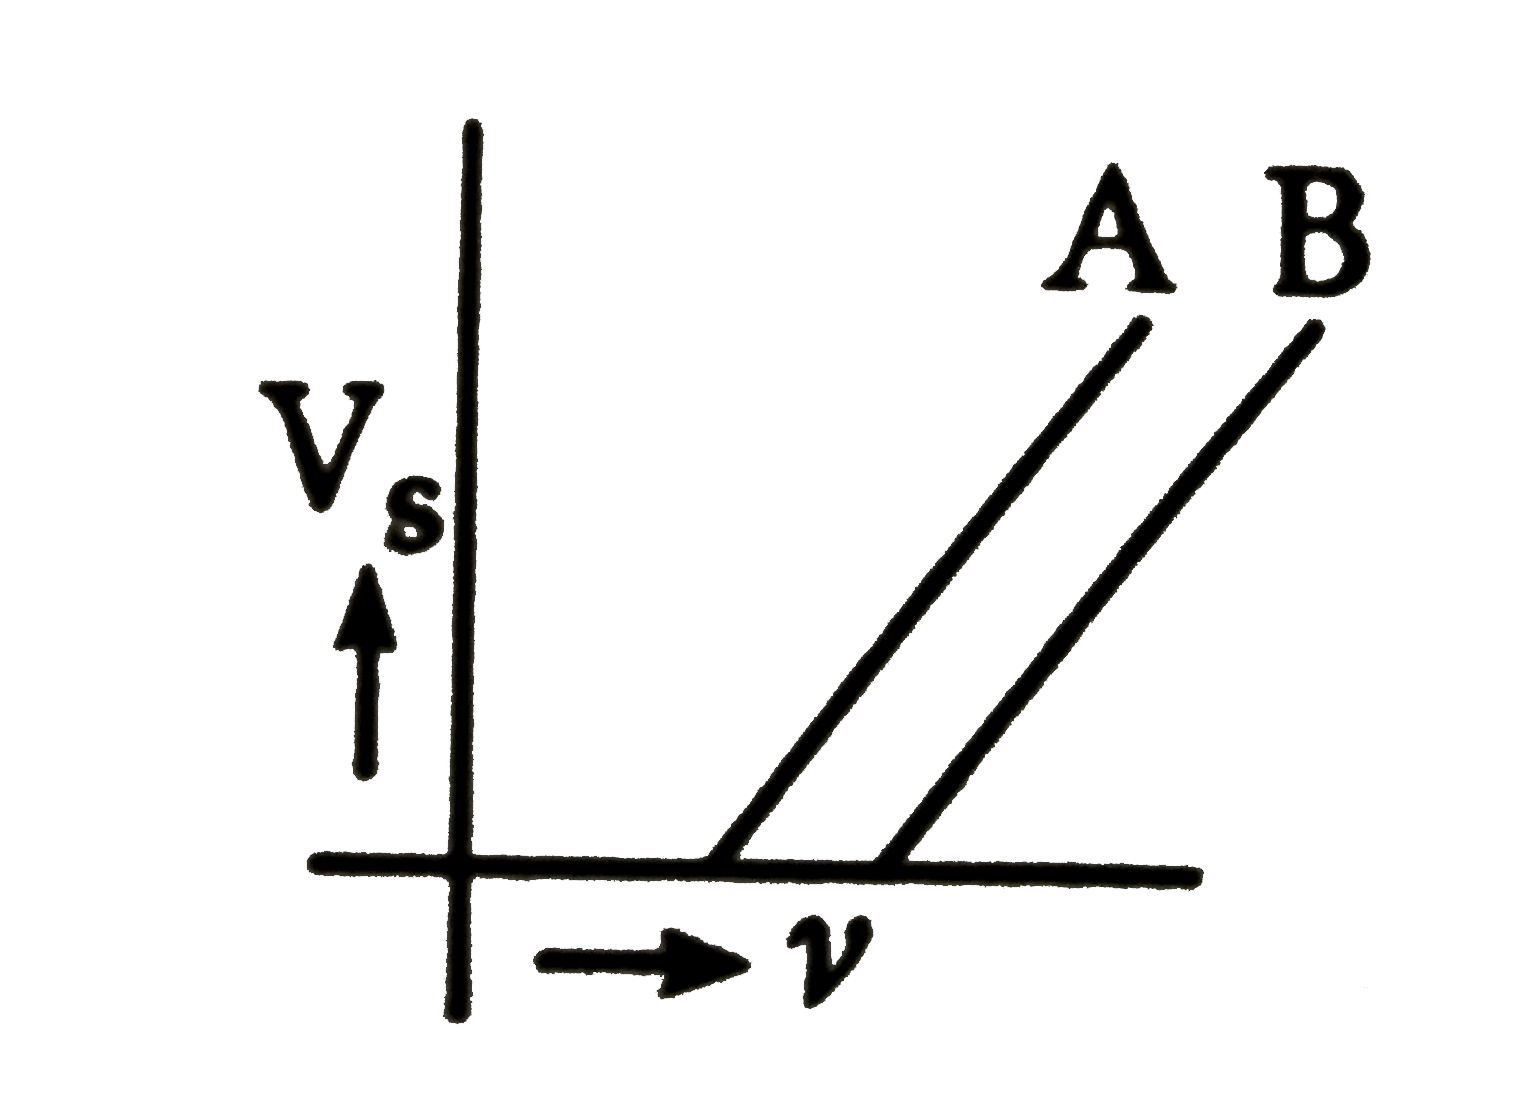
The figure shows stopping potential Vs and frequency υ for two different metallic surfaces A and B. The work function of A , as compared to that of B is

less
more
equal
nothing can be said
The correct Answer is:A
The value of threshold frequency υ0 for A is less than that for B hence ϕA<ϕB
Topper's Solved these Questions
- DUAL NATURE OF MATTER AND RADIATION BOOK - MTG GUIDECHAPTER - DUAL NATURE OF MATTER AND RADIATION EXERCISE - NEET Cafe Topicwise Practice Questions (PARTICLE NATURE OF LIGHT (THE PHOTON)
17 Videos
- DUAL NATURE OF MATTER AND RADIATION BOOK - MTG GUIDECHAPTER - DUAL NATURE OF MATTER AND RADIATION EXERCISE - NEET Cafe Topicwise Practice Questions (MATTER WAVES AND DE BROGLIE RELATION)
39 Videos
- DUAL NATURE OF MATTER AND RADIATION BOOK - MTG GUIDECHAPTER - DUAL NATURE OF MATTER AND RADIATION EXERCISE - AIPMT/ NEET MCQs
30 Videos
- CURRENT ELECTRICITY BOOK - MTG GUIDECHAPTER - CURRENT ELECTRICITY EXERCISE - MCQs AIPMT / NEET
32 Videos
- ELECTROMAGNETIC INDUCTION AND ALTERNATING CURRENTSBOOK - MTG GUIDECHAPTER - ELECTROMAGNETIC INDUCTION AND ALTERNATING CURRENTSEXERCISE - AIPMT/NEET MCQS
31 Videos
Similar Questions
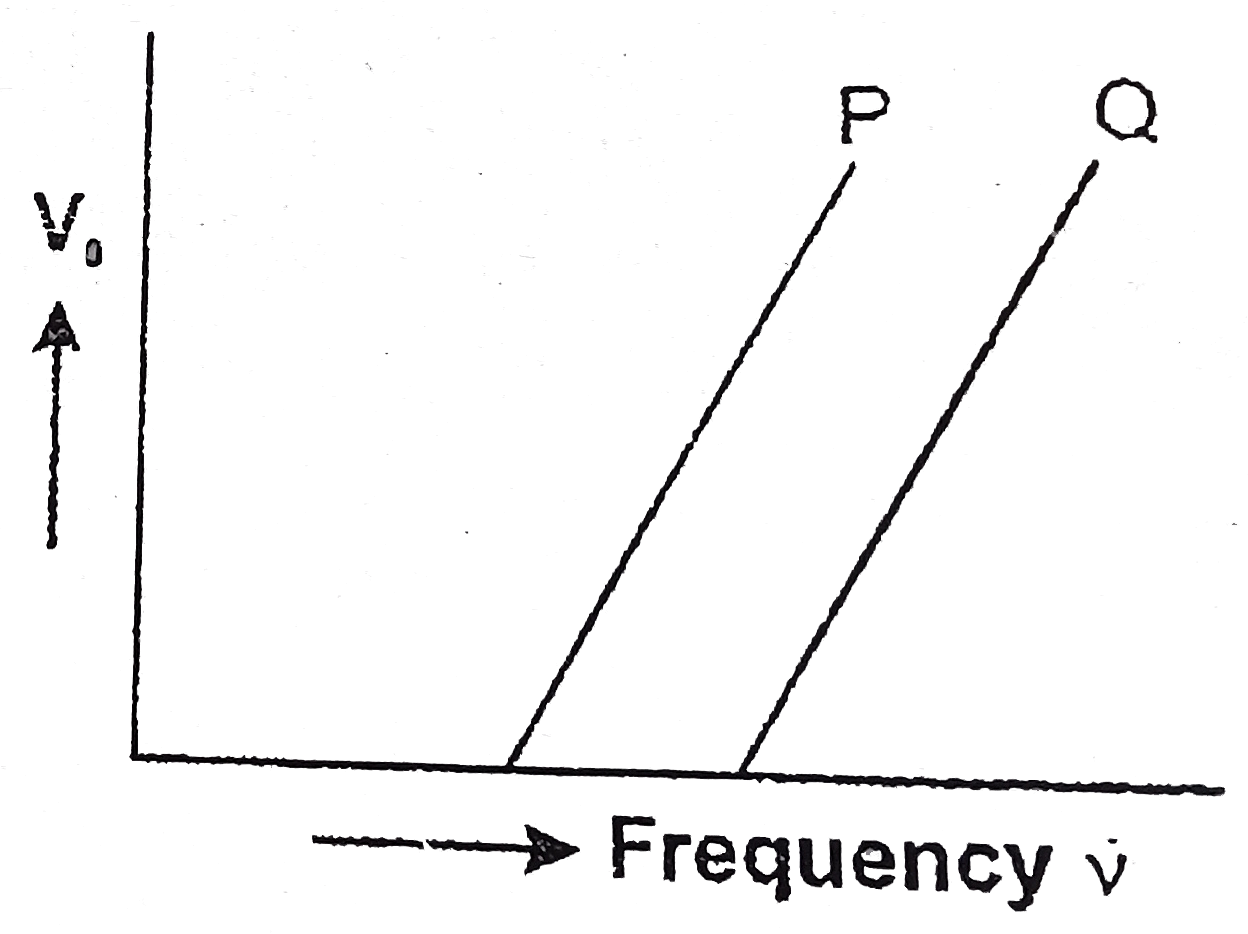
The graph between the stopping potential V0 and frequency v for two different metal plates P and Q are shown in the figure. Which of the metals has greater threshold wavelength and work function.

View SolutionThe graph between the stopping potential V0 and frequency v for two different metal plates P and Q are shown in the figure. Which of the metals has greater threshold wavelength and work function.

View Solution
Knowledge Check
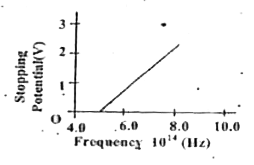
The stopping potential vs frequency plot for a substance is shown in the figure. The work function of the substance is
 A3.331 eVB4.02 eVC2.07 eVD3.02e V
Figure shows the graph of stopping potential verus that frequency of a photosensitive metal. The plank's constant and work funcation of the metal are
_S01_035_Q01.png) A(V2+V1v2+v2)e,(V2v1+V1v2v2+v1)eB(V2+V1v2−v1)e,(V2v1+V1v2v2−v1)eC(V2−V1v2+v1)e,(V2v1−V1v2v2+v1)eD(V2−V1v2−v1)e,(V2v1−V1v2v2−v1)e
A(V2+V1v2+v2)e,(V2v1+V1v2v2+v1)eB(V2+V1v2−v1)e,(V2v1+V1v2v2−v1)eC(V2−V1v2+v1)e,(V2v1−V1v2v2+v1)eD(V2−V1v2−v1)e,(V2v1−V1v2v2−v1)eThe stopping potential as a function of the frequency of the incident radiation is plotted for two different photoelectric surfaces A and B . The graphs show that work function of A is
 AlessBmoreCequalDnothing can be said
Figure shows the graph of stopping potential verus that frequency of a photosensitive metal. The plank's constant and work funcation of the metal are
_S01_035_Q01.png)
View SolutionThe stopping potential as a function of frequency of incident radiation is plotted for two different photoelectric surfaces A and B . The graphs as shown in figure shows that , the work function of A is

View SolutionThe stopping potential as a function of the frequency of the incident radiation is plotted for two different photoelectric surfaces A and B . The graphs show that work function of A is

View SolutionThe stopping potential as a function of the frequency of the incident radiation is plotted for two different photoelectric surfaces A and B . The graphs show that work function of A is

View Solution
When a high frequency electromagnetic radiation is incident on a metallic surface, electrons are emitted from the surface. Energy of emitted photoelectrons depends only on the frequency of incident electromagnetic radiation and the number of emitted electrons depends only on the intensity of incident light.
Einstein's protoelectron equation [Kmax=hv−ϕ] correctly ecplains the PE, where υ= frequency of incident light and ϕ= work function.
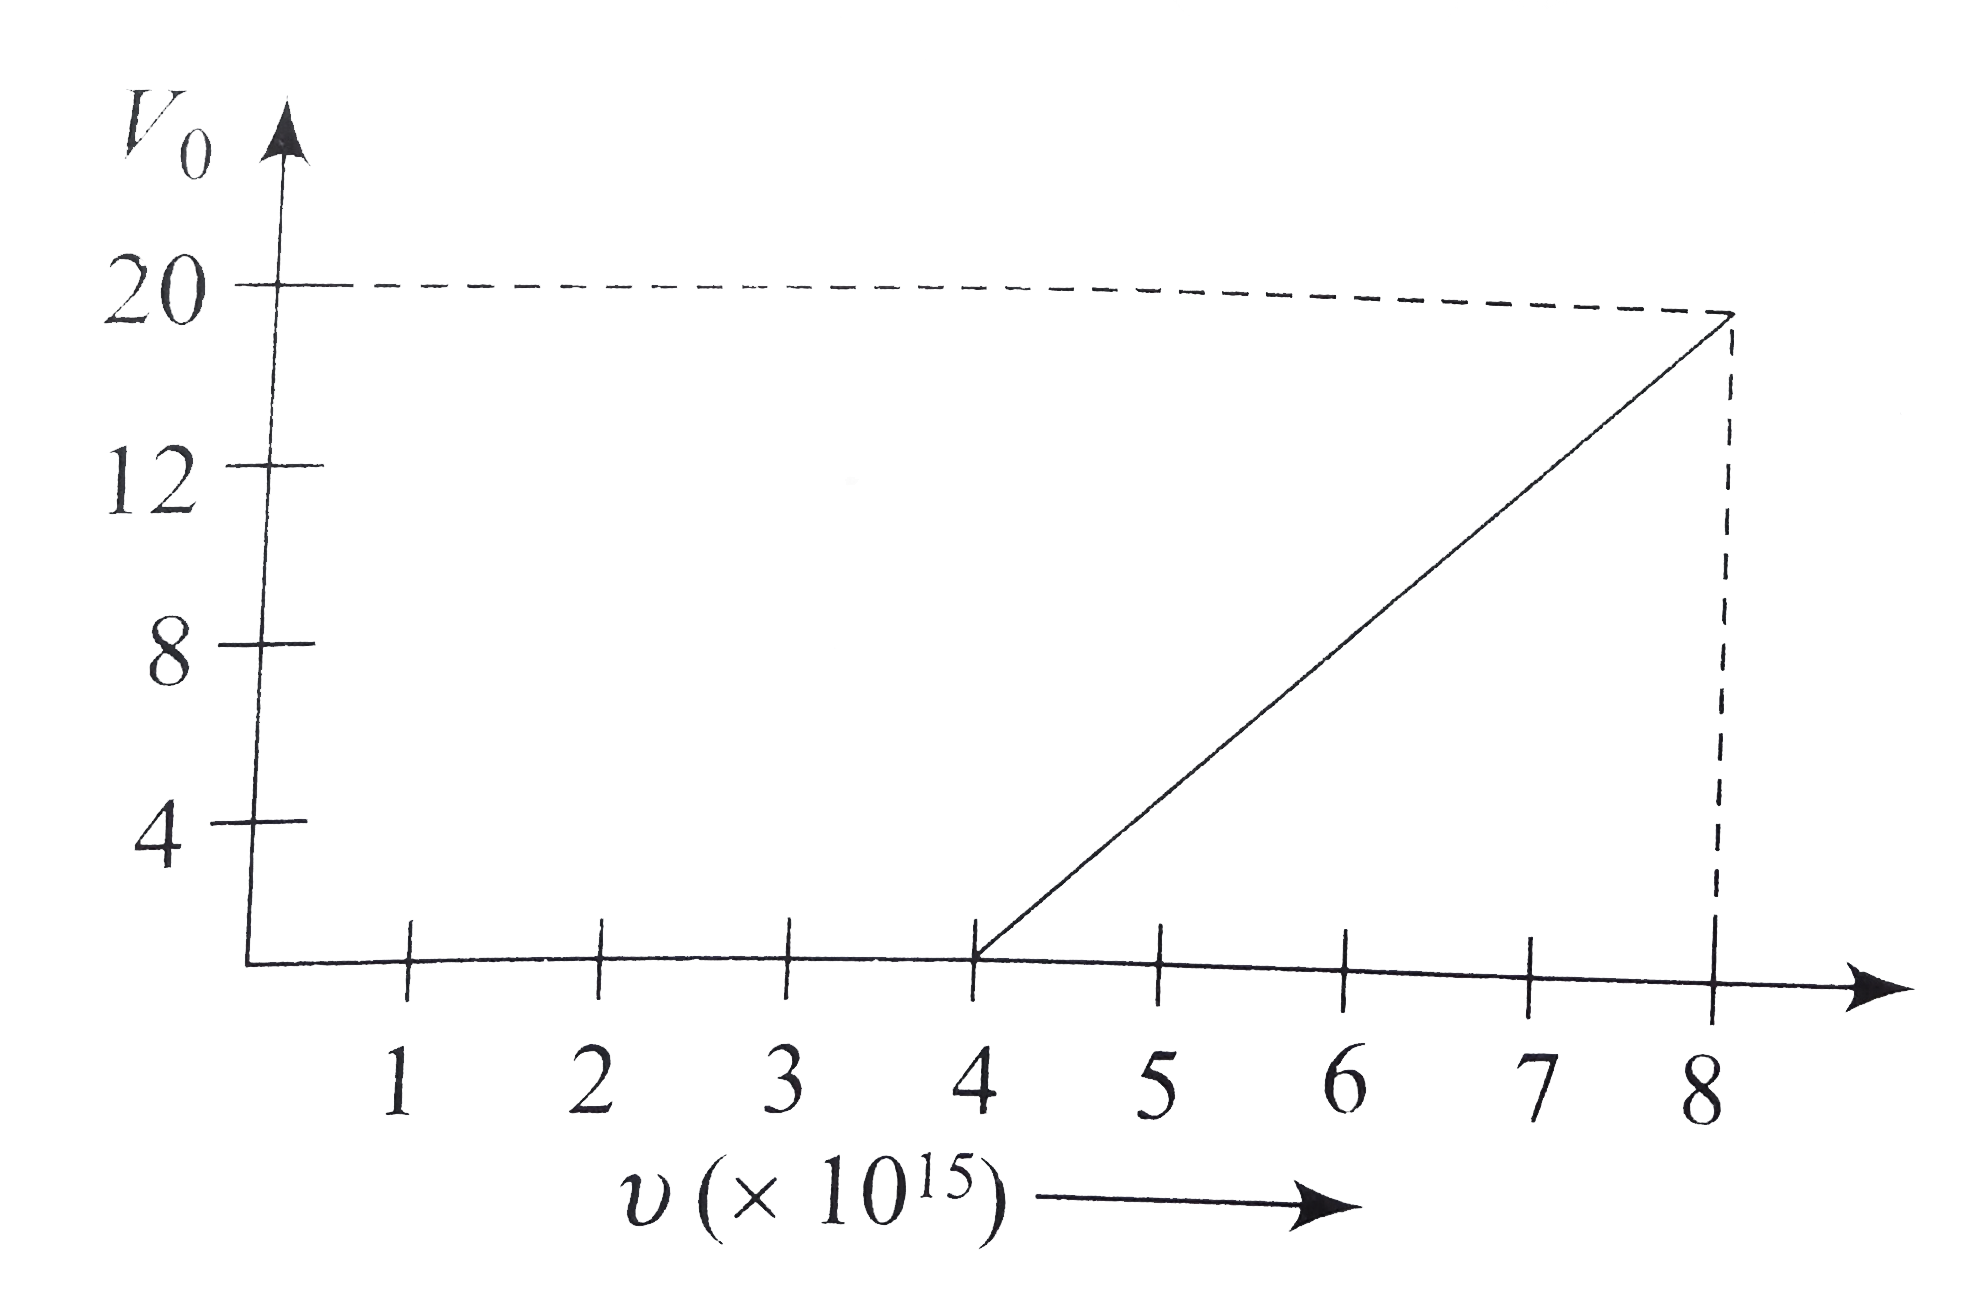
Q. For photoelectric effect in a metal, the graph of the stopping potential V0 (in volt) versus frequency υ (in hertz) of the incident radiation is shown in Fig. The work function of the metal (in eV) is.
View Solution
