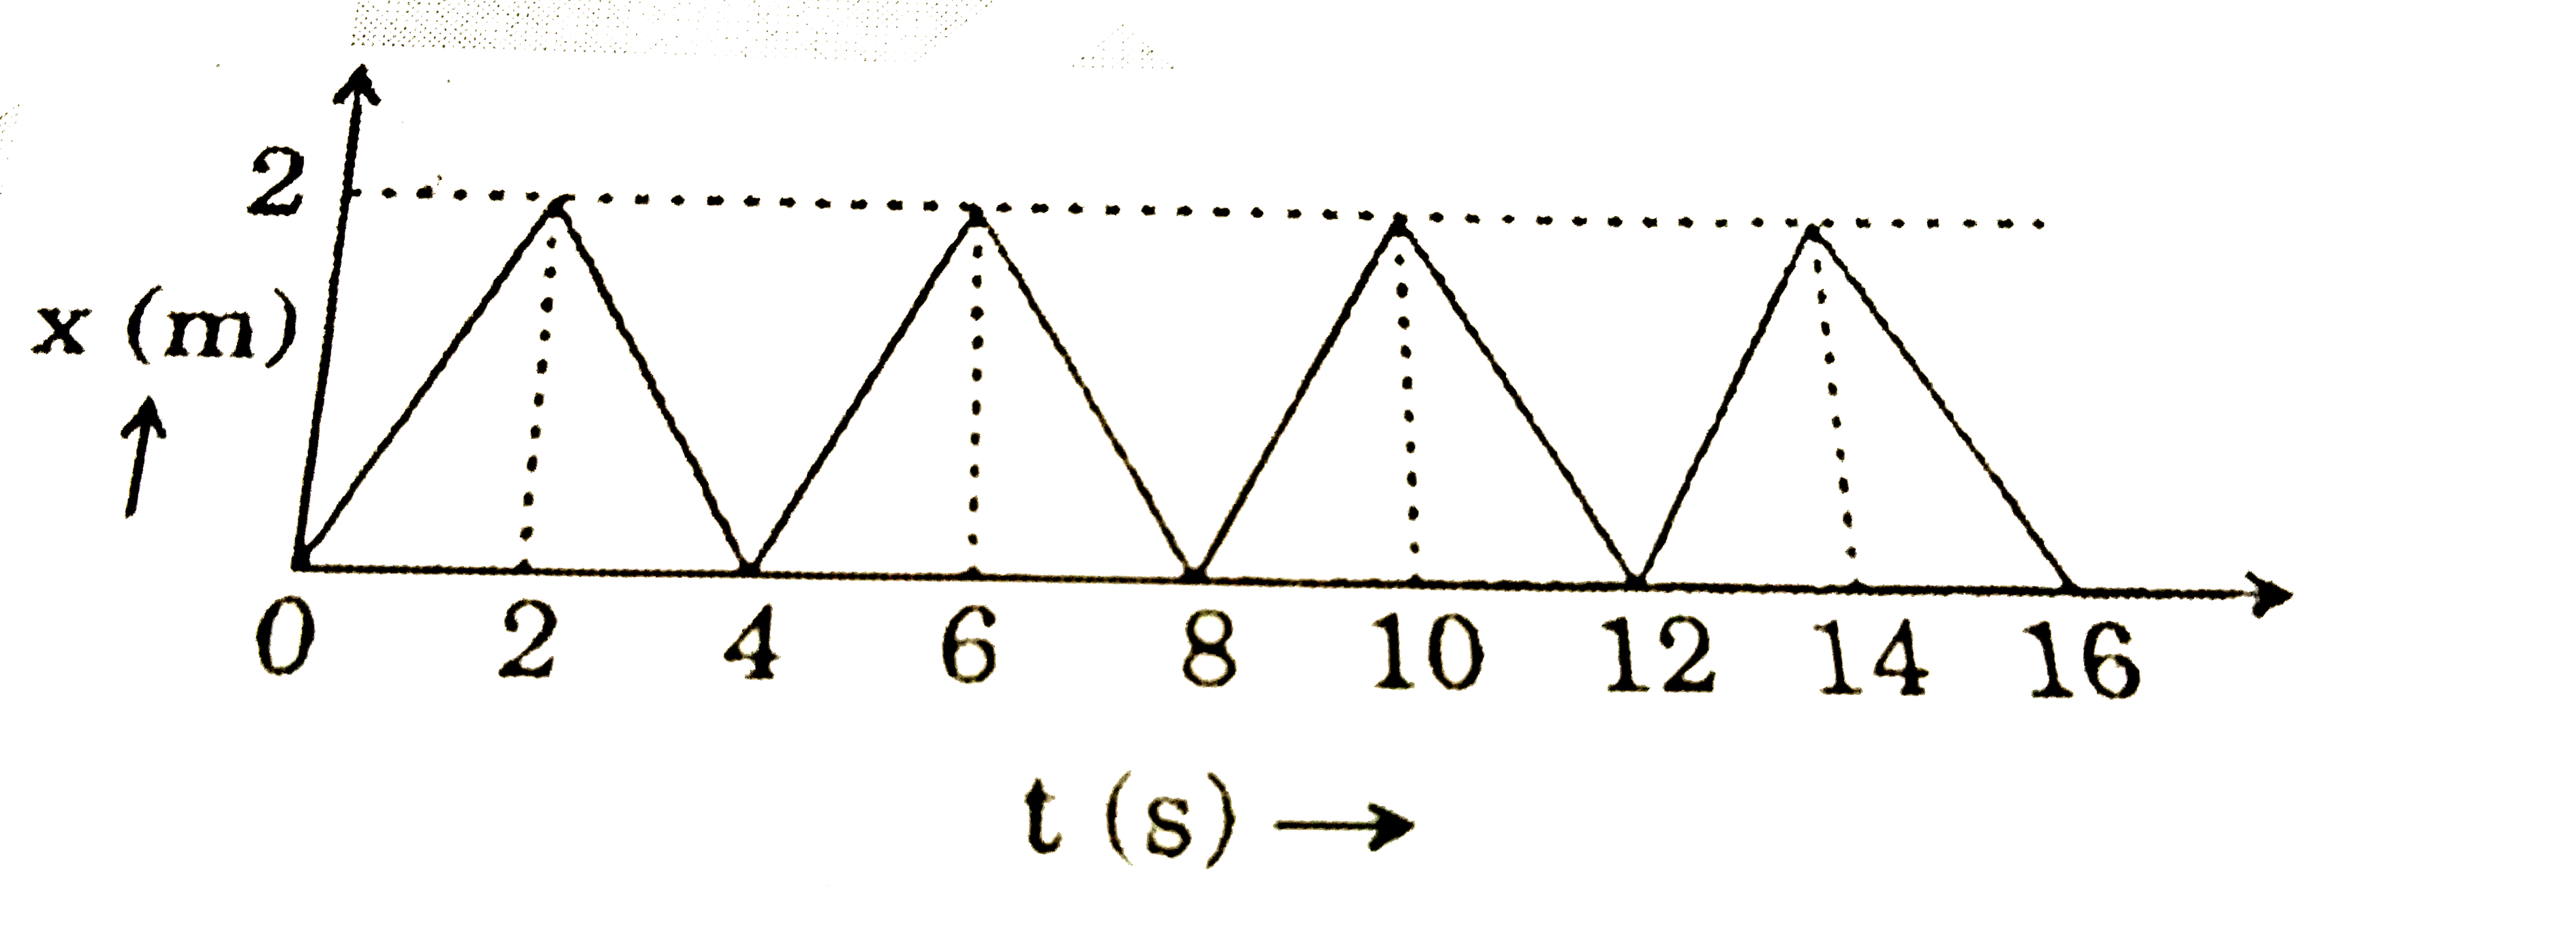
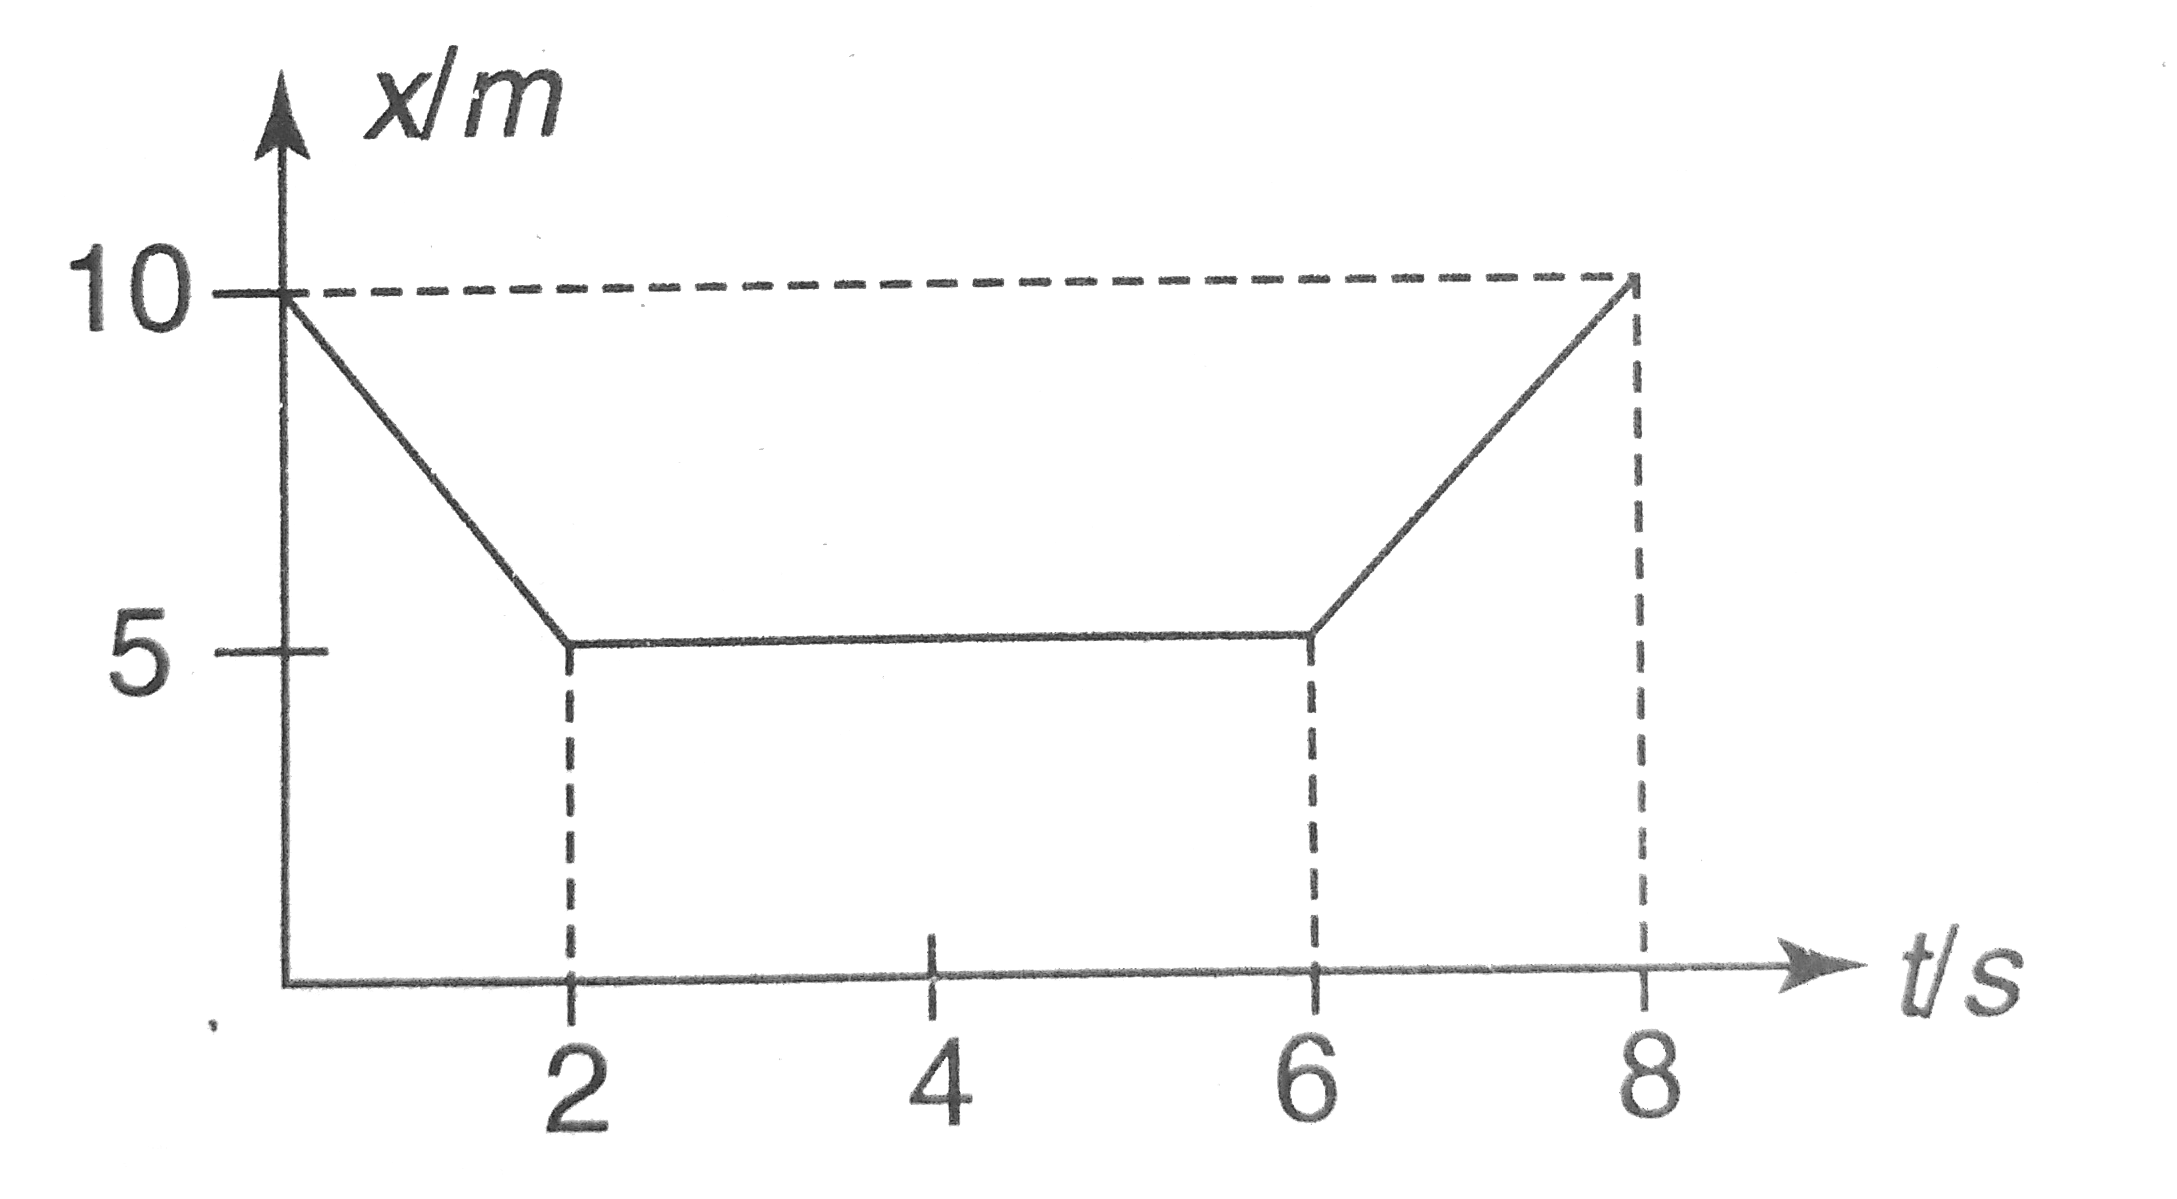
The figure shows the position-time (x-1)-graph of one dimensional motion of a body of mass 0.4 kg. The magnitude of each impulse is :

0.2 Ns
0.4 Ns
0.8 Ns
1.6 Ns.
The correct Answer is:c
Here Impulse=|Δp|=|p2−p1|=|m(ν2−ν1)|
=|0.4(1−9−1)|=0.8
Hence (c) is the correct choice.
Topper's Solved these Questions
- LAWS OF MOTIONBOOK - MODERN PUBLICATIONCHAPTER - LAWS OF MOTIONEXERCISE - MULTIPLE CHOICE QUESTION (LEVEL-III)
2 Videos
- LAWS OF MOTIONBOOK - MODERN PUBLICATIONCHAPTER - LAWS OF MOTIONEXERCISE - RECENT COMPETITIVE QUESTIONS
7 Videos
- LAWS OF MOTIONBOOK - MODERN PUBLICATIONCHAPTER - LAWS OF MOTIONEXERCISE - Revision test
43 Videos
- HEAT AND THERMODYNAMICSBOOK - MODERN PUBLICATIONCHAPTER - HEAT AND THERMODYNAMICSEXERCISE - Recent Competitve Questions
17 Videos
- MAGNETOSTATICSBOOK - MODERN PUBLICATIONCHAPTER - MAGNETOSTATICSEXERCISE - RECENT COMPETITIVE QUESTION
5 Videos
Similar Questions
Knowledge Check
The figure shows the position-time (x-t) graph of one-dimensional motion of a body of mass 0.4kg. The magnitude of each impulse is
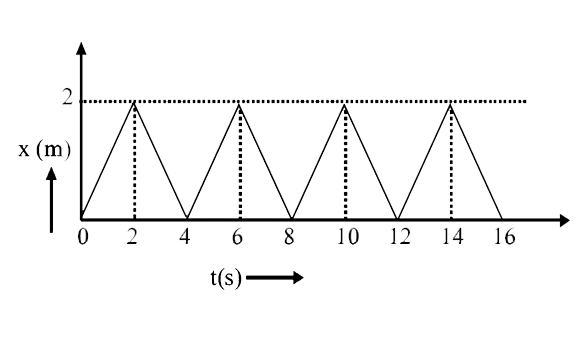 A0.4NsB0.8NsC1.6NsD0.2Ns
The figure shows the position – time (x – t) graph of one – dimensional motion of a body of mass 0.4 kg. The magnitude of each impulse is:
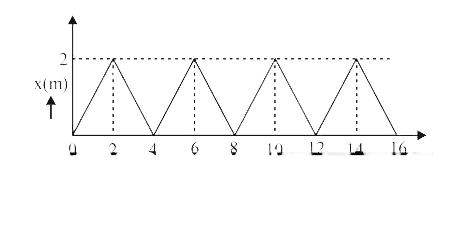 A0.4 NsB0.8 NsC1.6 NsD0.2 Ns
Figure shows the position-time (x-t) graph of one dimensional motion of a mass 500g. What is the time interval between two consecutive impulses received by the body?
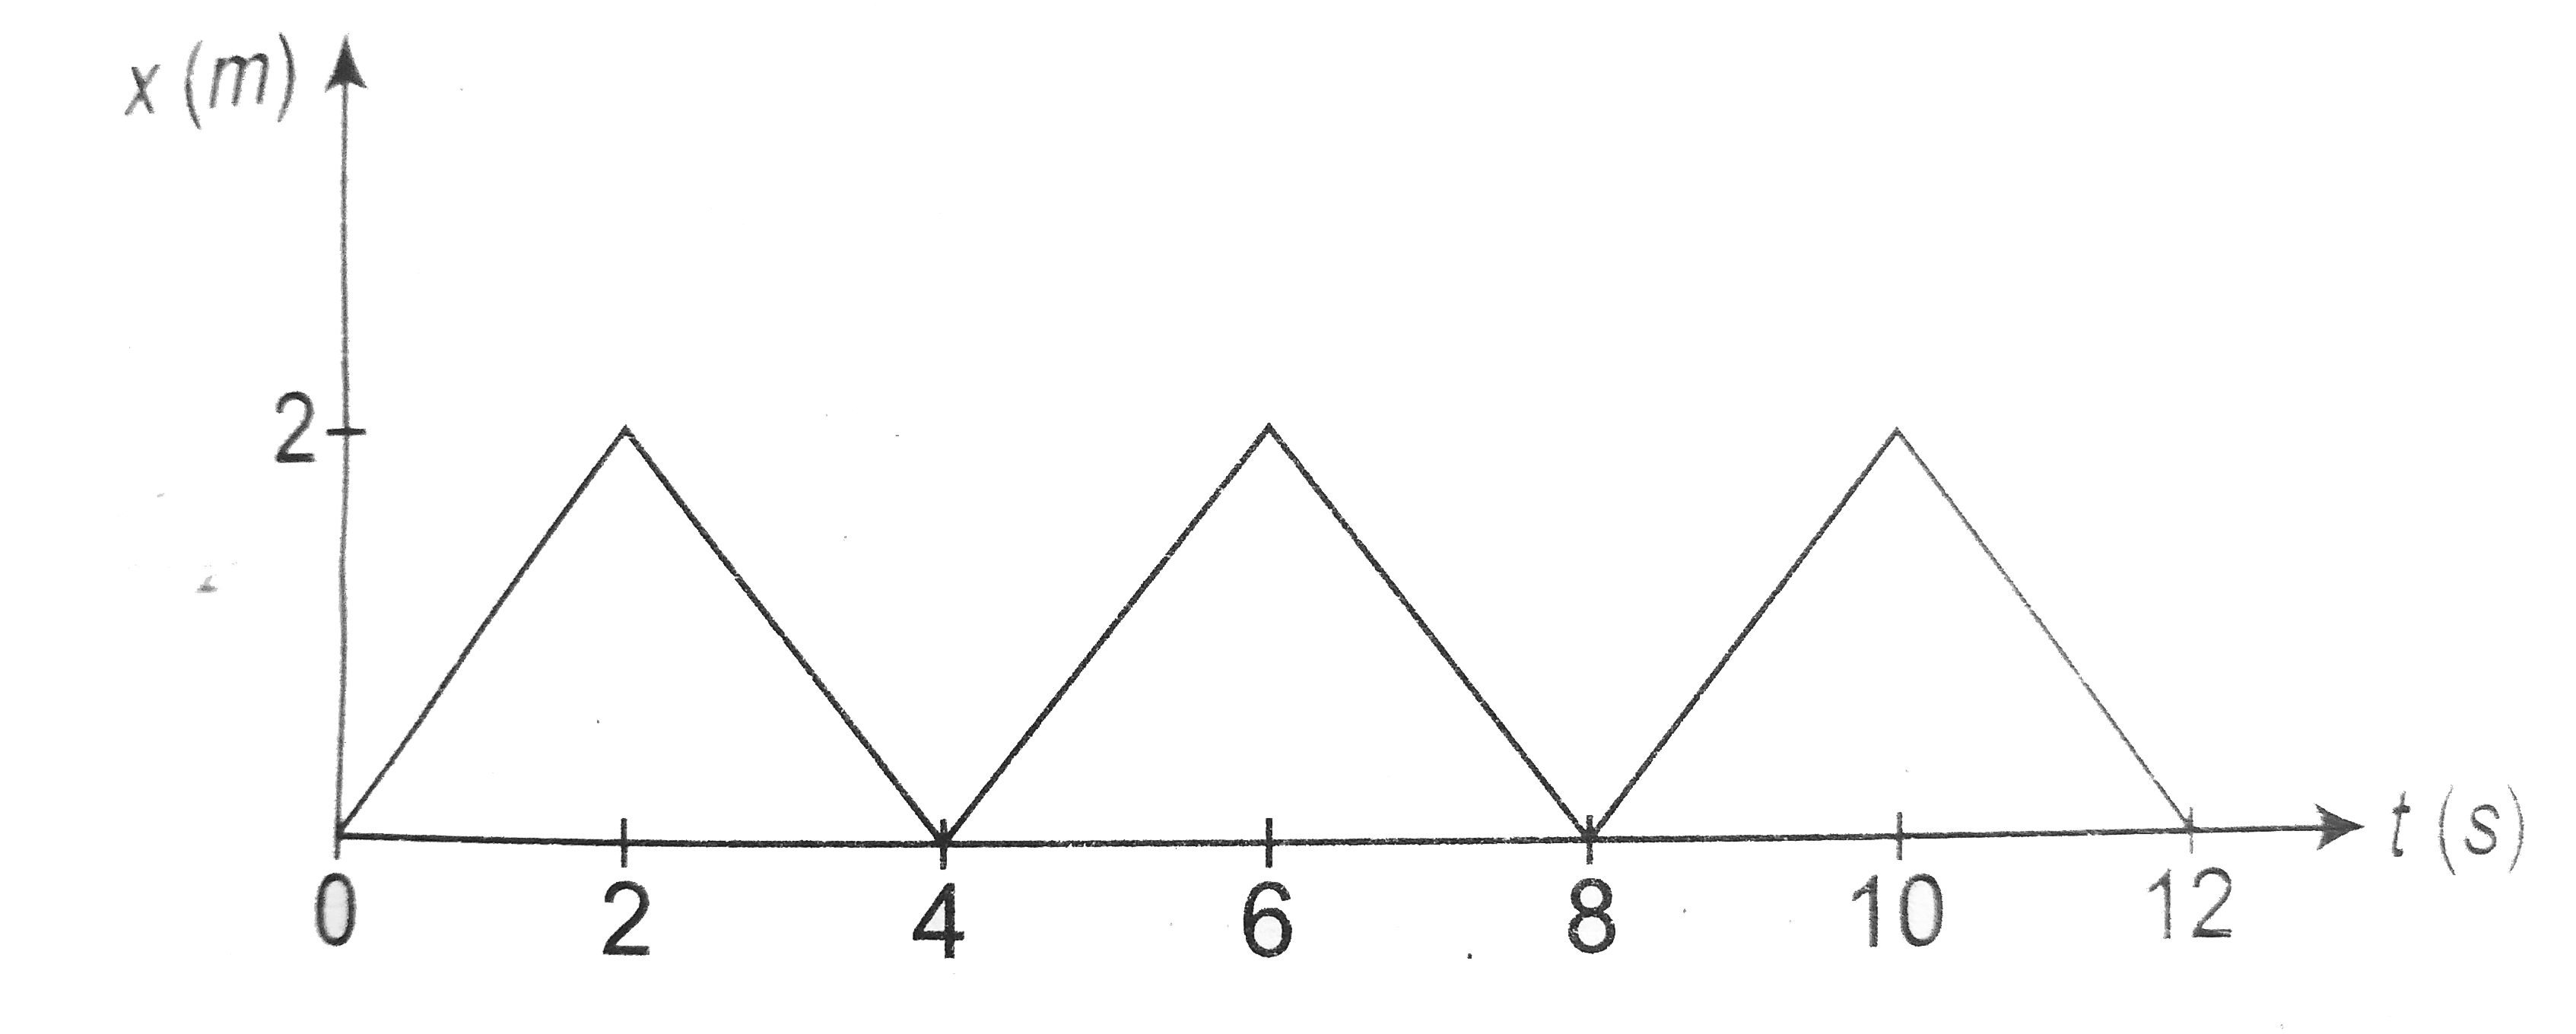 A2sB4sC6sD8s
Figure below shows the velocity-time graph of a one dimensional motion. Which of the following characteristic of the particle is represented by the shaded area?
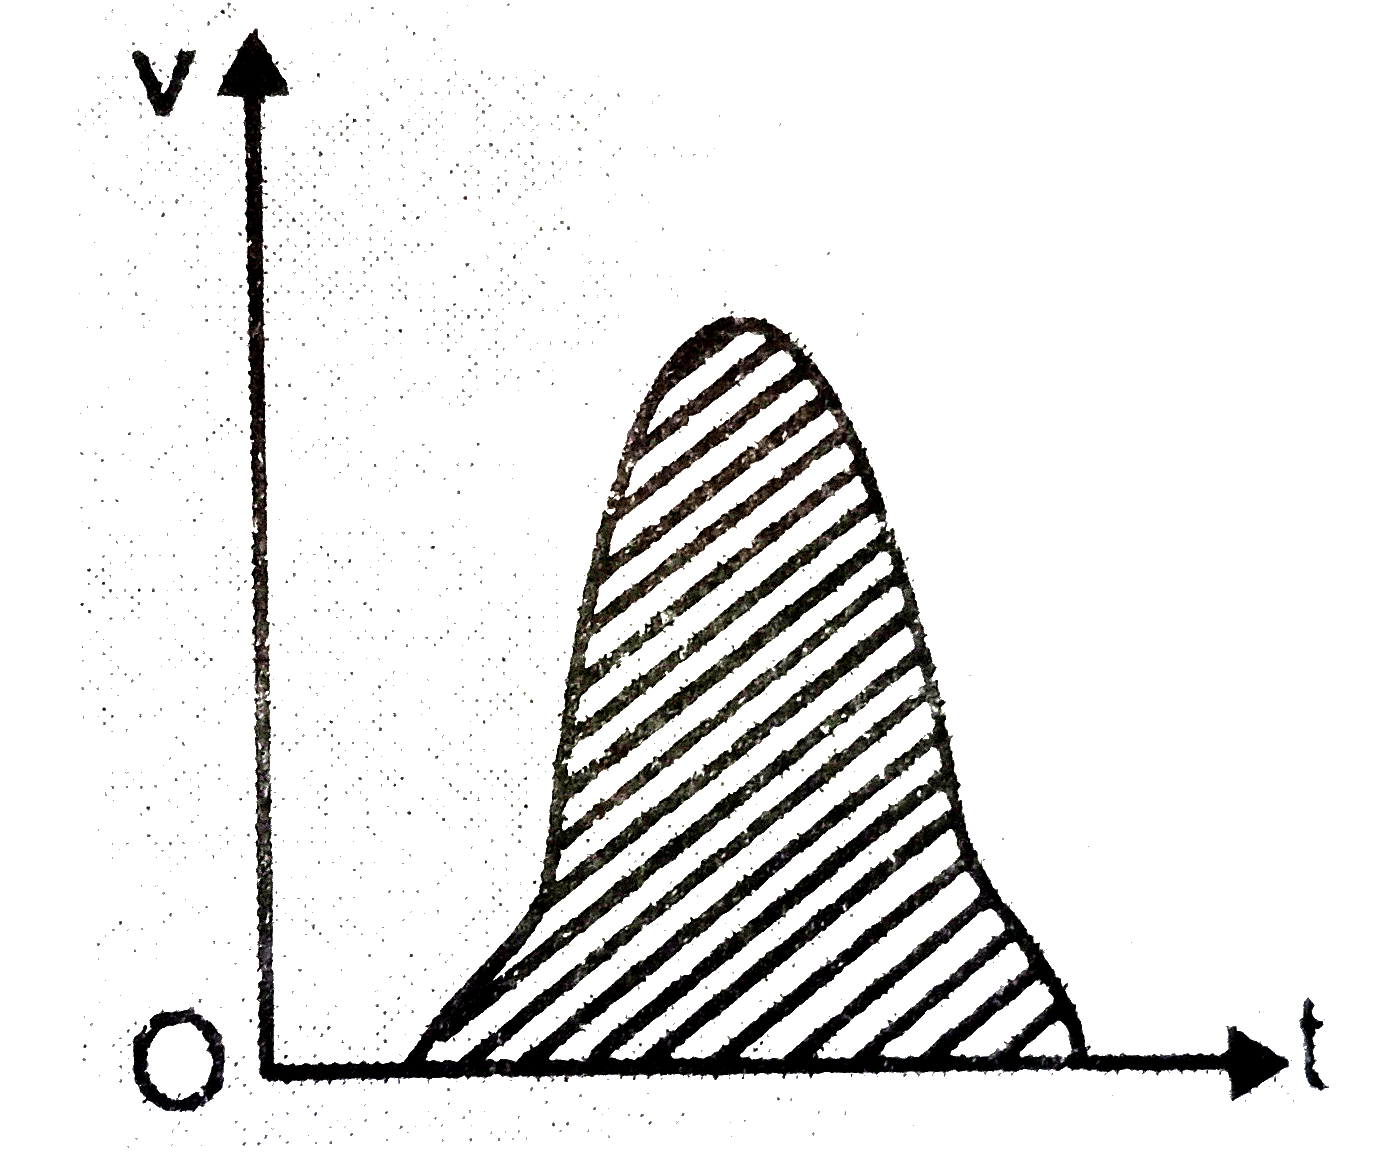
View SolutionFigure shows the position-time (x-t) graph of one dimensional motion of a mass 500g. What is the time interval between two consecutive impulses received by the body?

View Solution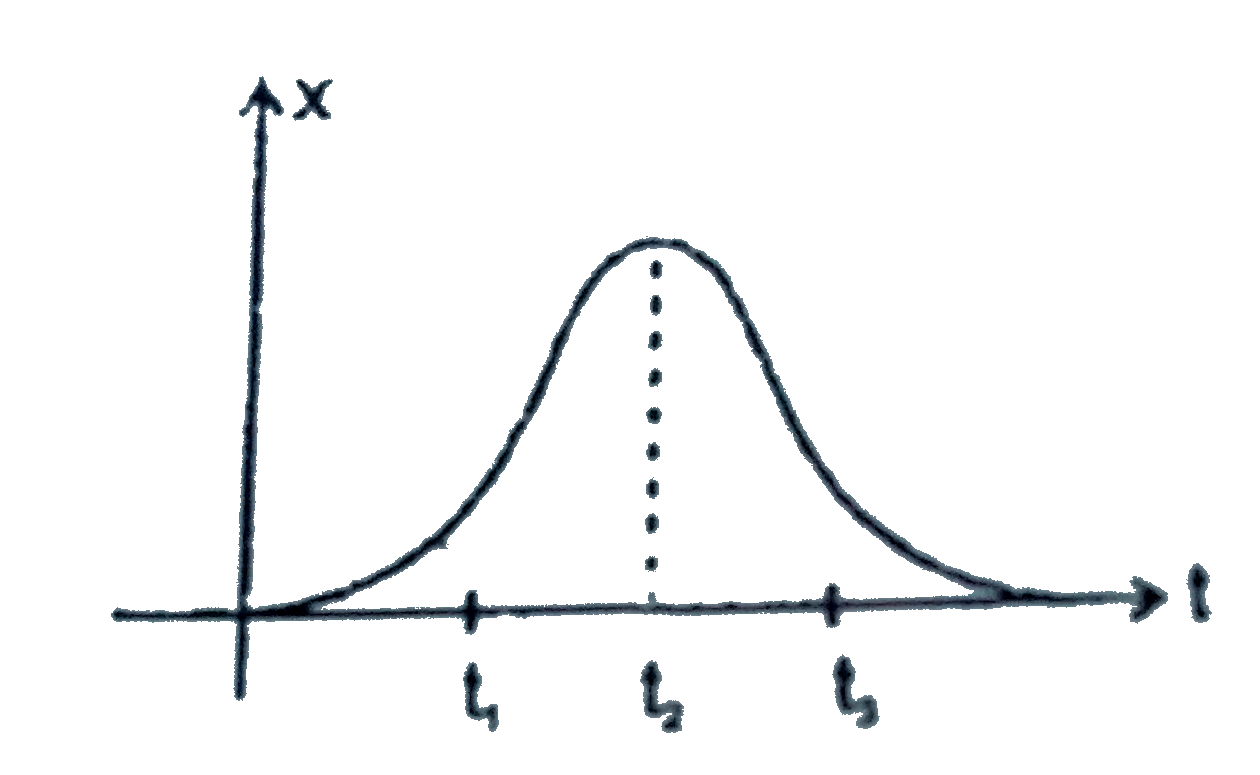
Given figure shows position-time curve during one dimentional motion of body. Select correct statements.
View SolutionFigure shows the position time graph for a particle in one dimensional motion. What is the displacement of the particle in first 4 seconds ?
View SolutionFigure below shows the velocity-time graph of a one dimensional motion. Which of the following characteristic of the particle is represented by the shaded area?

View Solution

