The following graph shows the displacement of the bob from its mean position versus time . The time period and the amplitude of the bob are :
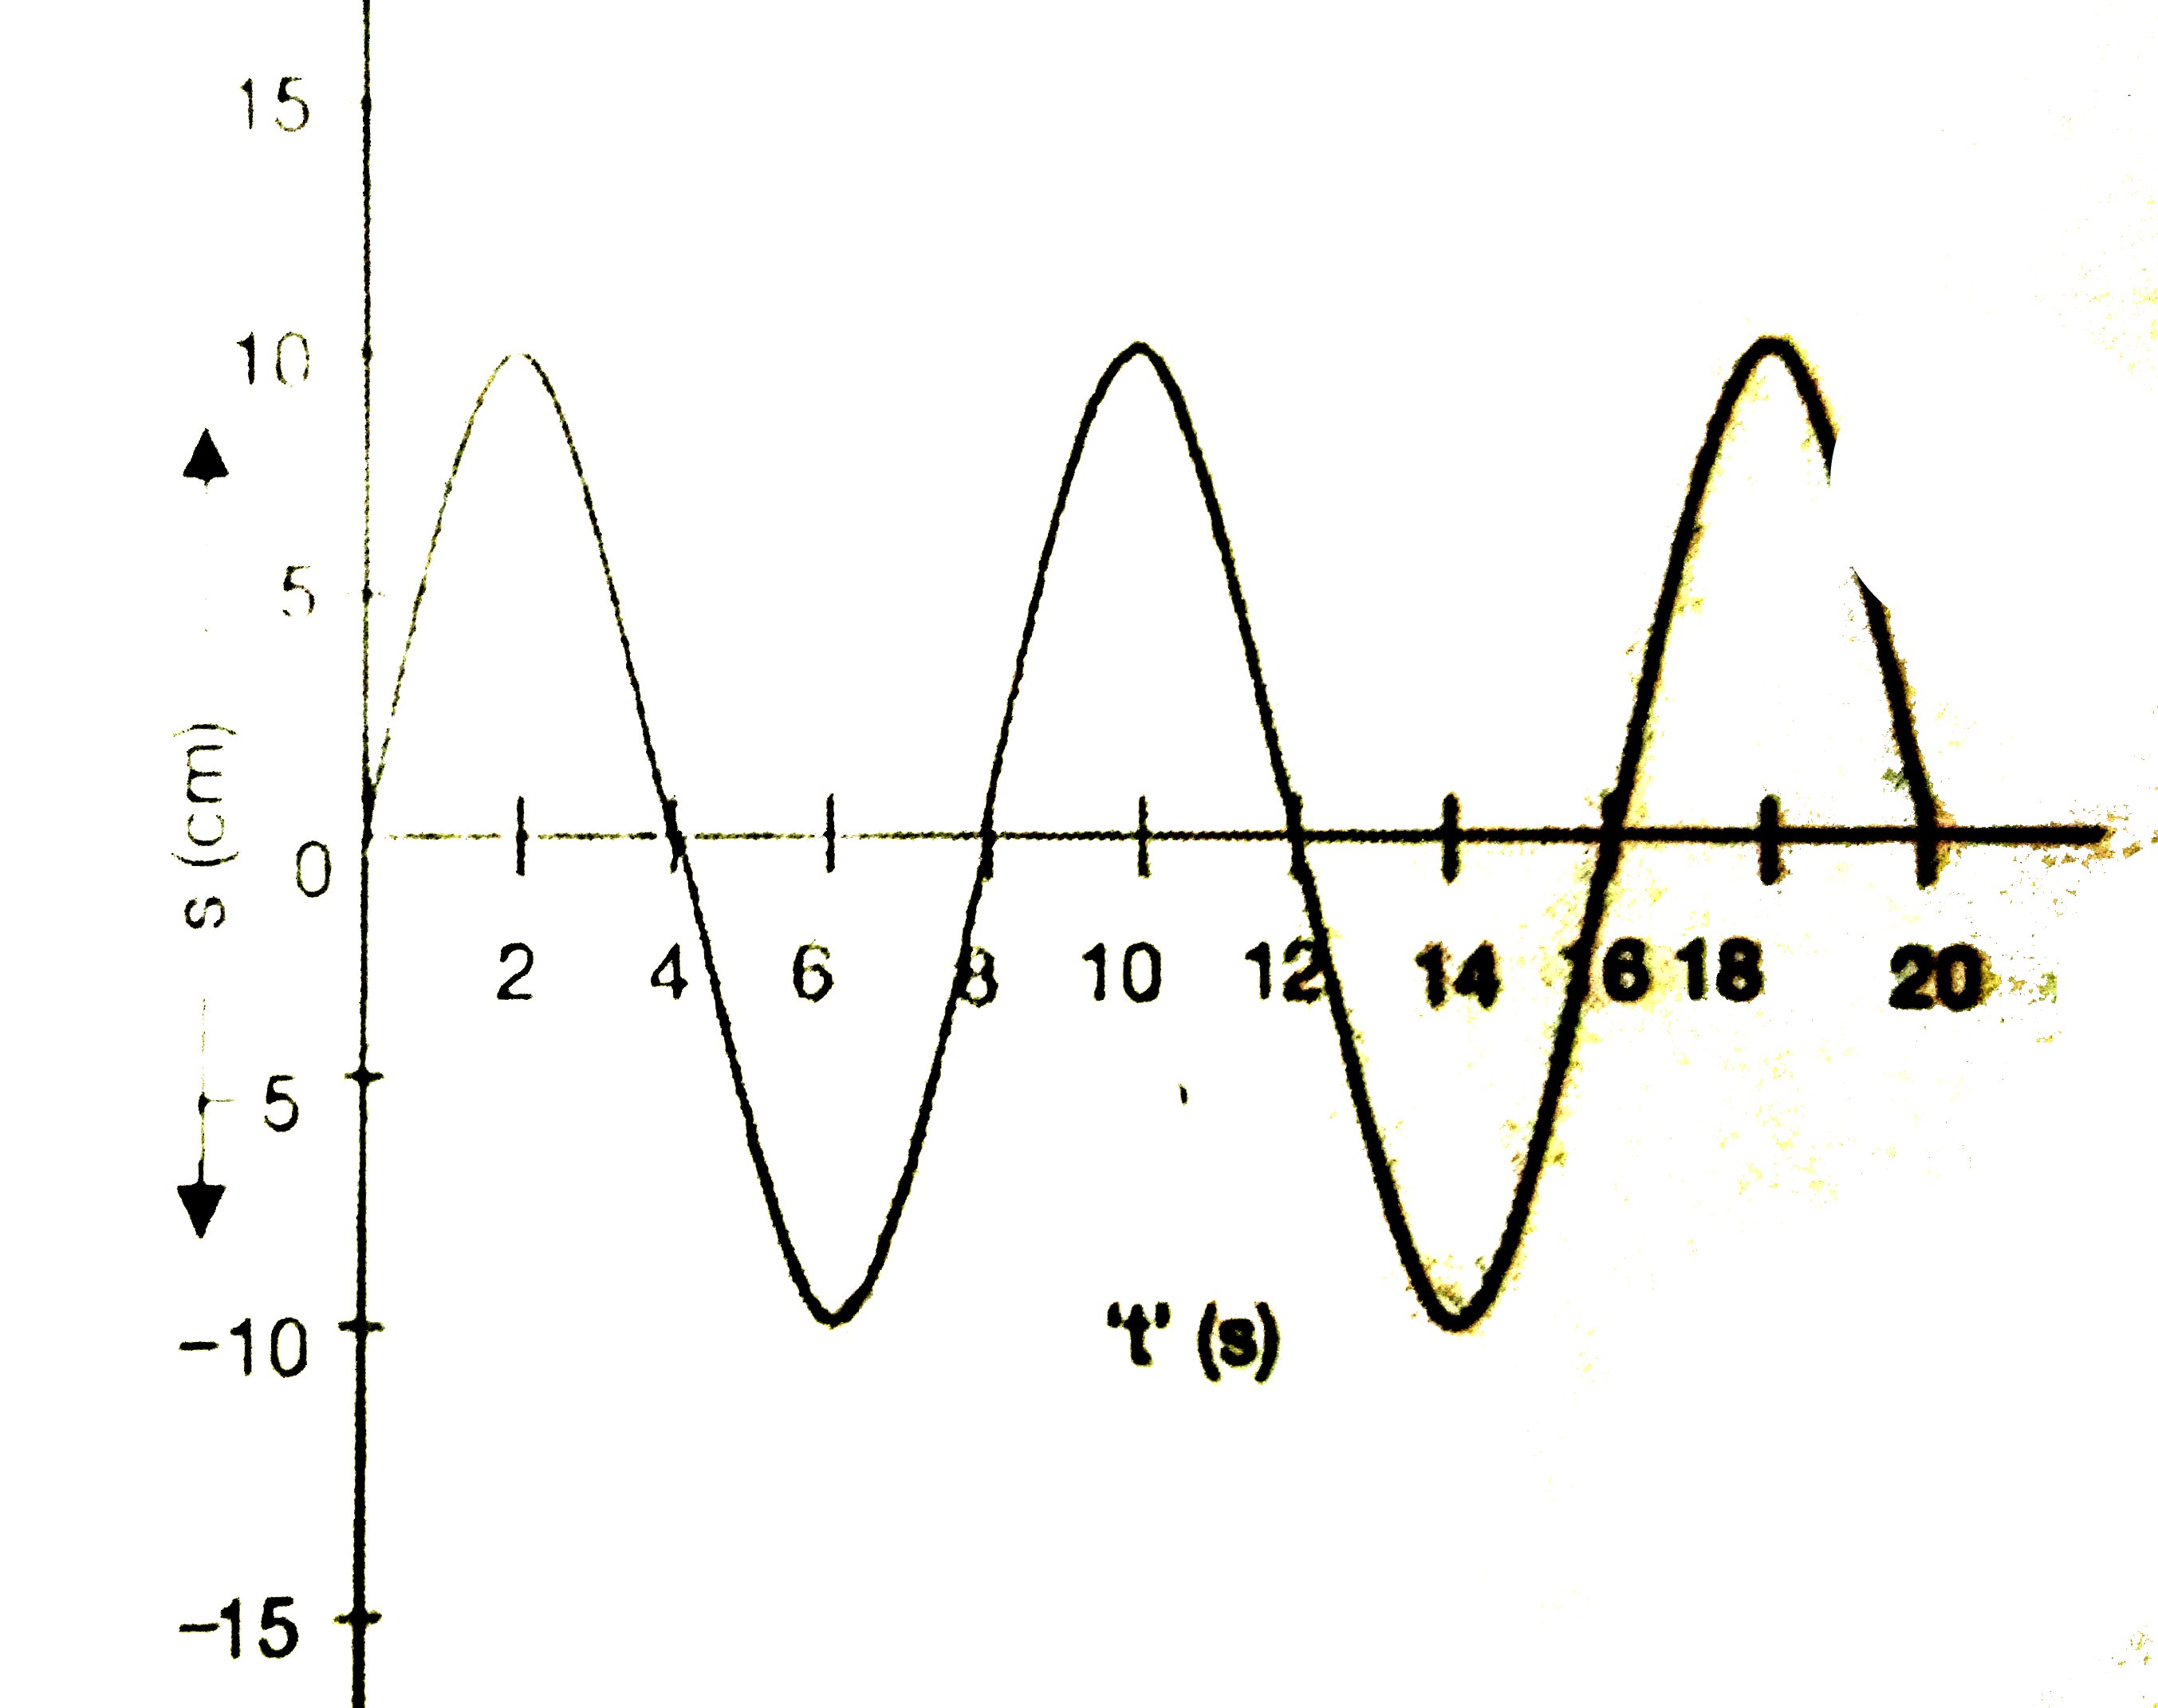
4s , 5 cm
8s , 10 cm
4s , 10 cm
8s , 5 cm
The correct Answer is:B
Step by step video, text & image solution for The following graph shows the displacement of the bob from its mean position versus time . The time period and the amplitude of the bob are : by Physics experts to help you in doubts & scoring excellent marks in Class 9 exams.
Updated on:21/07/2023Topper's Solved these Questions
- WAVES MOTION AND SOUND BOOK - PEARSON IIT JEE FOUNDATIONCHAPTER - WAVES MOTION AND SOUND EXERCISE - Level 2
20 Videos
- WAVES MOTION AND SOUND BOOK - PEARSON IIT JEE FOUNDATIONCHAPTER - WAVES MOTION AND SOUND EXERCISE - Level 3
10 Videos
- WAVES MOTION AND SOUND BOOK - PEARSON IIT JEE FOUNDATIONCHAPTER - WAVES MOTION AND SOUND EXERCISE - Short Answer Type Questions
18 Videos
- SIMPLE MACHINESBOOK - PEARSON IIT JEE FOUNDATIONCHAPTER - SIMPLE MACHINESEXERCISE - Level- 3
10 Videos
Similar Questions
Knowledge Check
In the following graph (Fig. 2.4) of displacement versus time,
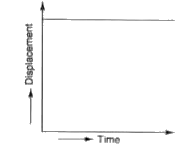 Athe body is at restBthe body has some initial speedCthe body moves with sonstant speedDthe body moves with constant velocity
In the case of a simple pendulum, a graph is drawn between the displacement and time taken for its oscillations as shown in the figure. Then
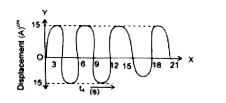
Time period of the pendulum bob is ______ s.A9B6C4.5D3The displacement from mean position of a particle in SHM at 3 seconds is √3 /2 of the amplitude. Its time period will be :
A18 sec.B6√3sec.C9sec.D3√3sec.
Does the time period depend upon the mass, the sixe and the material of the bob.
View SolutionIn SHM, acceleration versus displacement (from mean position) graph:
View SolutionIn the case of a simple pendulum, a graph is drawn between the displacement and time taken for its oscillations as shown in the figure. Then
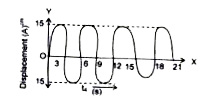
The amplitude of oscillation of the pendulum bob is _____ cm.
View SolutionIn the case of a simple pendulum, a graph is drawn between the displacement and time taken for its oscillations as shown in the figure. Then

Time period of the pendulum bob is ______ s.
View SolutionIn the case of a simple pendulum, a graph is drawn between the displacement and time taken for its oscillations as shown in the figure . Then
The amplitude of oscillation of the pendulum of the bob is ____ cm .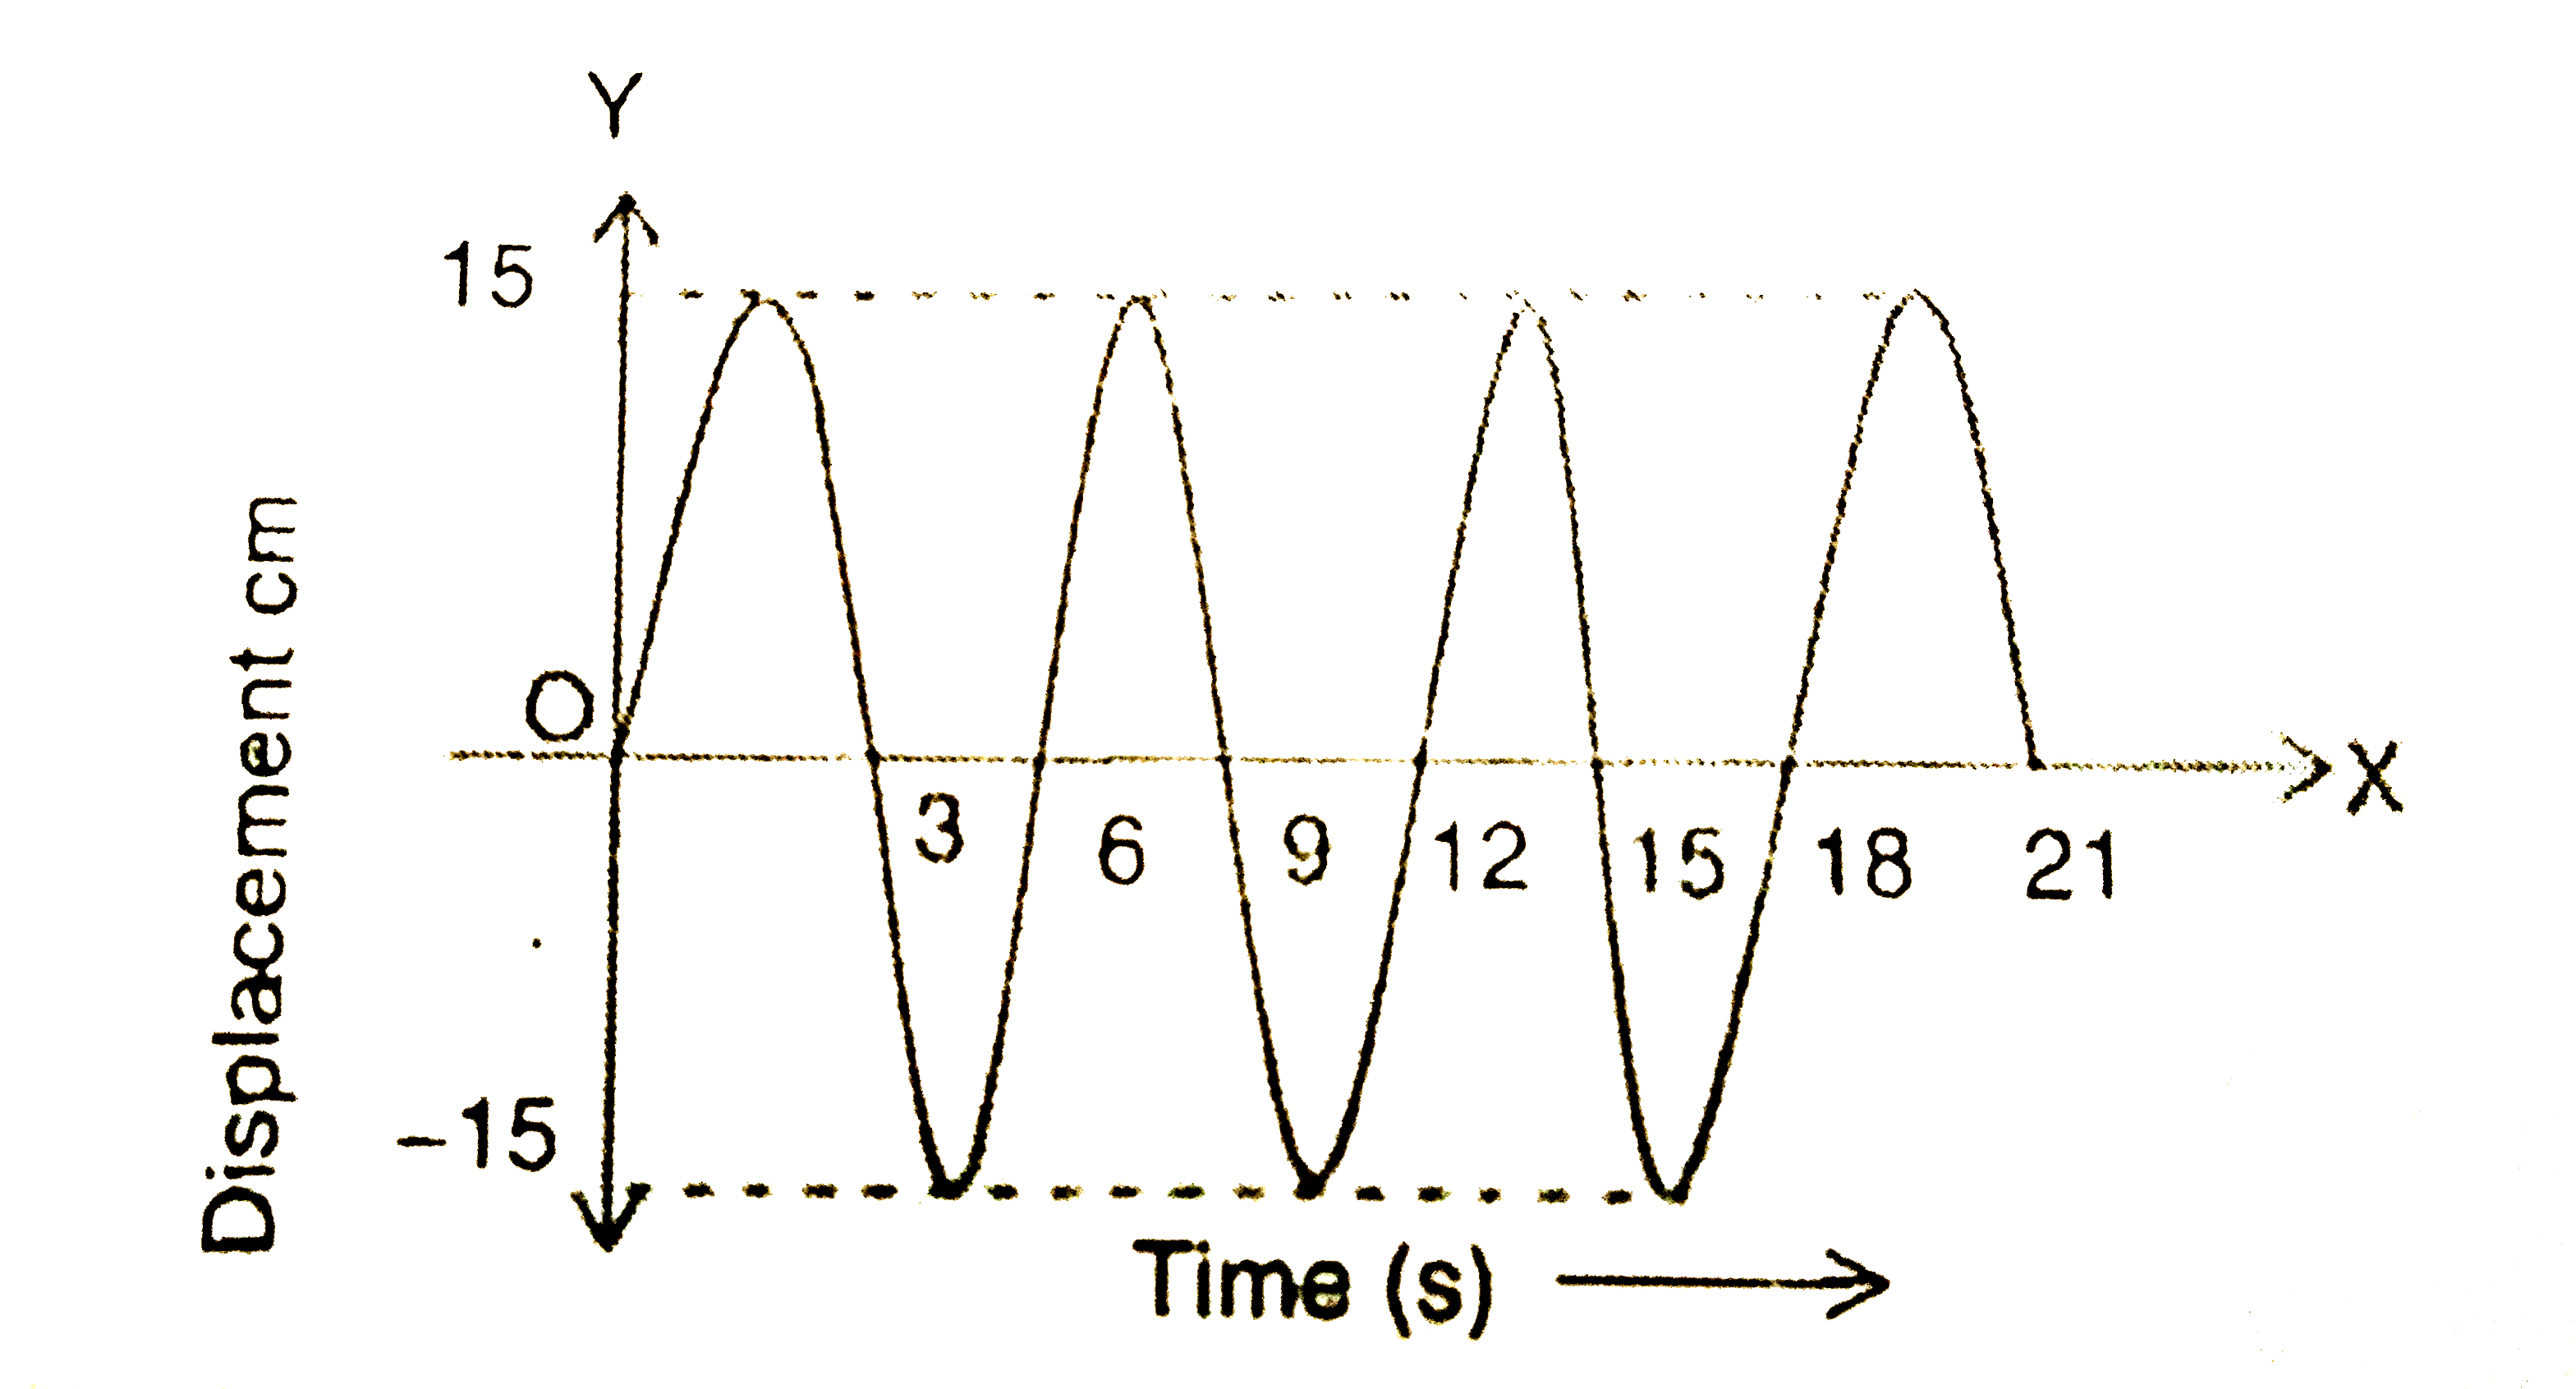
View Solution
