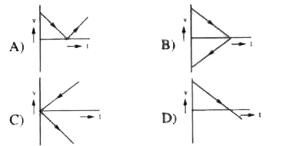
The following graphs represent position - time graphs. Arrange the graphs in ascending order of increasing speed.

Text Solution
The slope in the position-time graph will give the speed of the particle. In the graph (a) slope is zero. Graph (c) has higher slope than graphs (1) and (d). So we can arrange the speeds in ascending order as
va<vd<vb<vc
|
Topper's Solved these Questions
- KINEMATICSBOOK - FULL MARKSCHAPTER - KINEMATICSEXERCISE - TEXTUAL QUESTIONS SOLVED (MULTIPLE CHOICE QUESTIONS:)
30 Videos
- KINEMATICSBOOK - FULL MARKSCHAPTER - KINEMATICSEXERCISE - TEXTUAL QUESTIONS SOLVED (SHORT ANSWER QUESTIONS)
30 Videos
- HEAT AND THERMODYNAMICSBOOK - FULL MARKSCHAPTER - HEAT AND THERMODYNAMICSEXERCISE - ADDITIONAL QUESTIONS SOLVED (Numerical Problems)
16 Videos
- KINETIC THEORY OF GASESBOOK - FULL MARKSCHAPTER - KINETIC THEORY OF GASESEXERCISE - Addtional Numerical Problems
10 Videos
Similar Questions
Knowledge Check
Which of the following graphs represents a first order reaction ?
A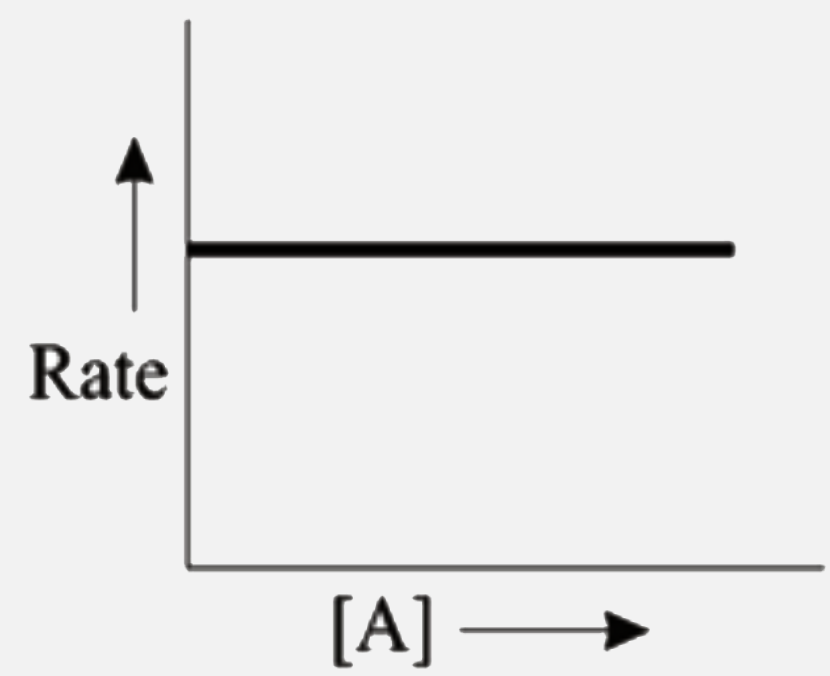 B
B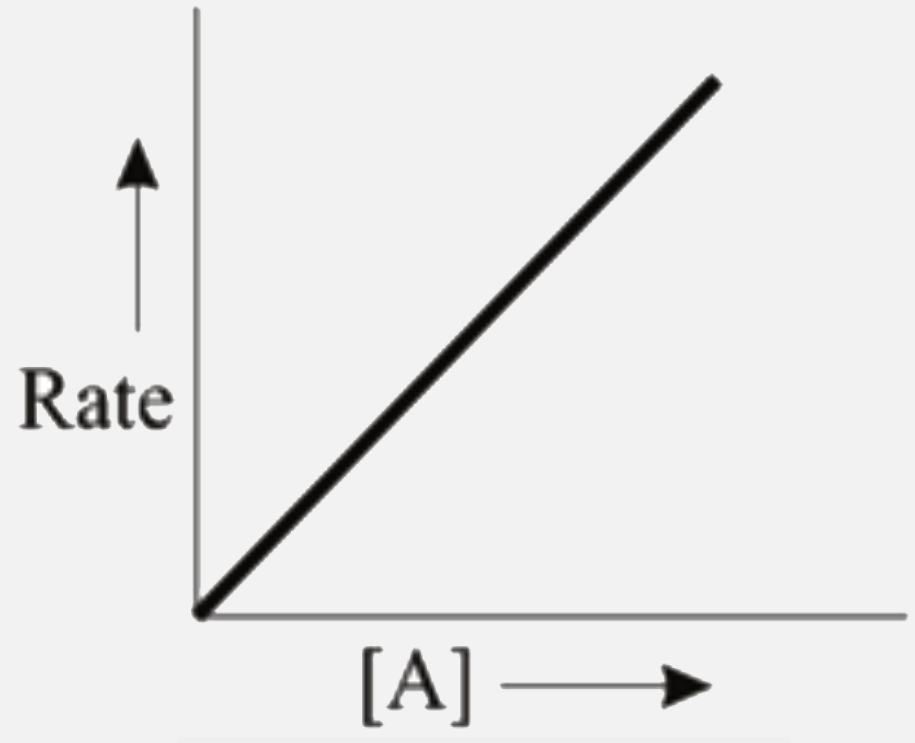 C
C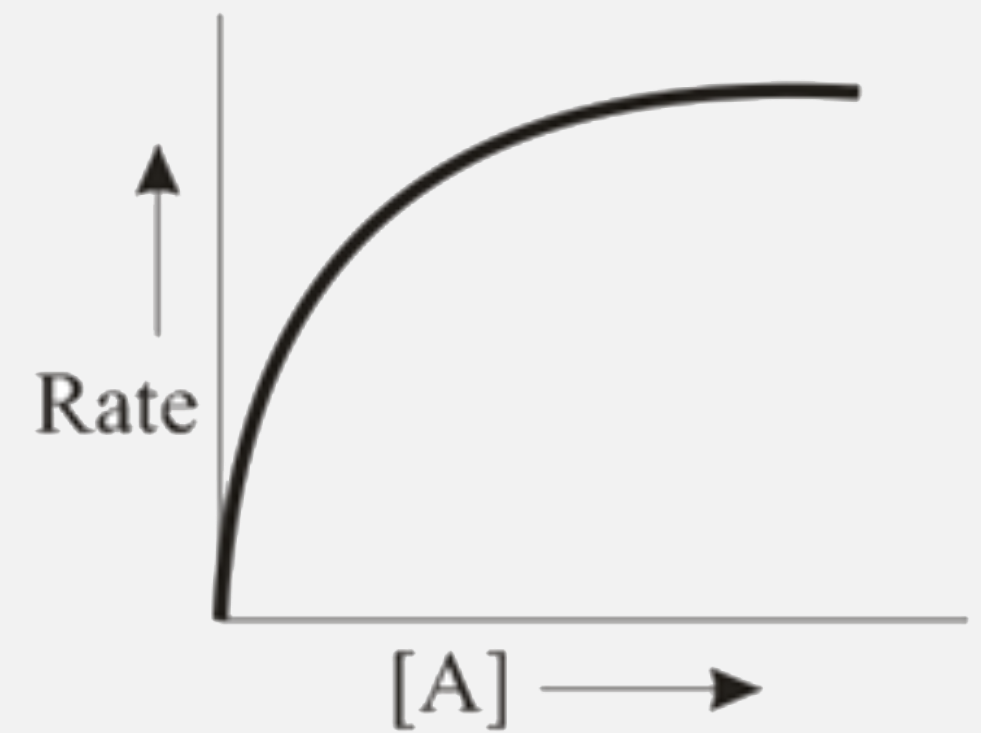 D
D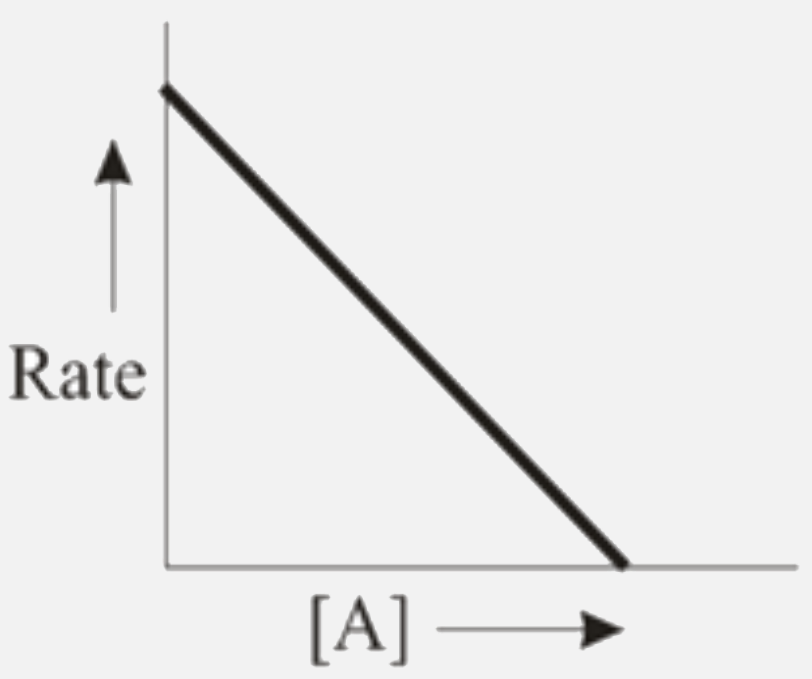
Which graph represents positive acceleration ?
A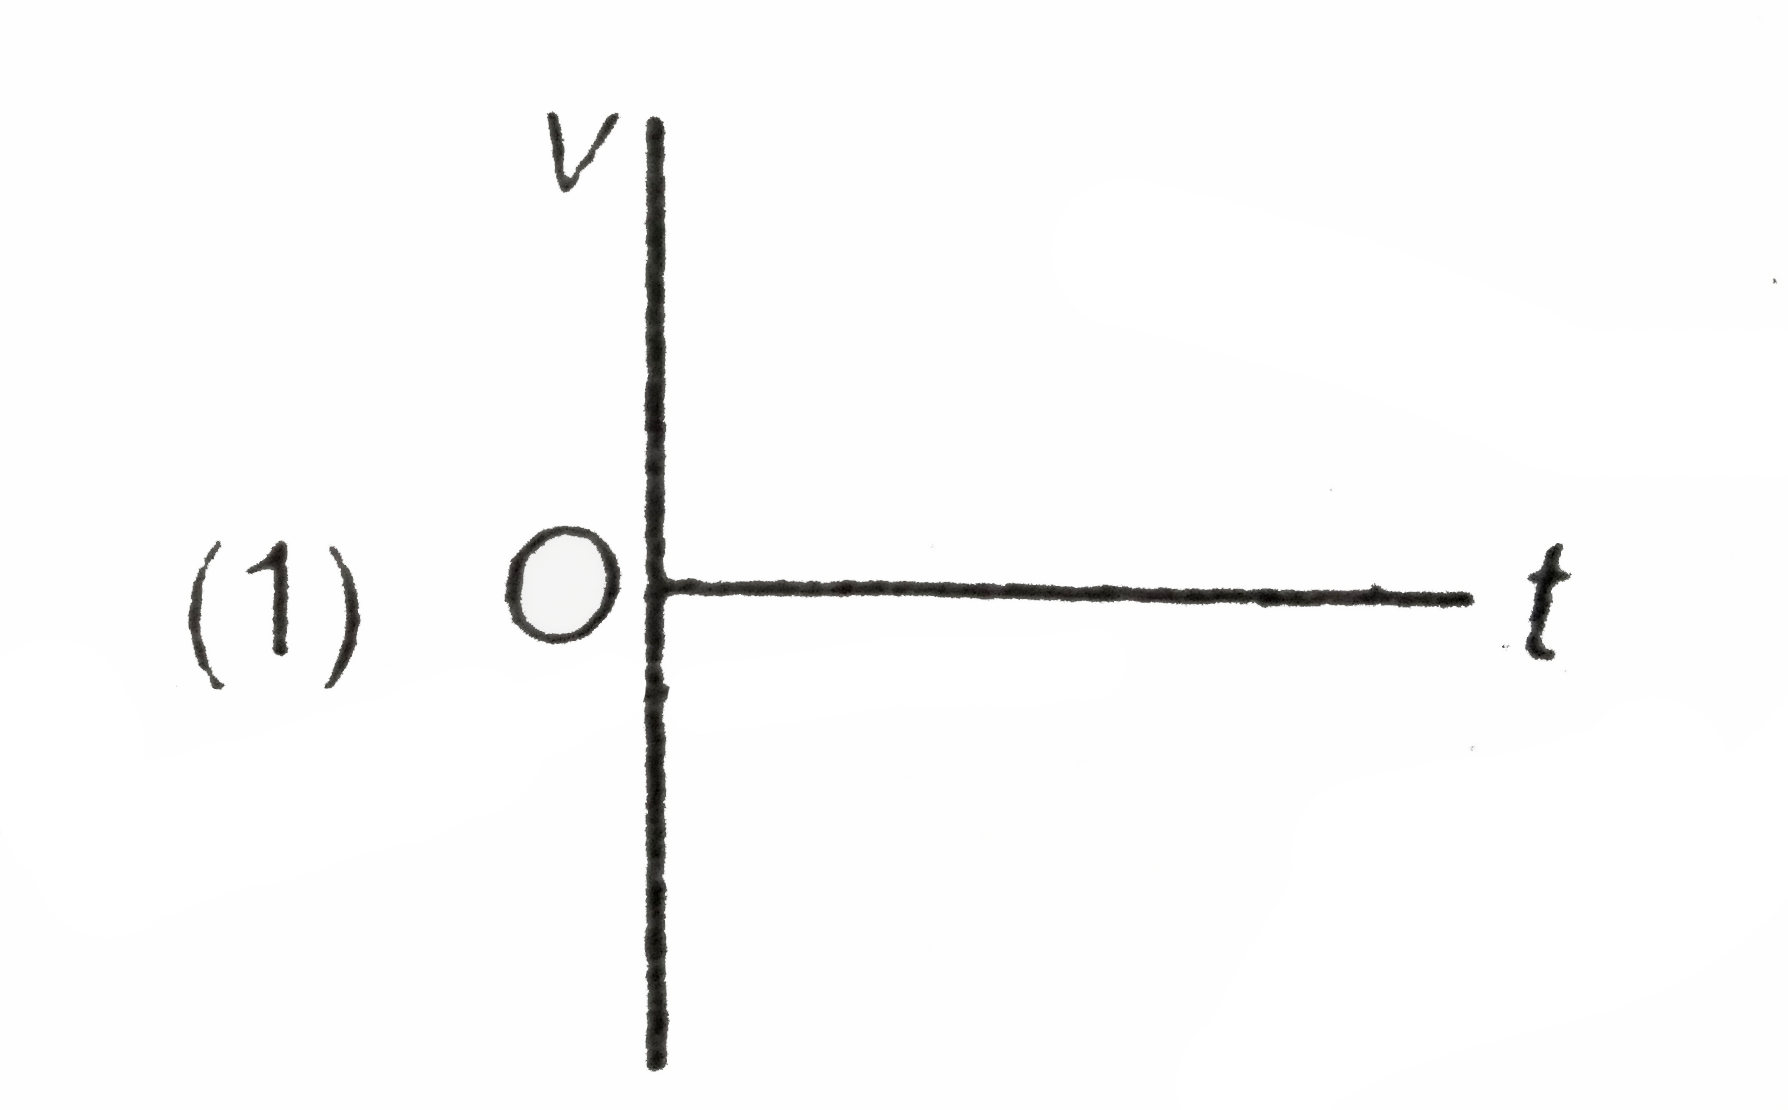 B
B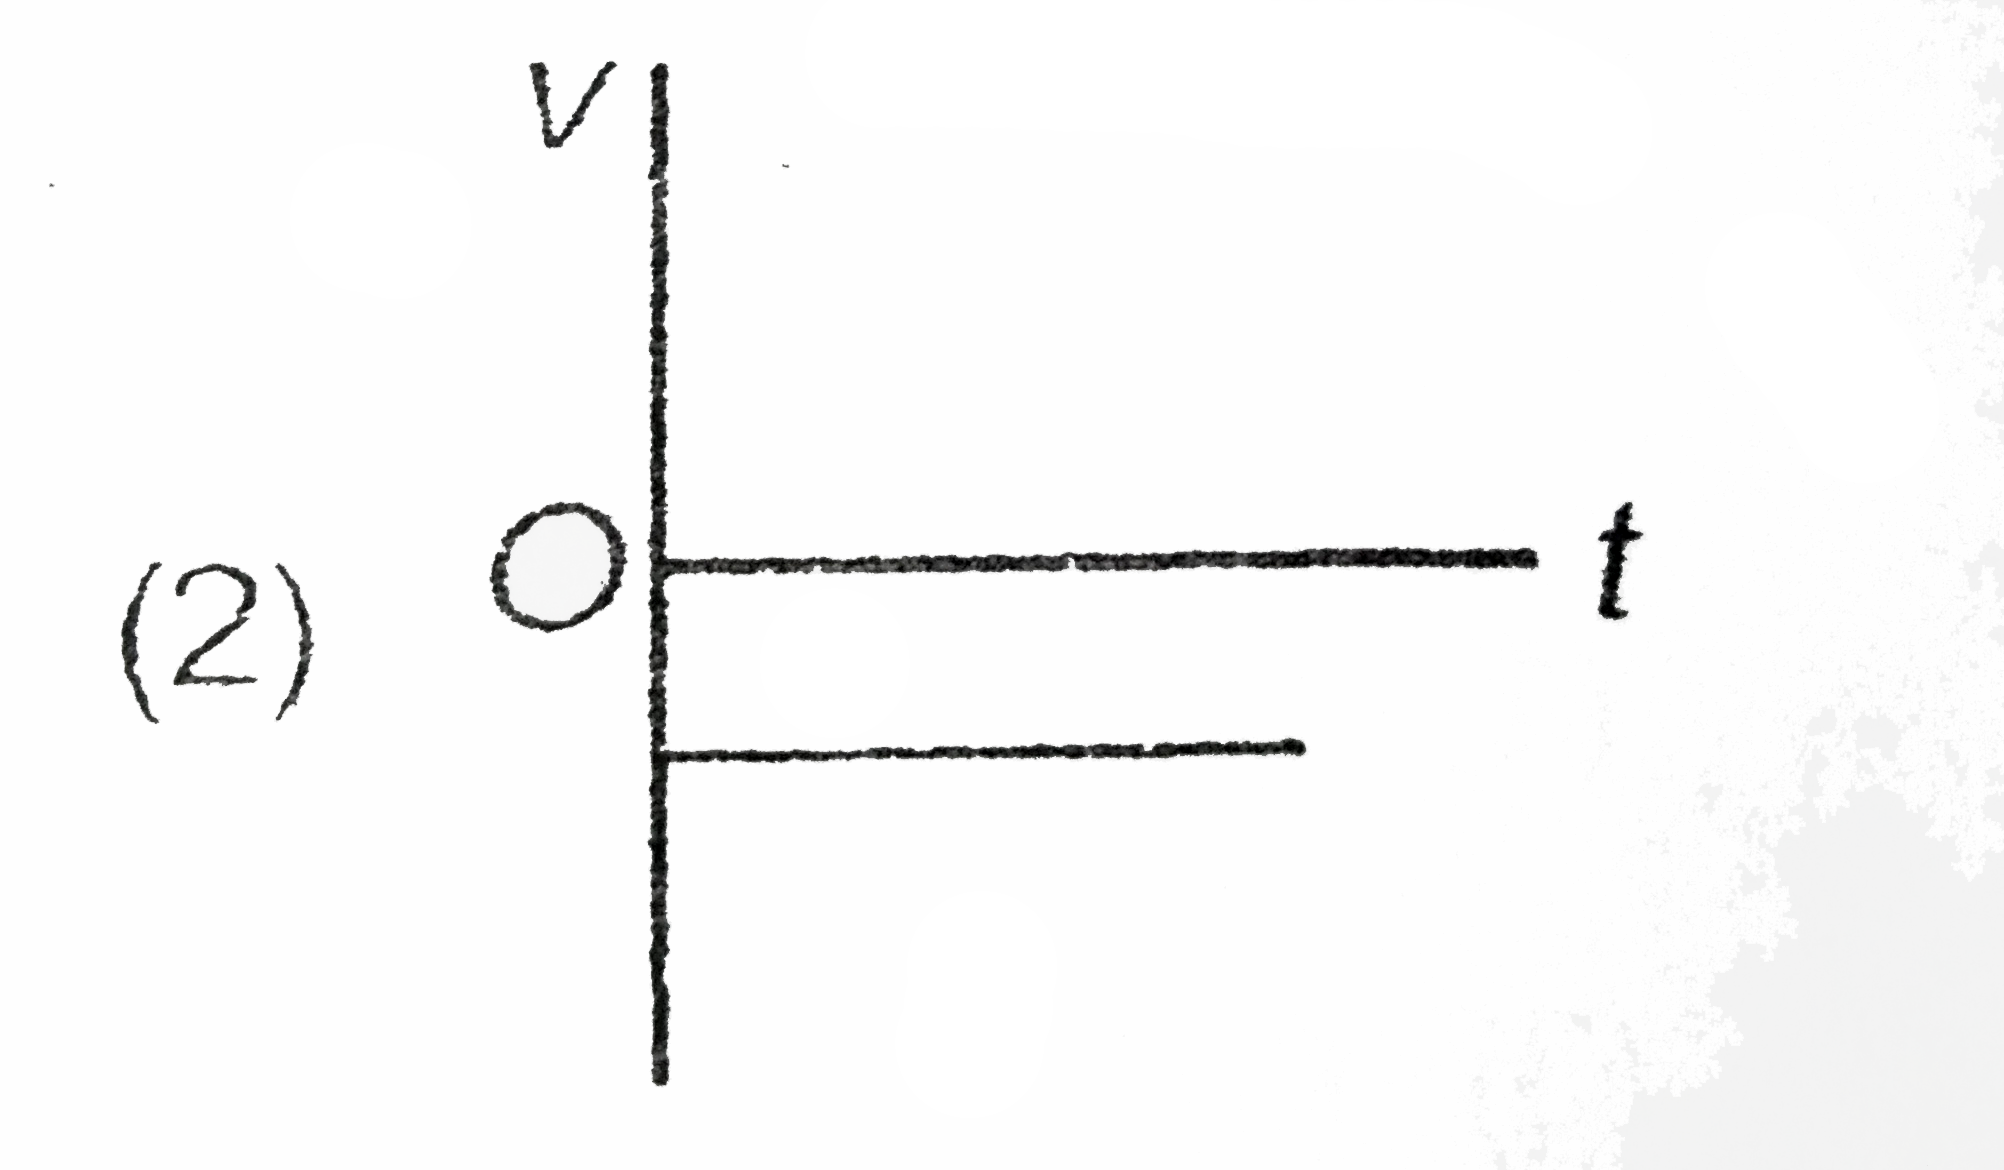 C
C D
D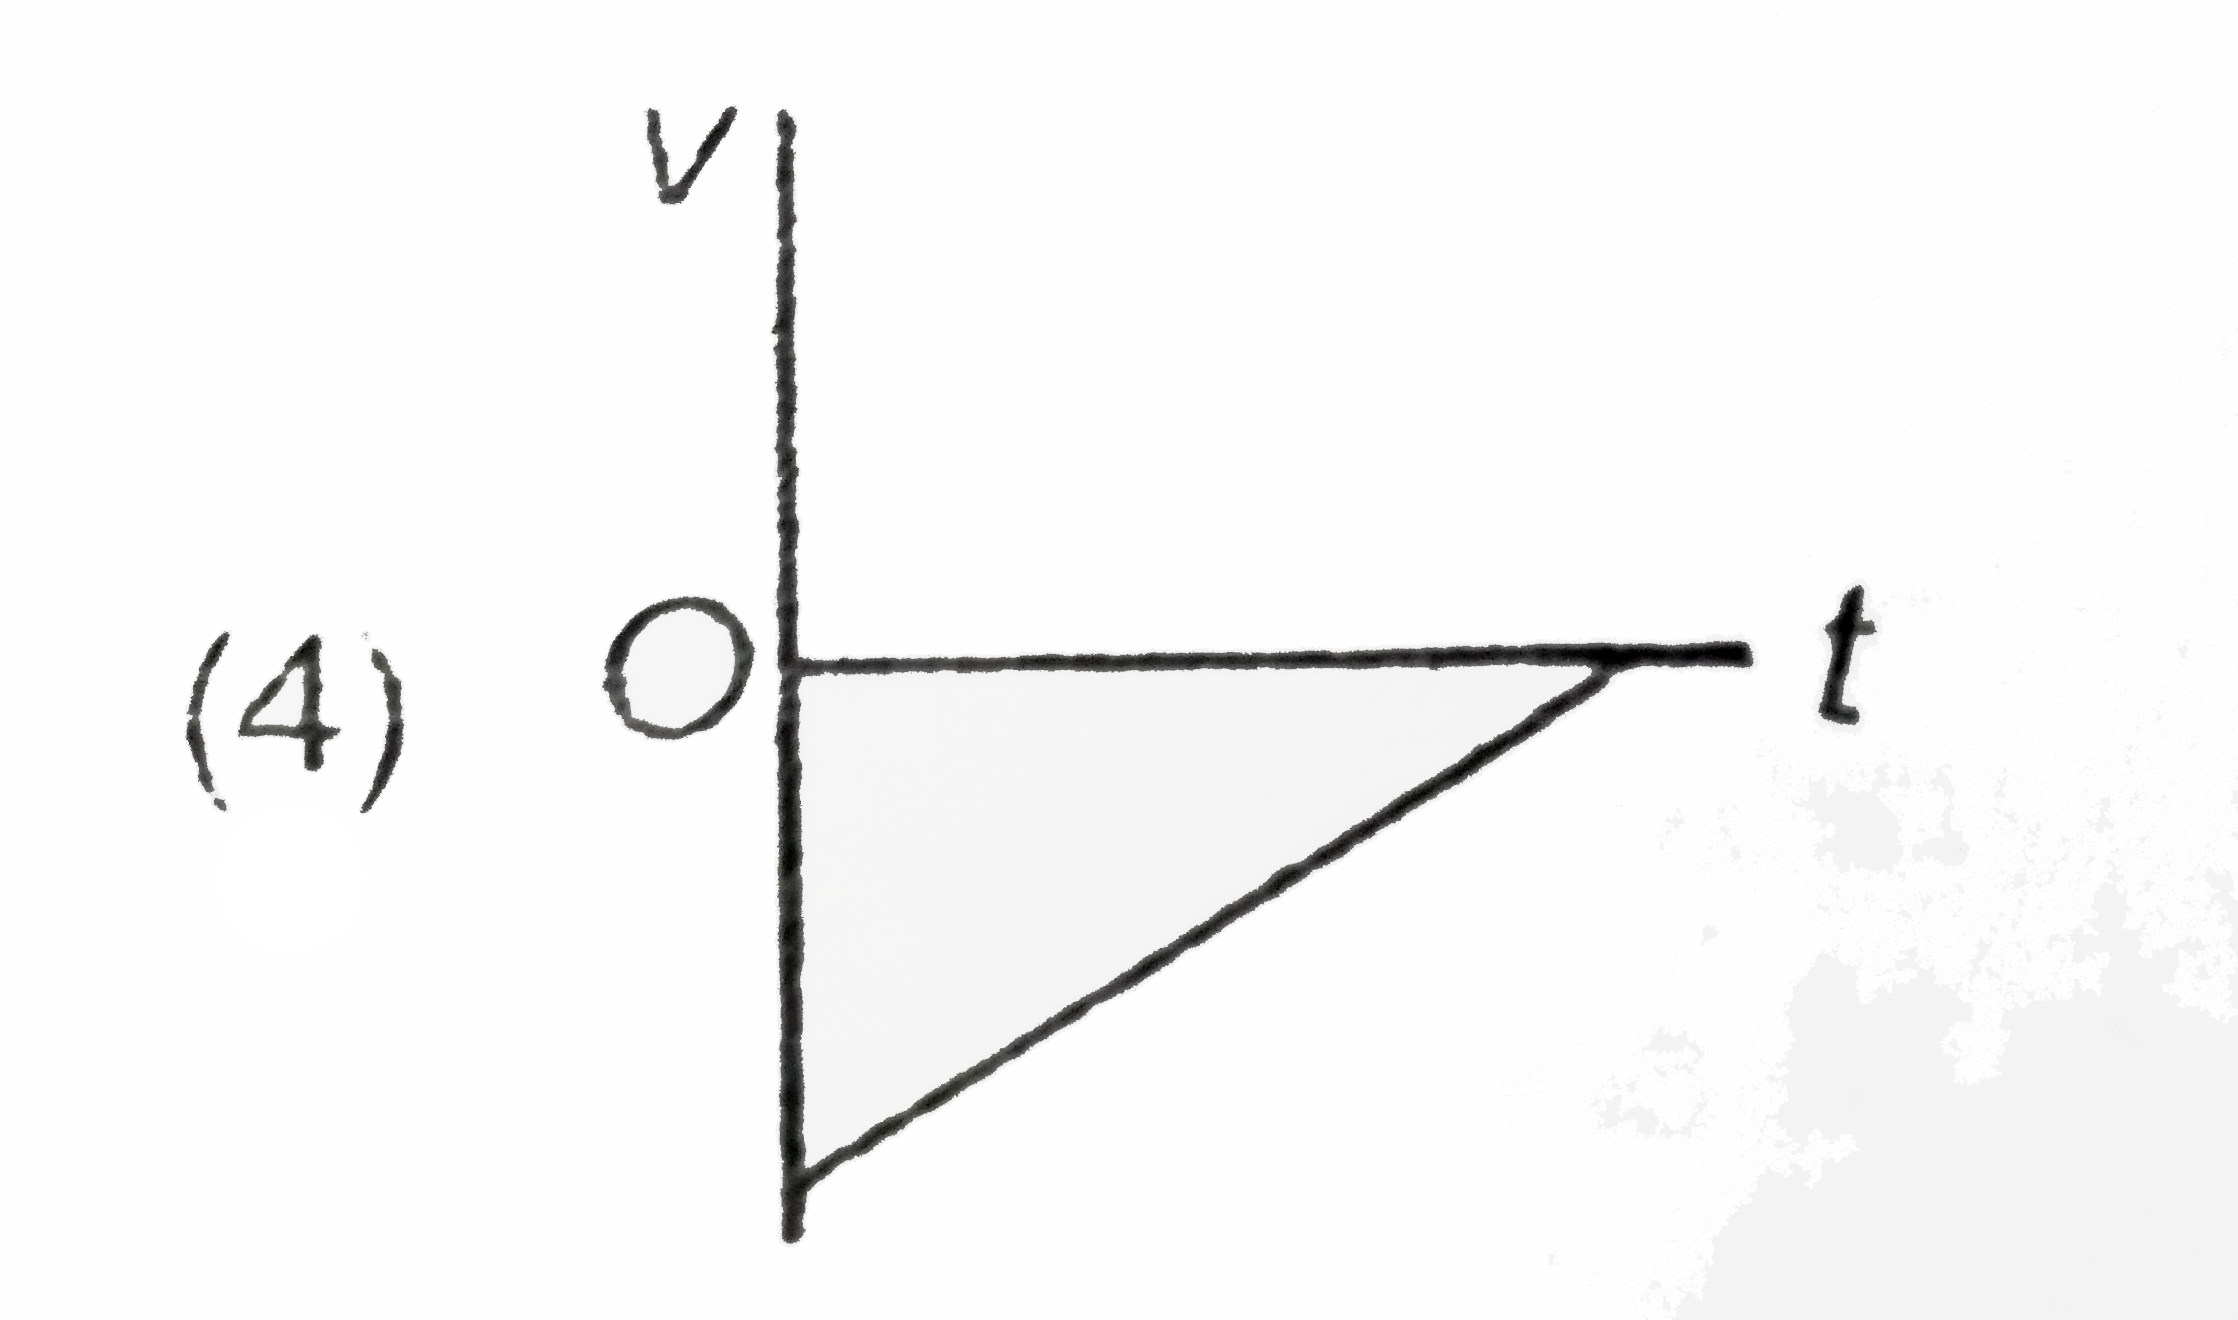
Which of the following graphs represents the position time-graph of a particle moving with negative velocity?
A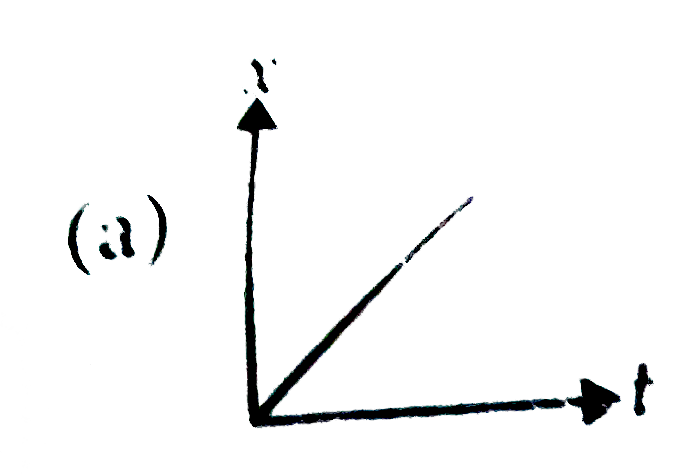 B
B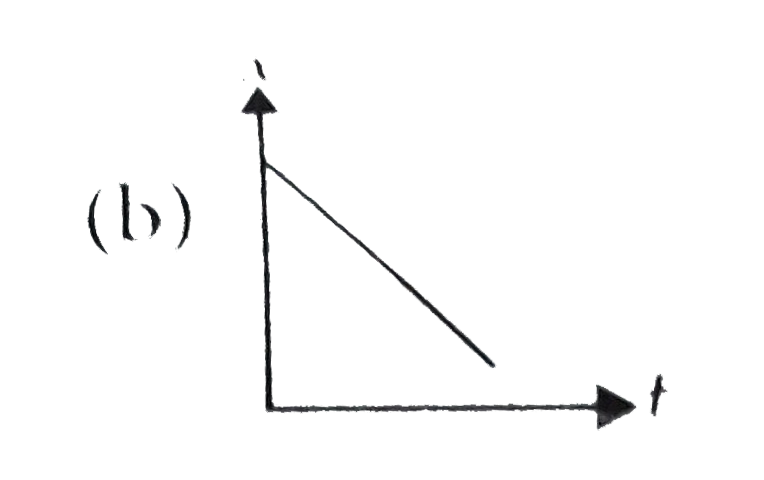 C
C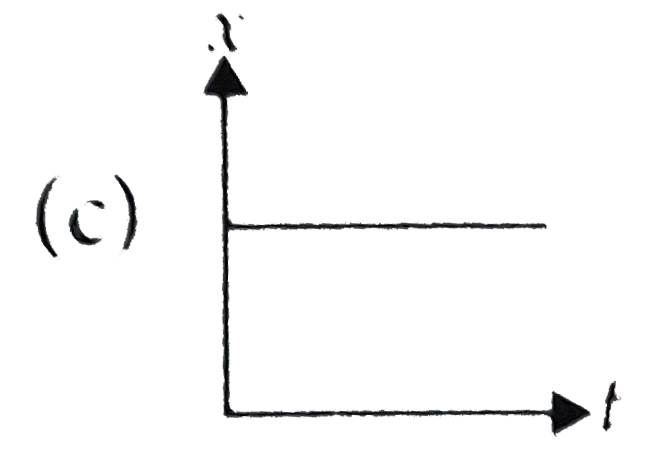 D
D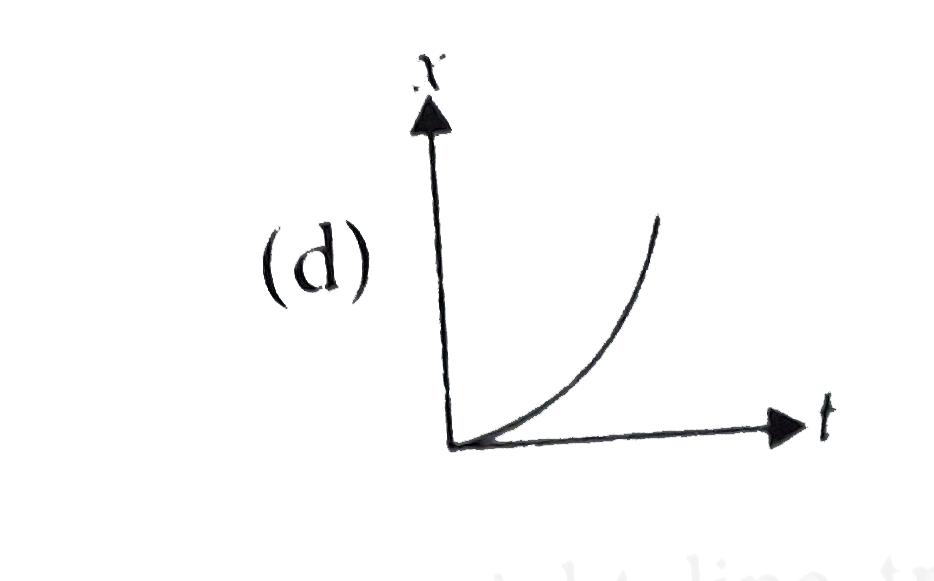
Are the following velocity − time graph and speed − time graphs possible ?

View SolutionAre the following velocity − time graph and speed − time graphs possible ?

View SolutionWhich of the following graphs represents the position time-graph of a particle moving with negative velocity?
View SolutionA ball is thrown vertically upwards. Which of the following graph/graphs represent velocity time graph of the ball during its flight ( air resistance is neglected).
View SolutionFigure shows a graph of potential energy.
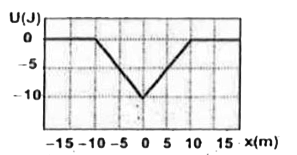
Consider the following graphs of position and time.
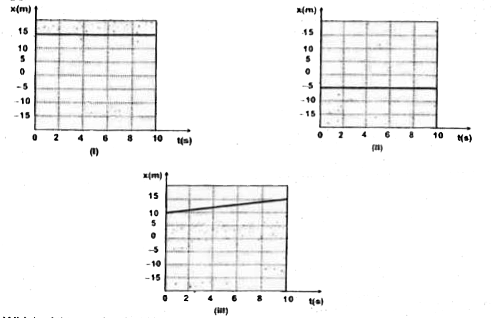
Which of the graphs could be the motion of a particle in the given potential?
View Solution

