The frequency response curve of RC coupled amplifier is shown in figure. The band width of the amplifier will be
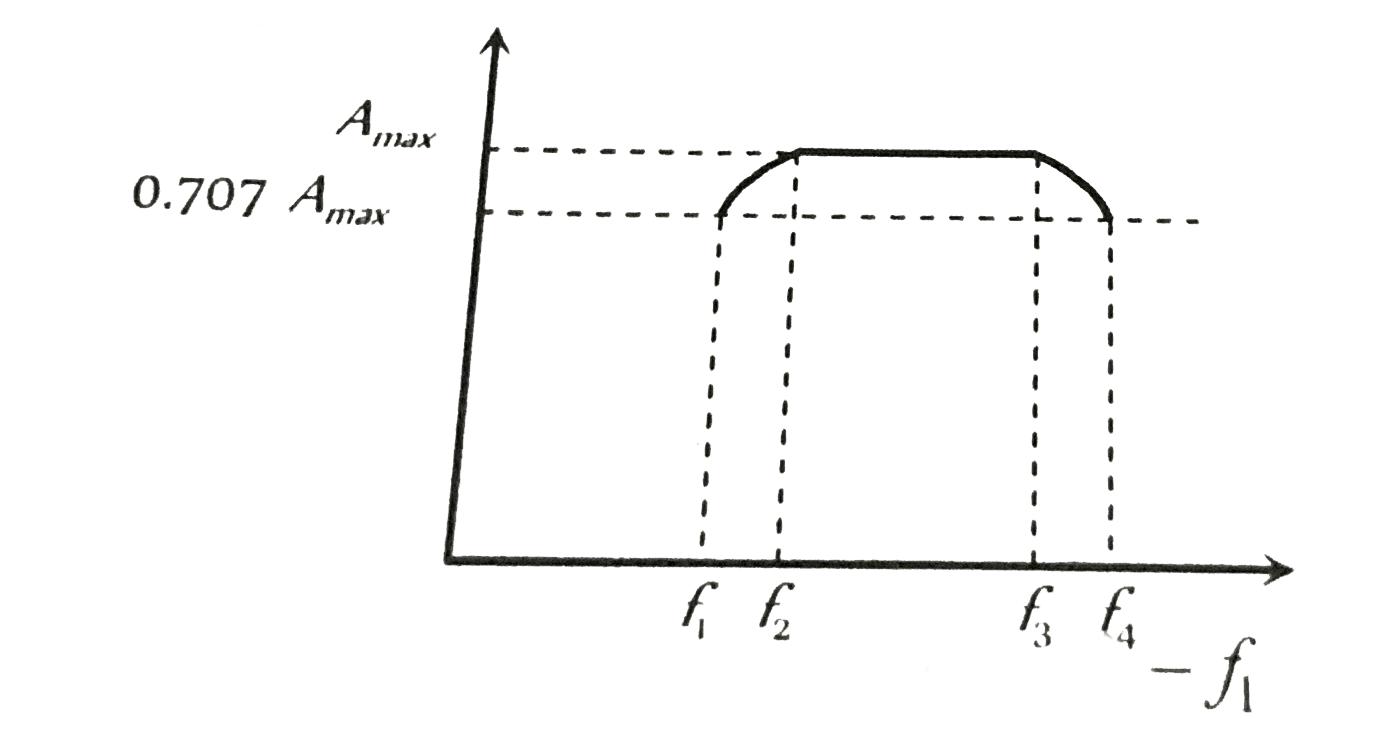
f3−f2
f4−f1
f4−f22
f3−f1
The correct Answer is:B
Step by step video, text & image solution for The frequency response curve of RC coupled amplifier is shown in figure. The band width of the amplifier will be by Physics experts to help you in doubts & scoring excellent marks in Class 12 exams.
Updated on:21/07/2023Topper's Solved these Questions
- ELECTRONICSBOOK - ERRORLESS CHAPTER - ELECTRONICSEXERCISE - Digital Electronics
2 Videos
- ELECTRONICSBOOK - ERRORLESS CHAPTER - ELECTRONICSEXERCISE - Valve Electronics (Diode and Triode)
3 Videos
- ELECTRON, PHOTON, PHOTOELECTRIC EFFECT AND X-RAYSBOOK - ERRORLESS CHAPTER - ELECTRON, PHOTON, PHOTOELECTRIC EFFECT AND X-RAYSEXERCISE - Self Evaluation Test
3 Videos
- ELECTROSTATICS BOOK - ERRORLESS CHAPTER - ELECTROSTATICS EXERCISE - Ordinary Thinking Objective Questions (Electric Flux and Gauss.s Law)
28 Videos
Similar Questions
Knowledge Check
The voltage gain of the amplifier shown in Fig.is
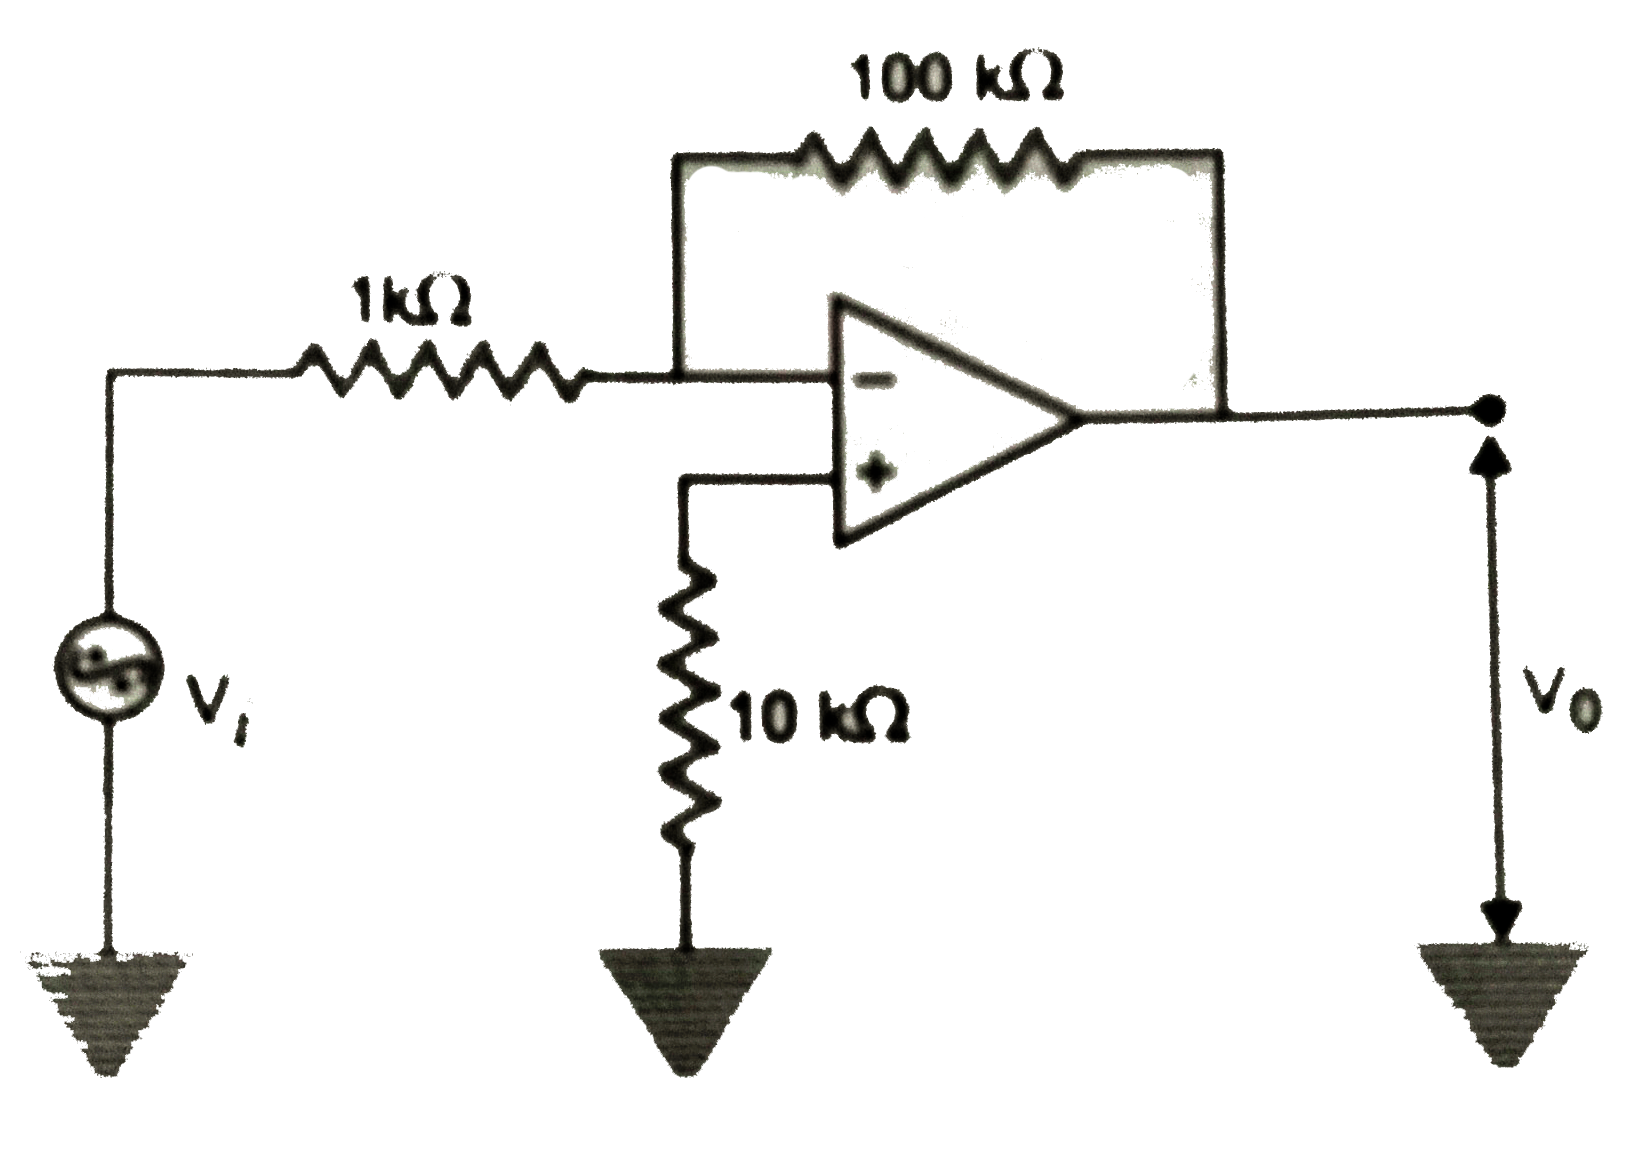 A10B100C1000D9.9
The frequency of oscillation of the springs shown in the figure will be
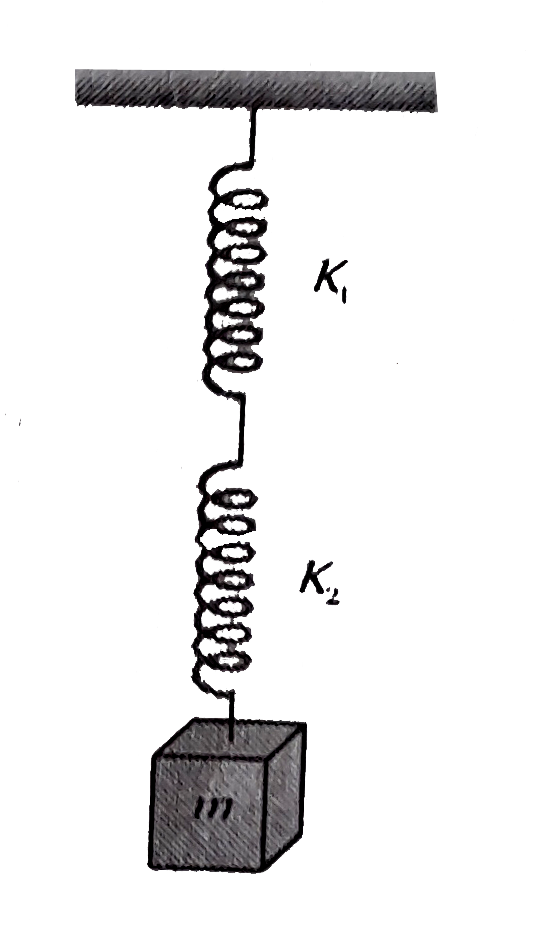 A12π√KmB12π√(K1+K2)K1K2C12π√kmD12π√K1K2m(K1+K2)
The frequency of oscillation of the spring shown in the figure will be
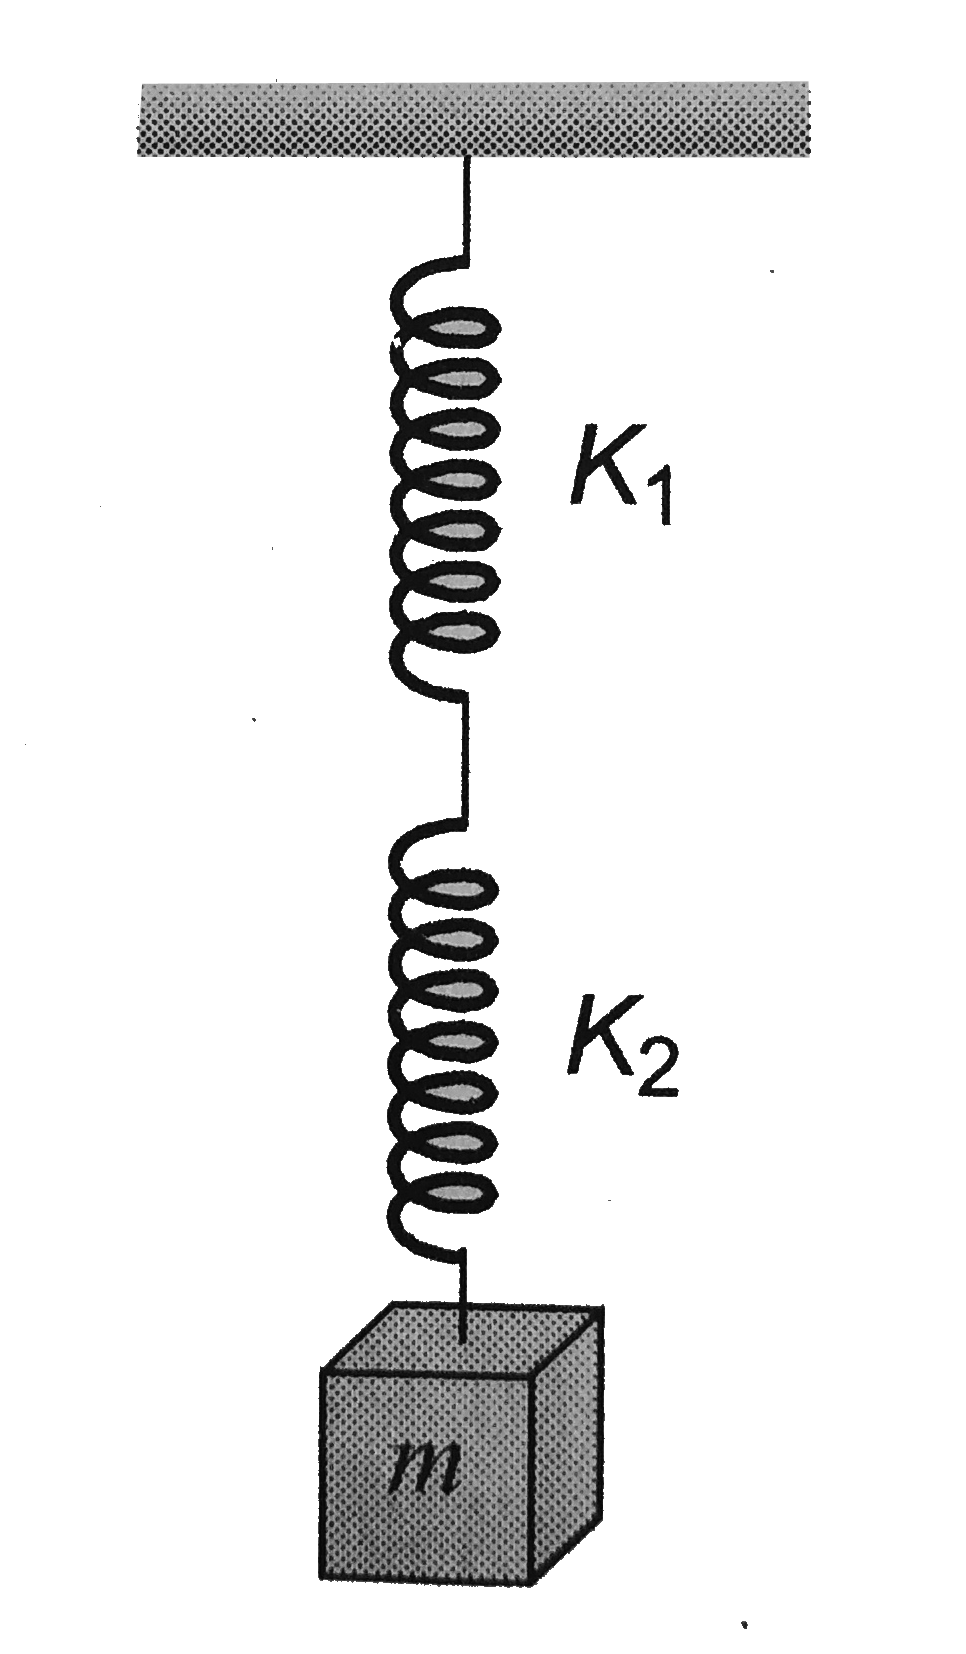 A12π√KmB12π√(K1+K2)mK1K2C2π√KmD12π ⎷(K1K2m(K1+K2))
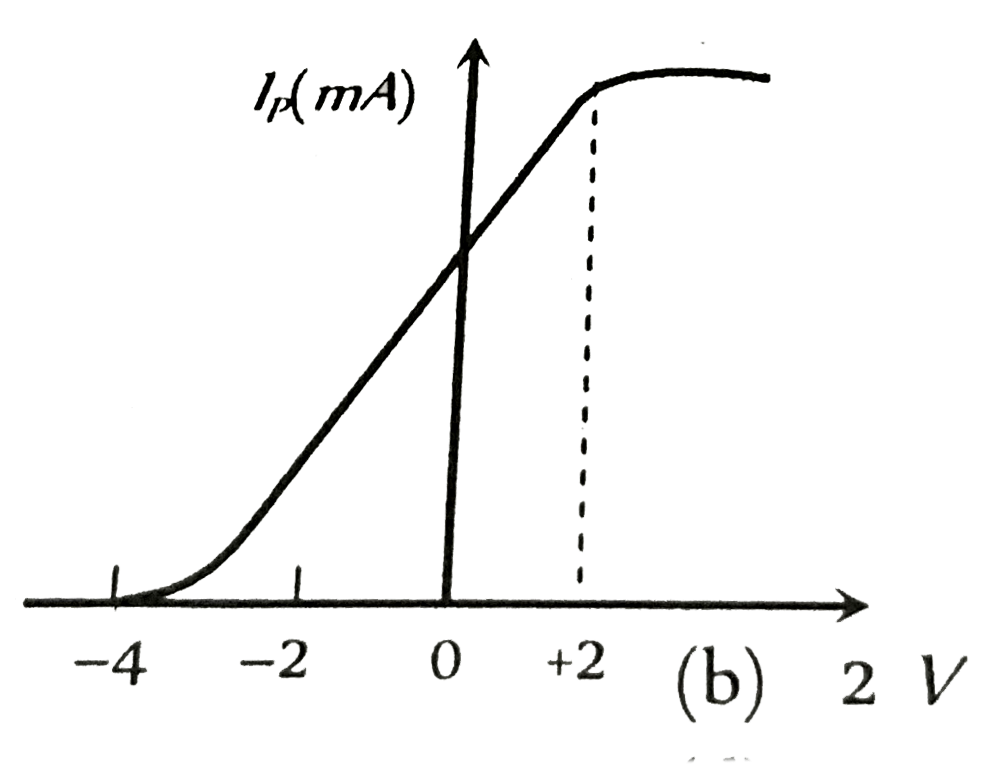
The mutual characteristic curves of a triode are as shown in figure. The cut off voltage for the triode is
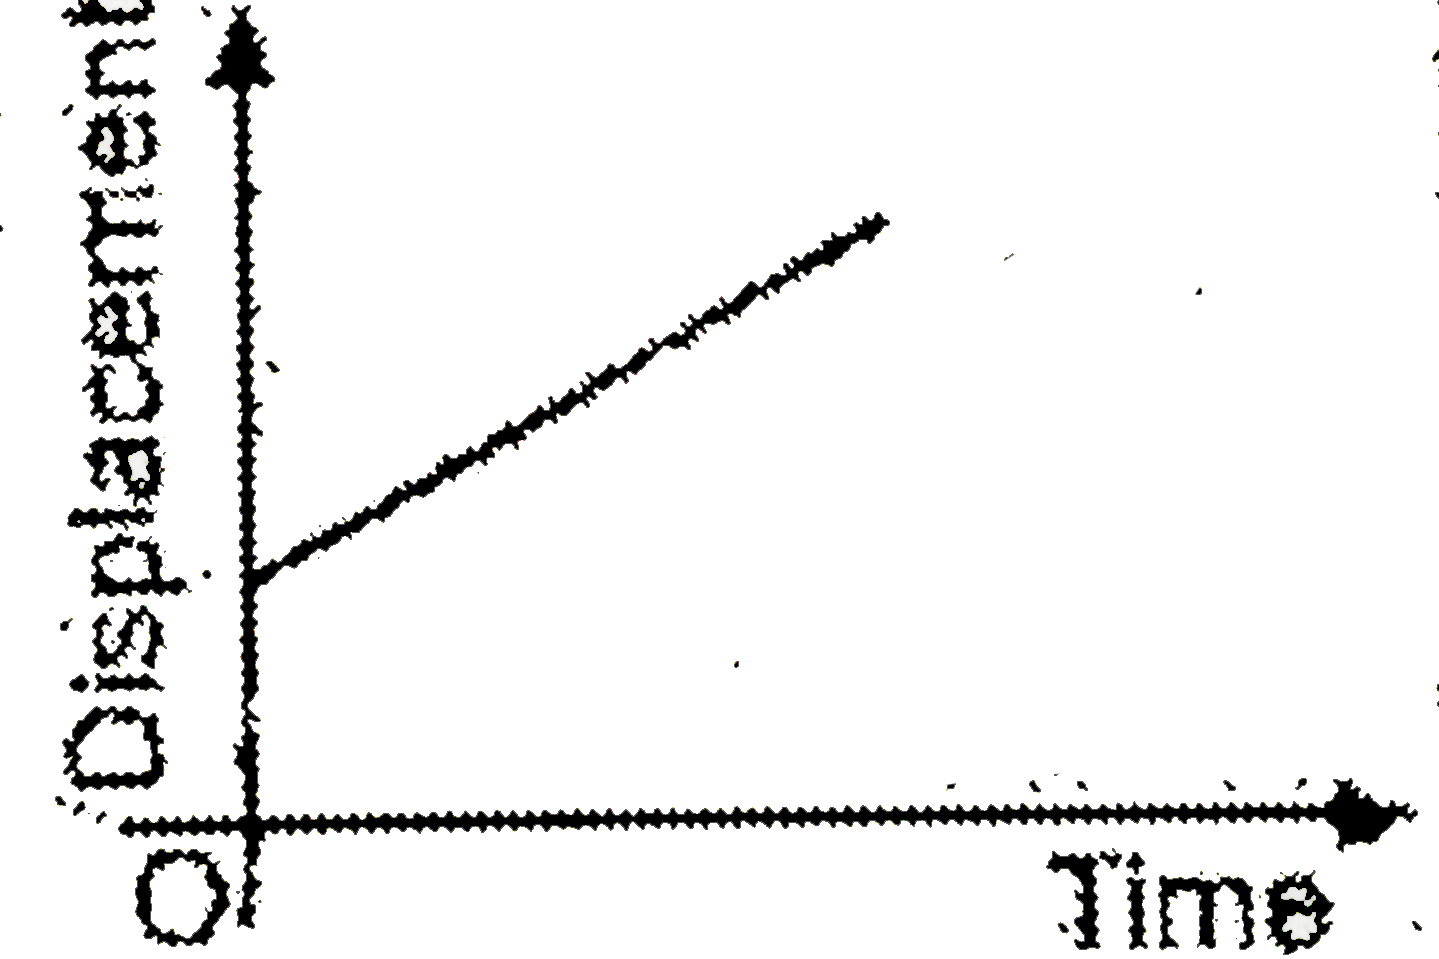
View SolutionThe displacement time curve of a particle is shown in the figure. The external force acting on the particle is :
View SolutionAn amplitude is frequency graph of a frequency medulatal wave is given as shown in the figure.
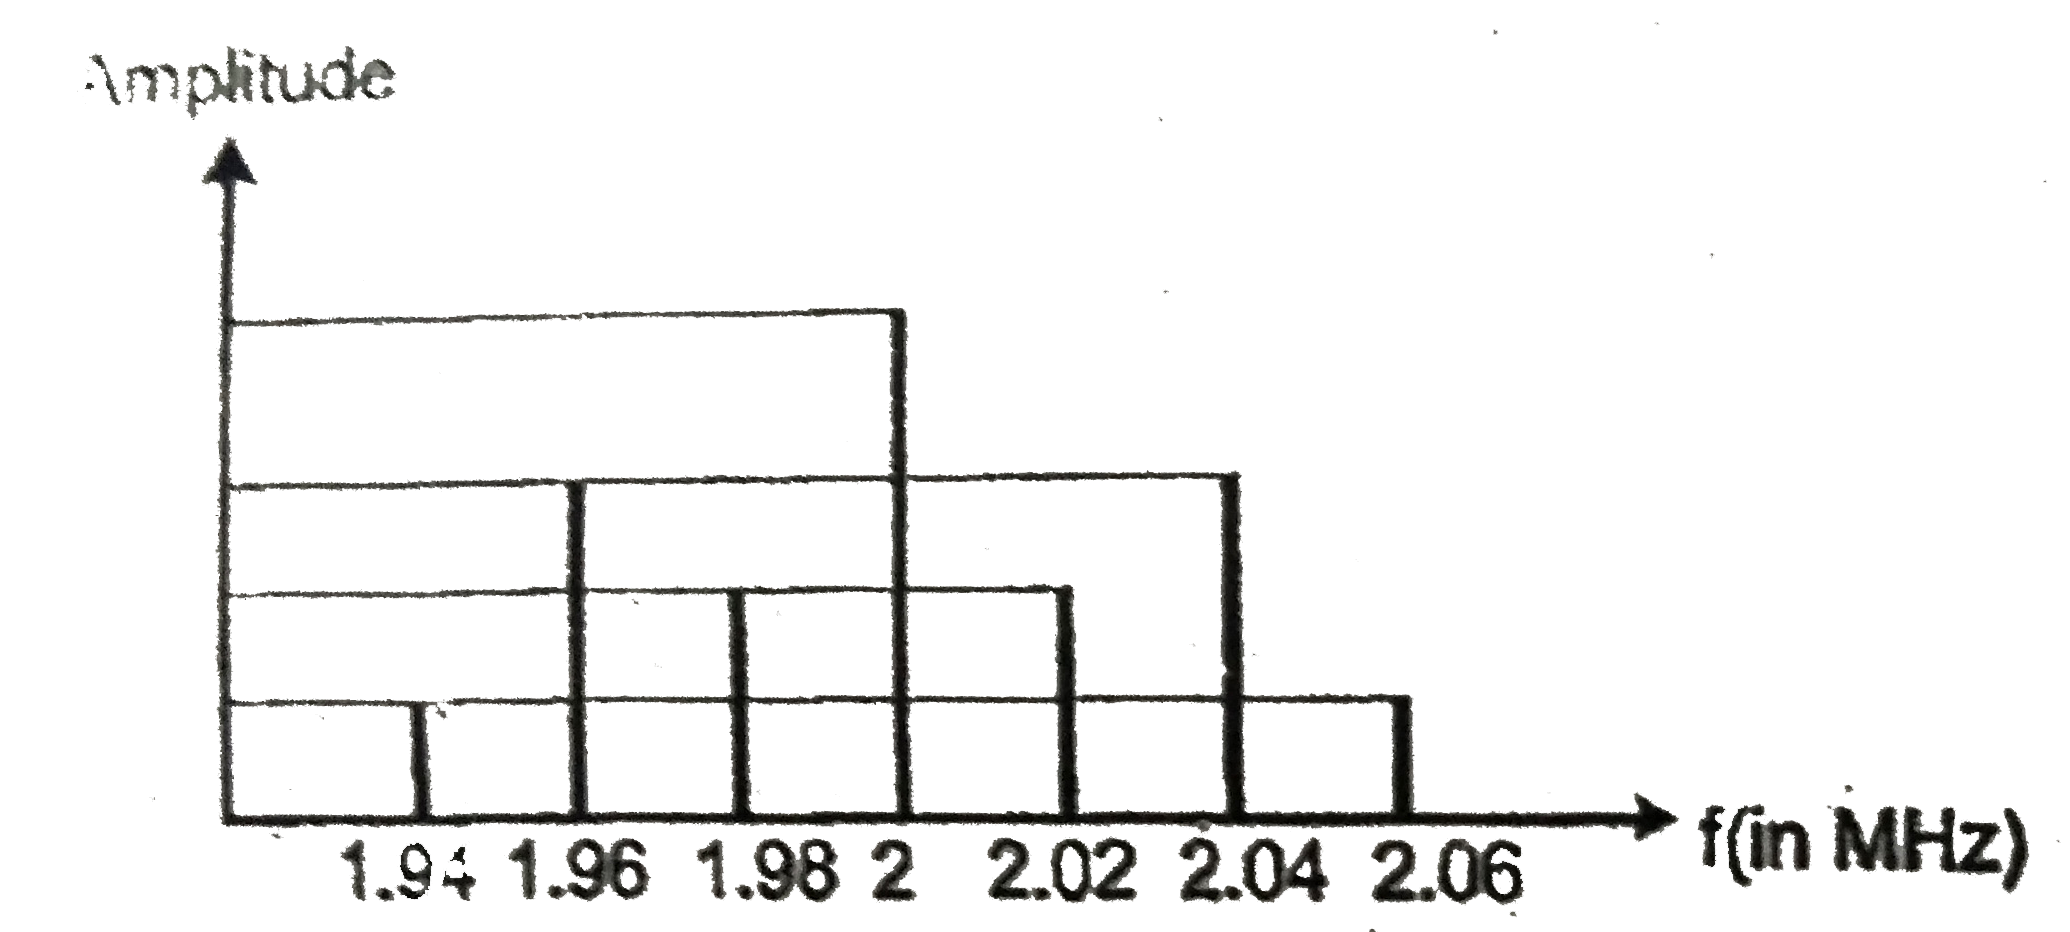
Frequency index of this wave be
View SolutionThe emission spectrum of a black body at two different temperatures are shown by curves P and Q (as shown in figure). The ratio of the areas under the two curves P and Q will be
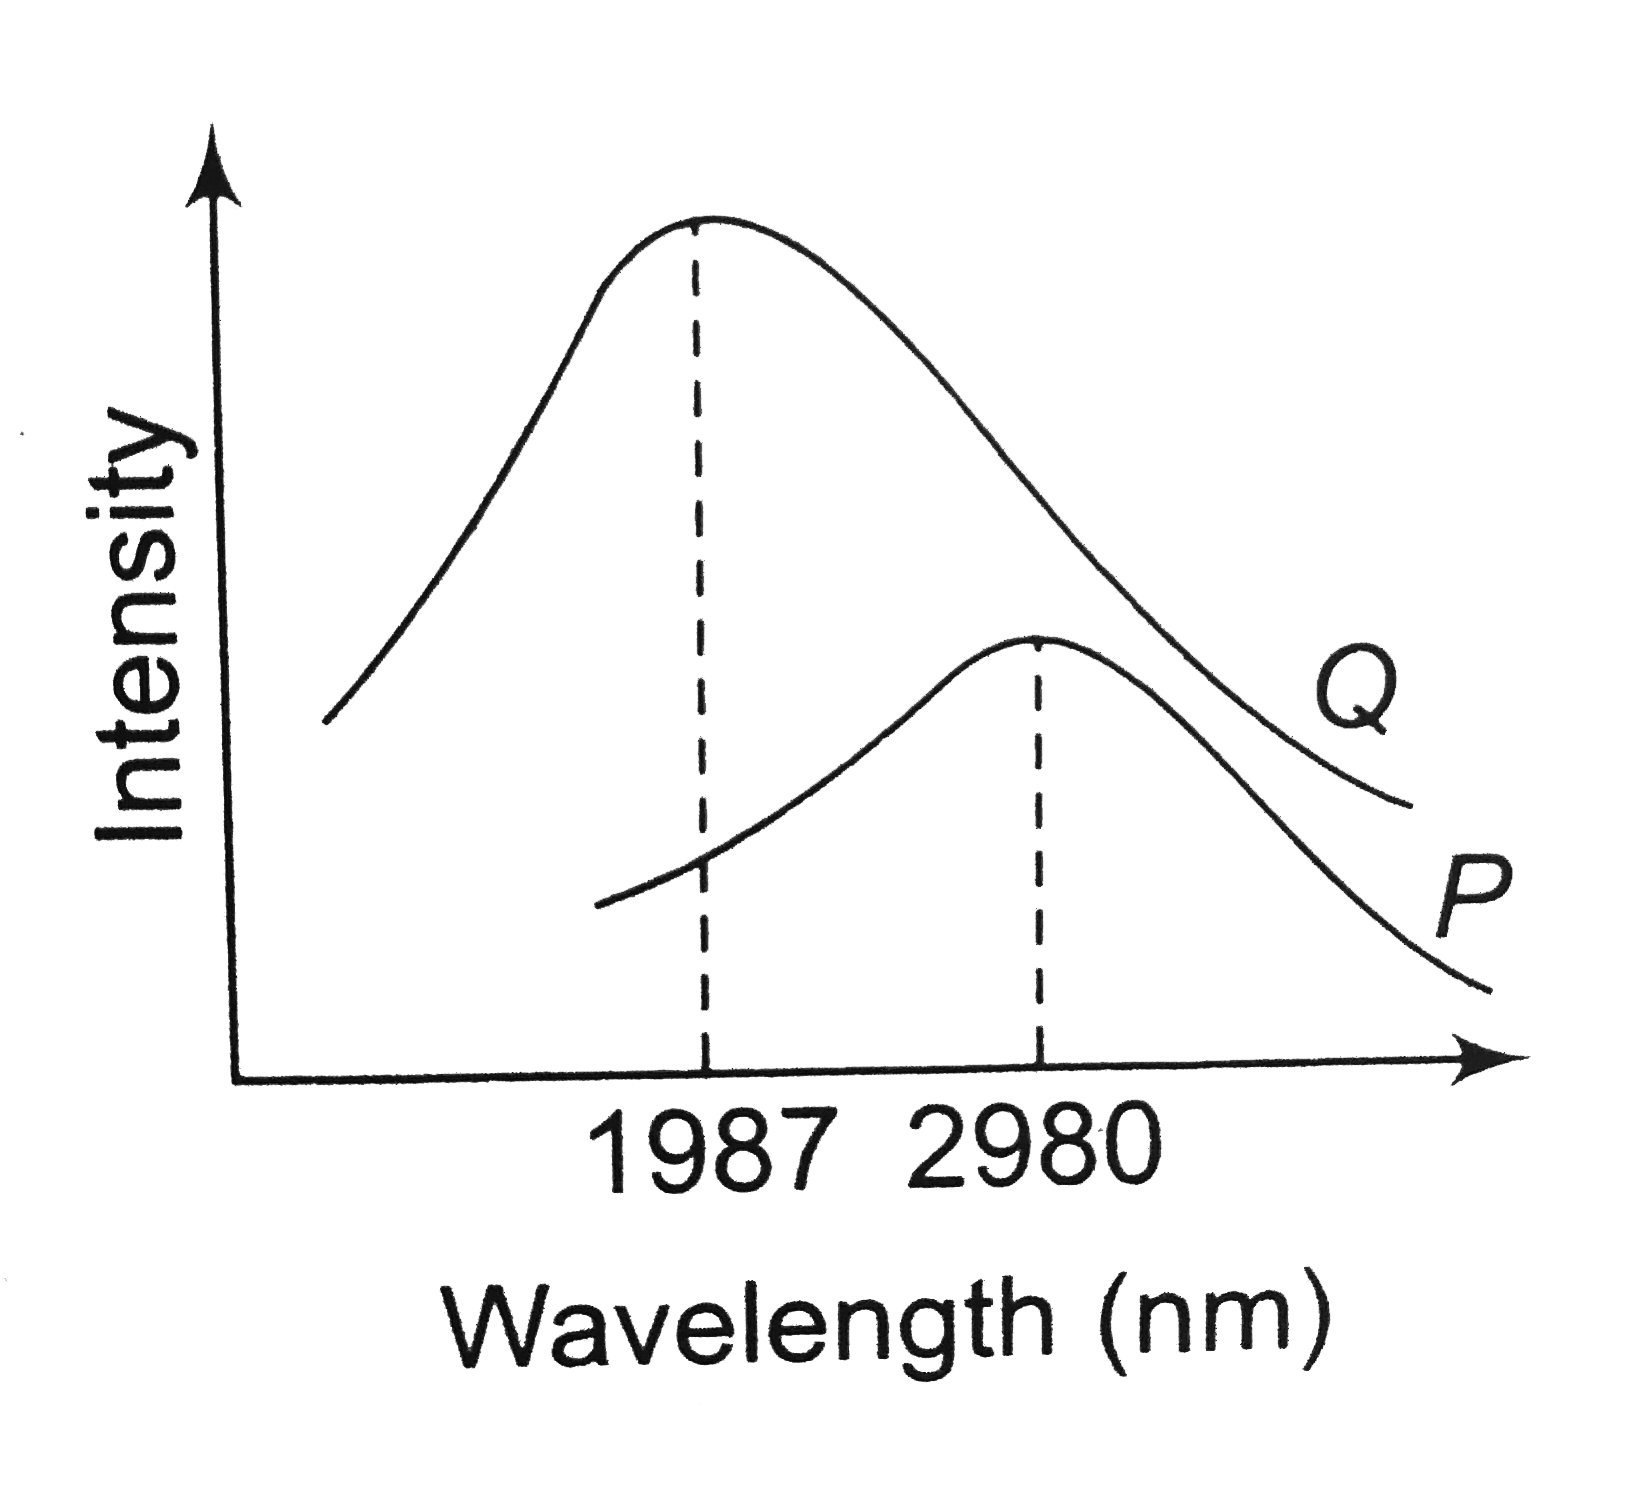
View SolutionThe frequency response curve (figure) for the filter circuit used for production of AM wave should be

View Solution

