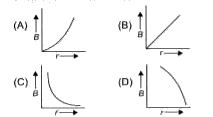
The graph showing the variation of the magnetic field strength (B) with distance (n) from a long current carrying conductor is
Video Solution
Text Solution
The magnetic field strength (B) at the distance (r) from a long current carrying conductor is given by
B=μ02πlr
For given current, Br = constant
i.e., as r increase, magnetic field B decrease. So, option (C) is correct.
|
Topper's Solved these Questions
Similar Questions
Knowledge Check
Which one of the following graphs shows the variation of magnetic induction B which distance r from a long wire carrying a current ?
A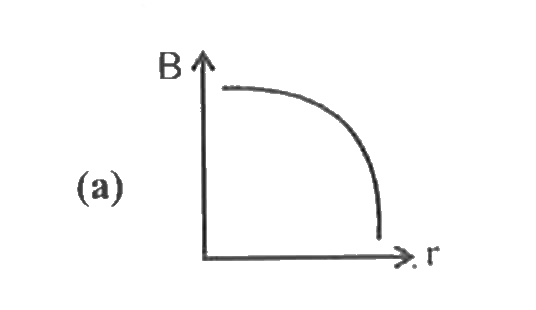 B
B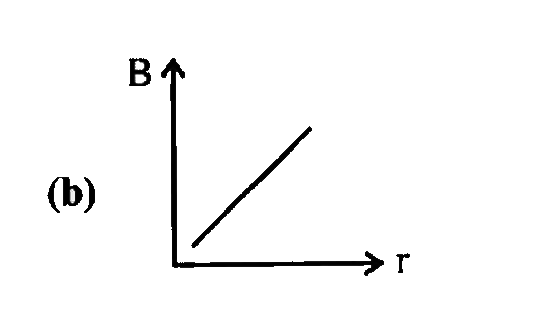 C
C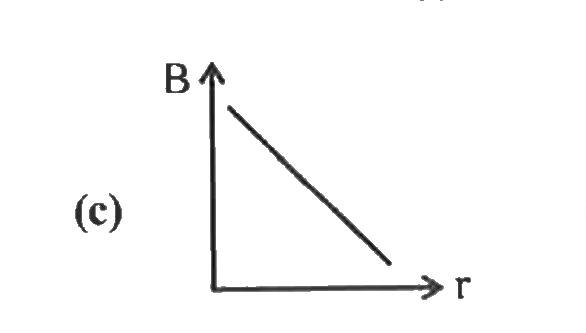 D
D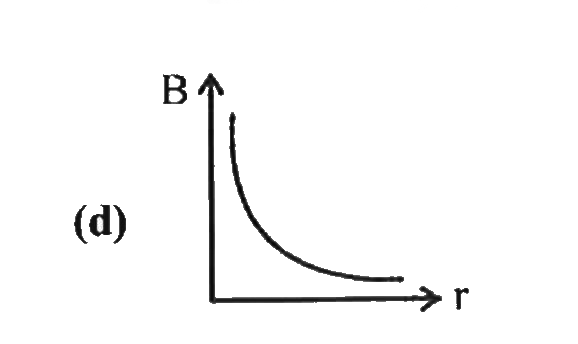
Which of the following graphs shows the variation of magnetic induction B with distance r from a long wire carrying current
A B
B C
C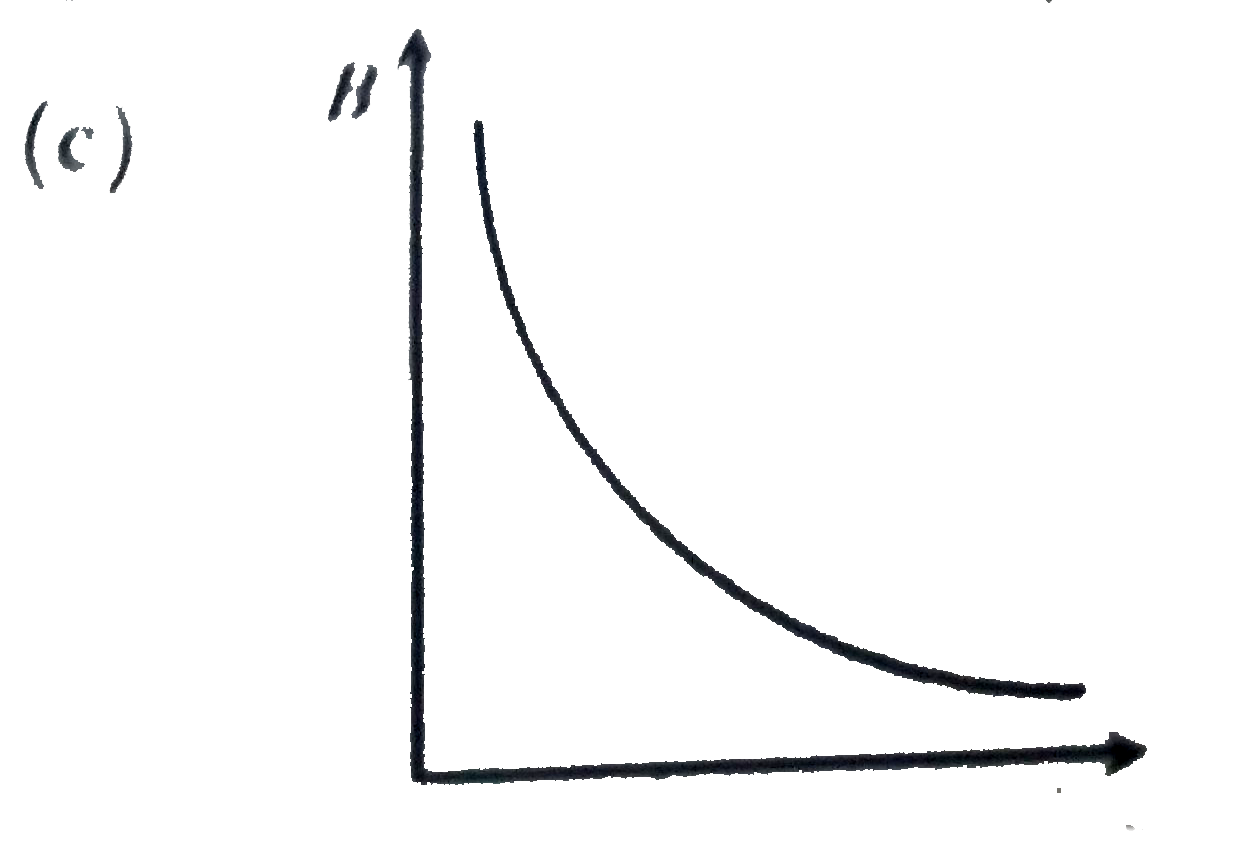 D
D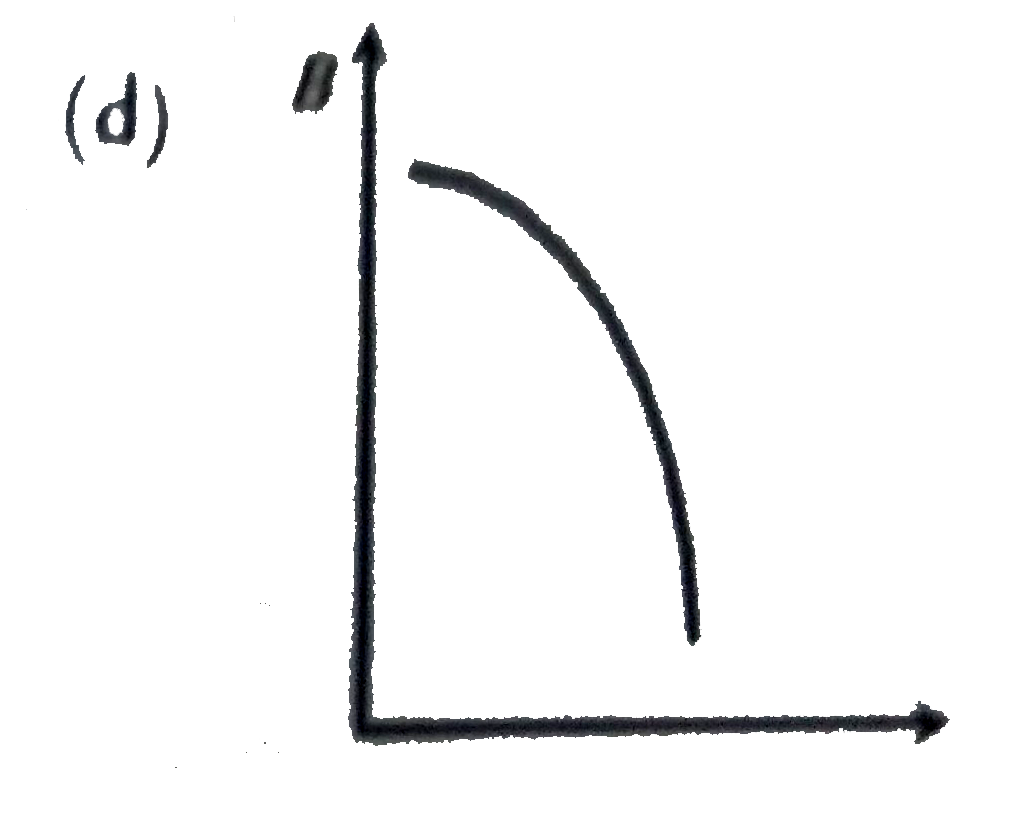
Variation of magnetic field with distance from current carrying conductor is:
AB∝a2BB∝1a2CB∝aDB∝1a
What is the relation between magnetic field (B), current (I) and distance (r) in case of a straight current-carrying conductor?
View SolutionThe strength of the magnetic field around a long straight current carrying conductor :
View SolutionMagnetic Field due to a Current Carrying Conductor
View SolutionThe magnetic field near a current carrying conductor is given by
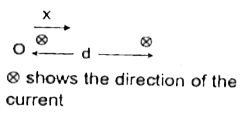
View SolutionWhich graph approximately shows the plot of magnetic field (B) with x between two current carrying conductors (as shown in the adjacent figure) if one of the conductors is at origin and they are separated by a distance d.
View Solution

