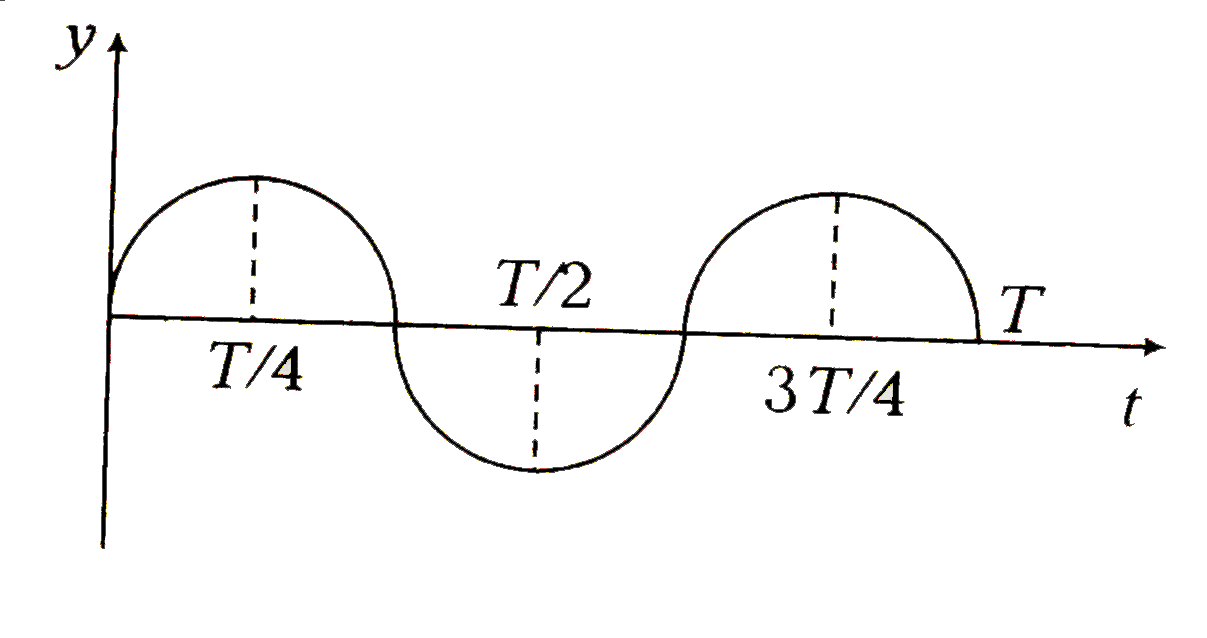
The graph shows the variation of displacement of a particle executing SHM with time . We infer from this graph that

A
the force is zero at time 3T4
B
the velocity is maximum at time T2
C
the acceleration is maximum at time T
D
the PE is equal to total energy at time T2
Video Solution
Text Solution
The correct Answer is:D
(d) At time T2,v=0
∴ Total energy =Potential energy
|
Similar Questions
Knowledge Check
The graph shows the variation of displacement of a particle executing SHM with time . We infer from this graph that
 Athe force is zero at time 3T4Bthe velocity is maximum at time T2Cthe acceleration is maximum at time TDthe PE is equal to total energy at time T2
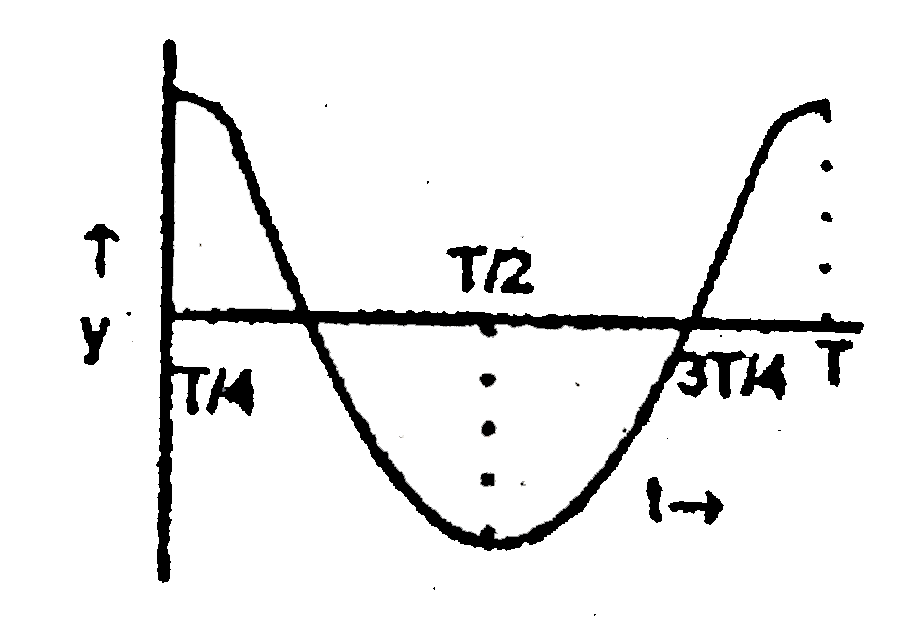
The graph shows the variation of displacement of a particle executing S.H.M with time. We inference form this graph that :-
_E01_037_Q01.png) Athe force is zero at time 3T4Bthe velocity is maximum at time T2Cthe acceleration is maximum at time TDthe P.E. is equal to half of total energy at time T2
Athe force is zero at time 3T4Bthe velocity is maximum at time T2Cthe acceleration is maximum at time TDthe P.E. is equal to half of total energy at time T2The graph plotted between acceleration and displacement of a particle in SHM is
Aa straight lineBa circleCan ellipseDa hyperbola
Variation of acceleration a of a particle executing HSM with displacement x is
View SolutionThe graph in the figure shows how the displacement of a particle describing S.H.M varies with time. Which one of the following statements is not true ?

View SolutionThe graph between total energy and displacement of a particle performing S.H.M. is
View SolutionThe graph between kinetic energy and displacement of a particle performing S.H.M. is
View SolutionThe graph in the figure shows how the displacement of a particle describing S.H.M. varies with time. Which one of the following statements is not true ?

View Solution
