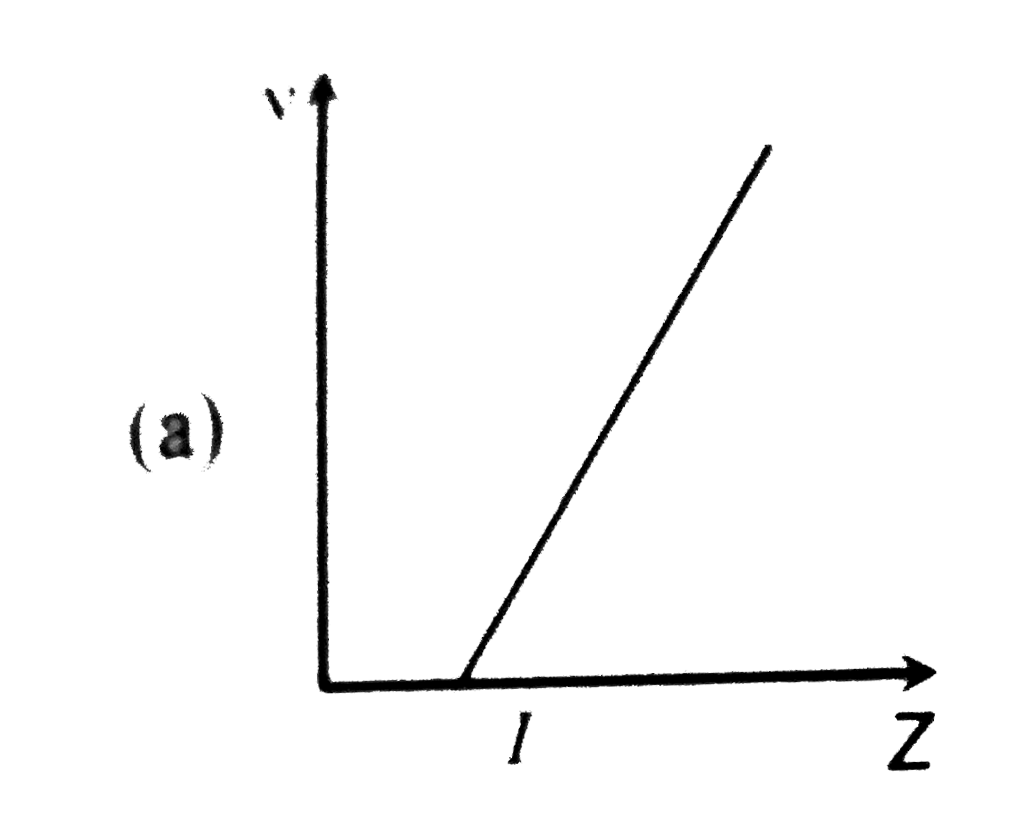
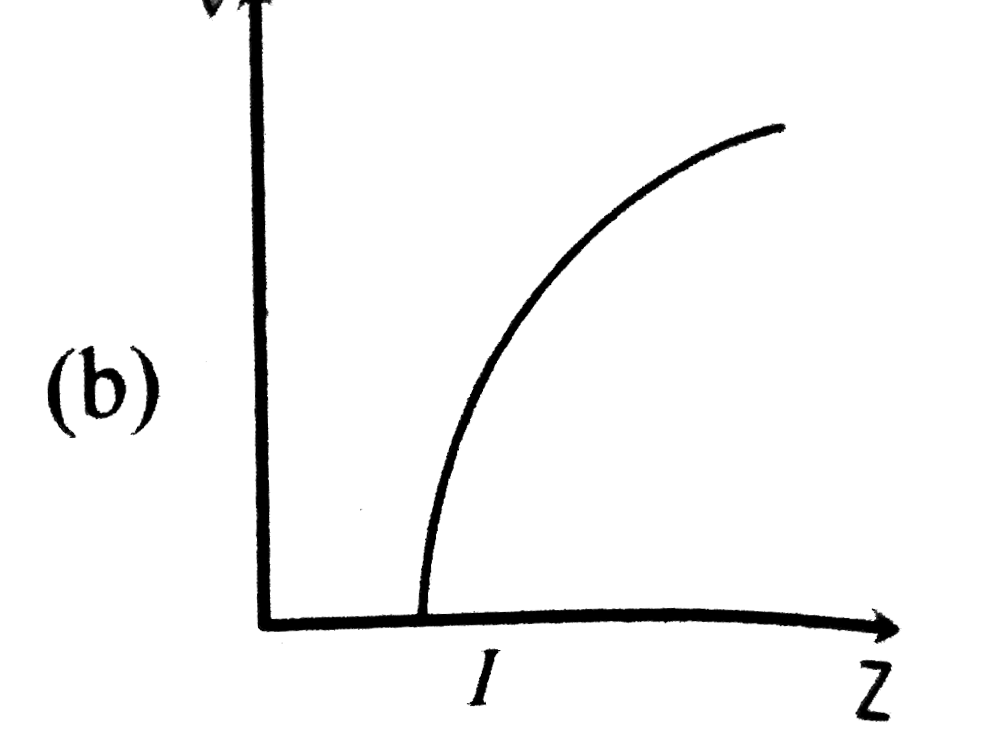
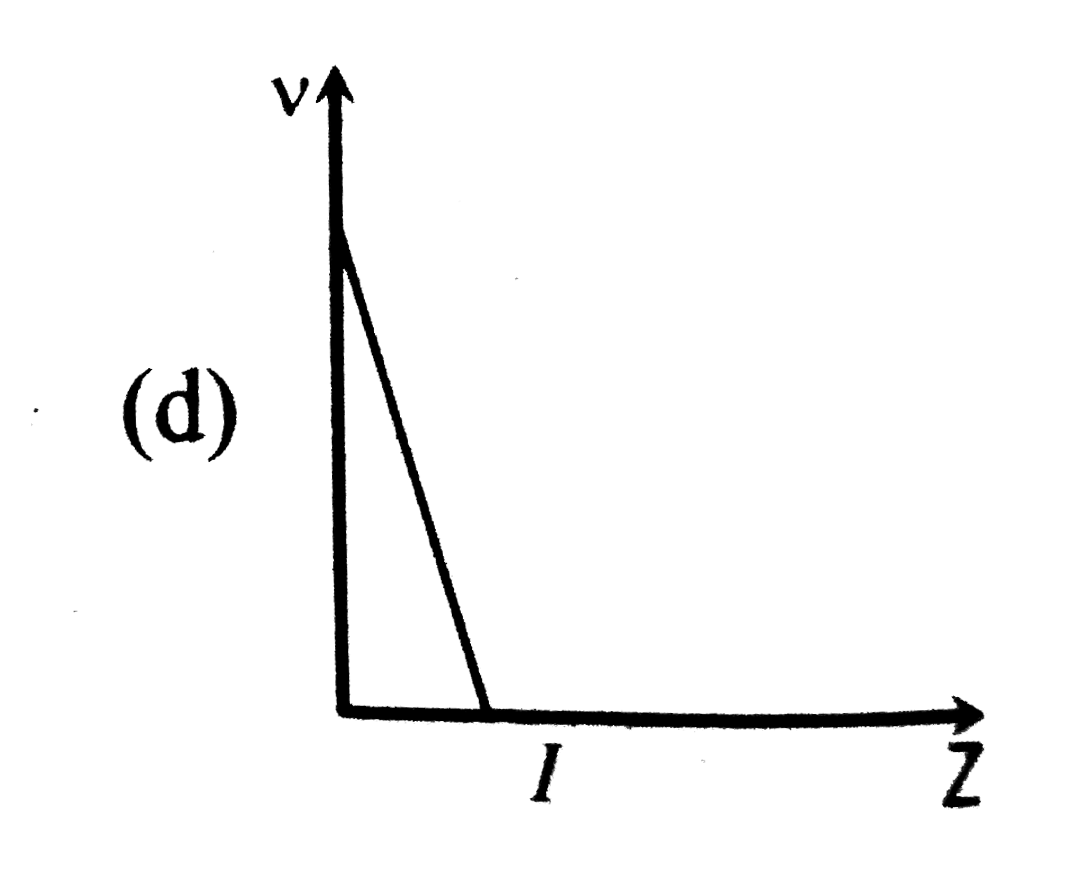
The graph that correctly represents the relation of frequency of a particular characteristic - ray with the atomic number of the material is
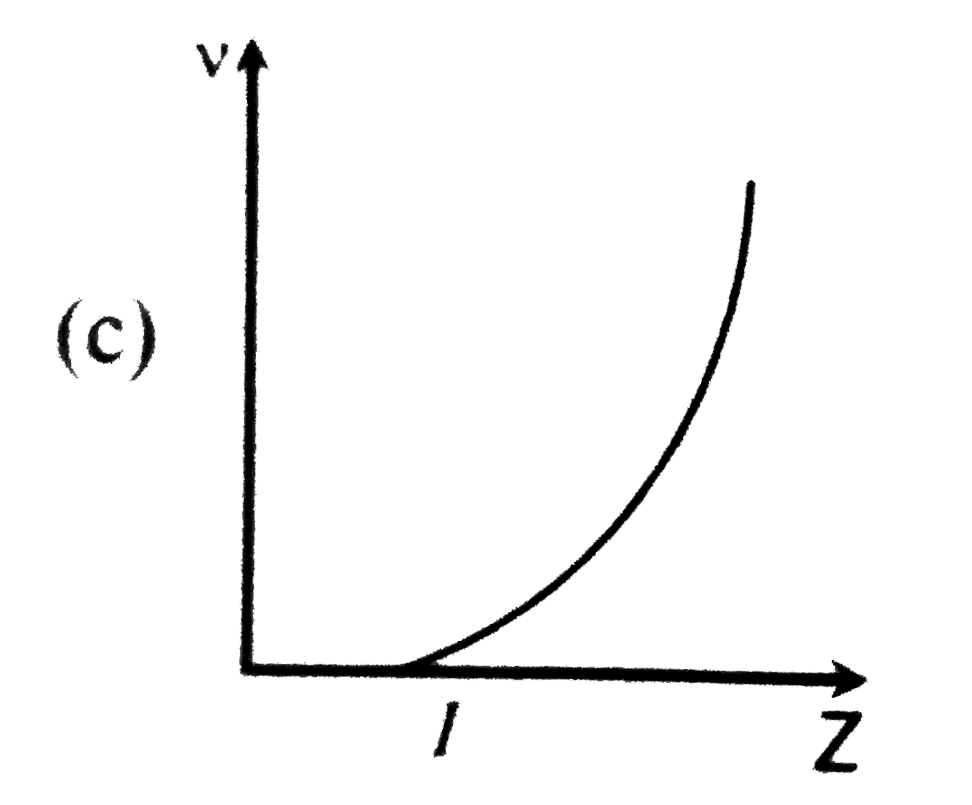
The correct Answer is:C
By Moseley's law , or ,
Comparing with the equation of a parabola , it conforms to graph .
Topper's Solved these Questions
- DUAL NATURE OF RADIATION AND MATTERBOOK - A2ZCHAPTER - DUAL NATURE OF RADIATION AND MATTEREXERCISE - Problems Based On Mixed Concepts
42 Videos
- DUAL NATURE OF RADIATION AND MATTERBOOK - A2ZCHAPTER - DUAL NATURE OF RADIATION AND MATTEREXERCISE - Section B - Assertion Reasoning
18 Videos
- DUAL NATURE OF RADIATION AND MATTERBOOK - A2ZCHAPTER - DUAL NATURE OF RADIATION AND MATTEREXERCISE - Photo Electric Effect
61 Videos
- CURRENT ELECTRICITYBOOK - A2ZCHAPTER - CURRENT ELECTRICITYEXERCISE - Section D - Chapter End Test
29 Videos
- ELECTRIC CHARGE, FIELD & FLUXBOOK - A2ZCHAPTER - ELECTRIC CHARGE, FIELD & FLUXEXERCISE - Section D - Chapter End Test
29 Videos
Similar Questions
Can a hydrogen atom emit characteristic X-ray?
View SolutionA graph of √v ( where v is the frequency of Kα line of the characteristic X-ray spectrum) is plotted against the atomic number Z of the elements emitting the characteristic X-ray .The intercept of the graph on the z -axis is 1 and the slope of the graph is 0.5×10⁸ in SI units. The frequency of the Kα line for an element of atomic number 41 is given as α×1016Hz. Find the value of α.
View Solution
Knowledge Check
For characteristic X - ray of some material
AE(Kγ)<E(Kβ)<E(Kα)BE(Kα)<E(Lα)<E(Mα)Cλ(Kγ)<λ(Kβ)<λ(Kα)Dλ(Mα)<λ(Lα)<λ(Kα)Figure shows the variation of frequency of a characteristic X -ray and atomic number.
 AThe characteristic X-ray is KαBThe characteristic X- ray is KβCThe energy of photon emitted when this X-ray is emitted by a metal having z=101 is 204keVDThe energy of photon emitted when this X-ray is emitted by a metal having z=101 is 102keV
The graph between the square root of the frequency of a specific line of characteristic spectrum of X - rays and the atomic number of the target will be
A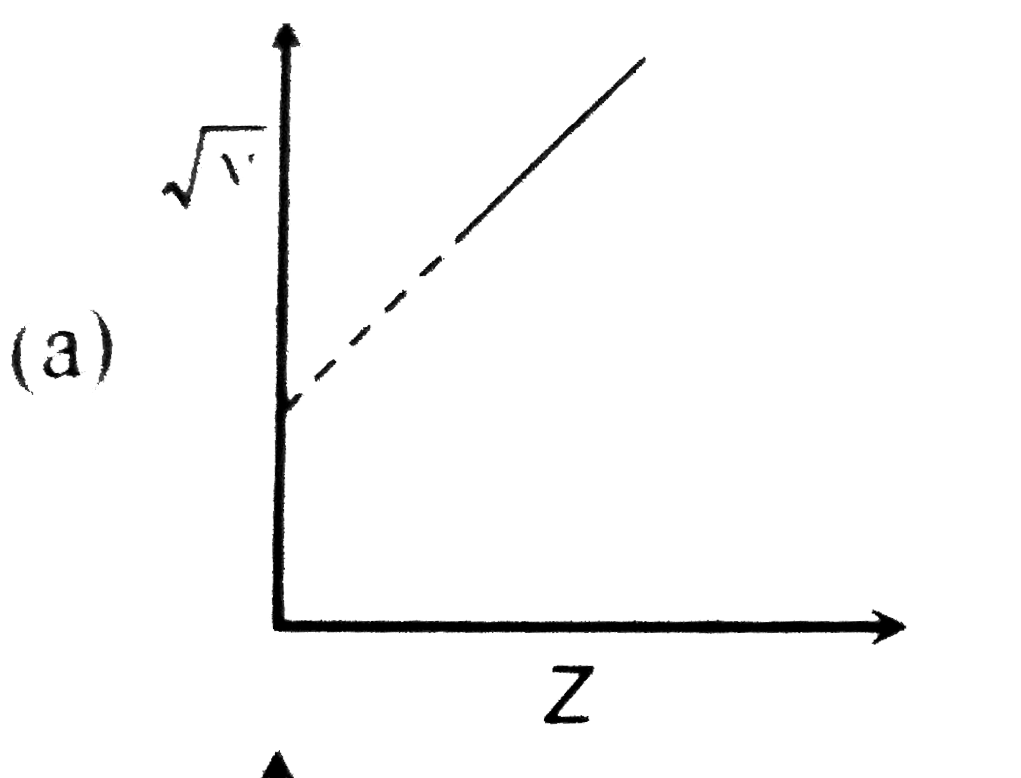 B
B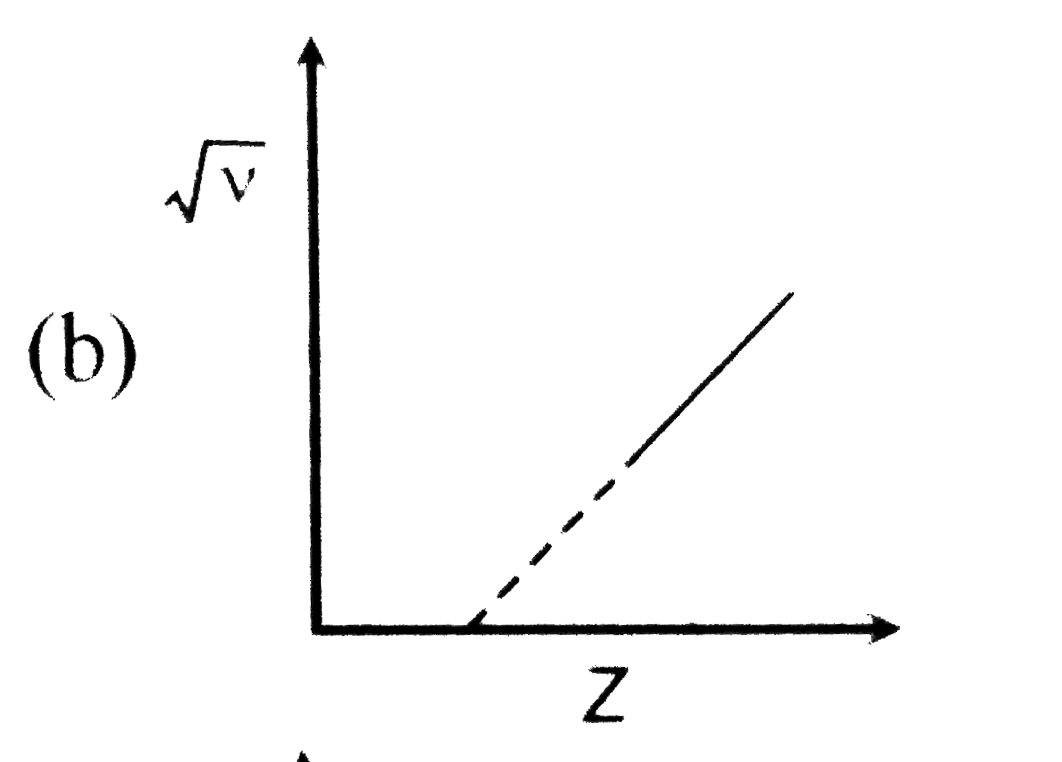 C
C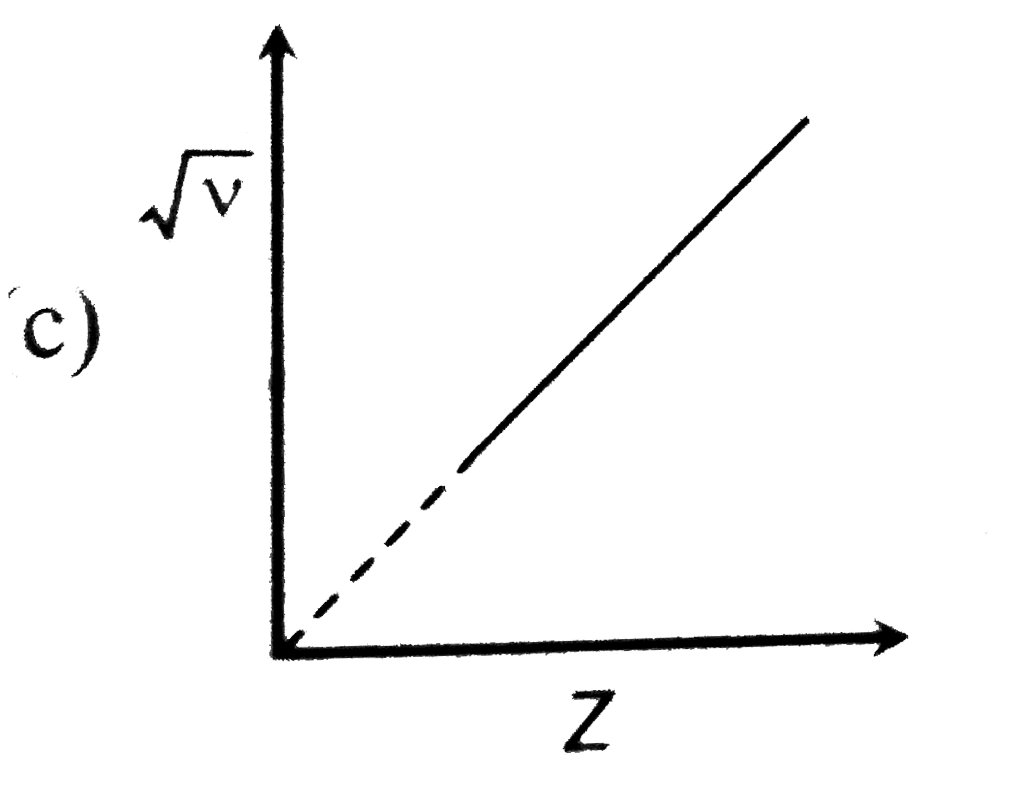 D
D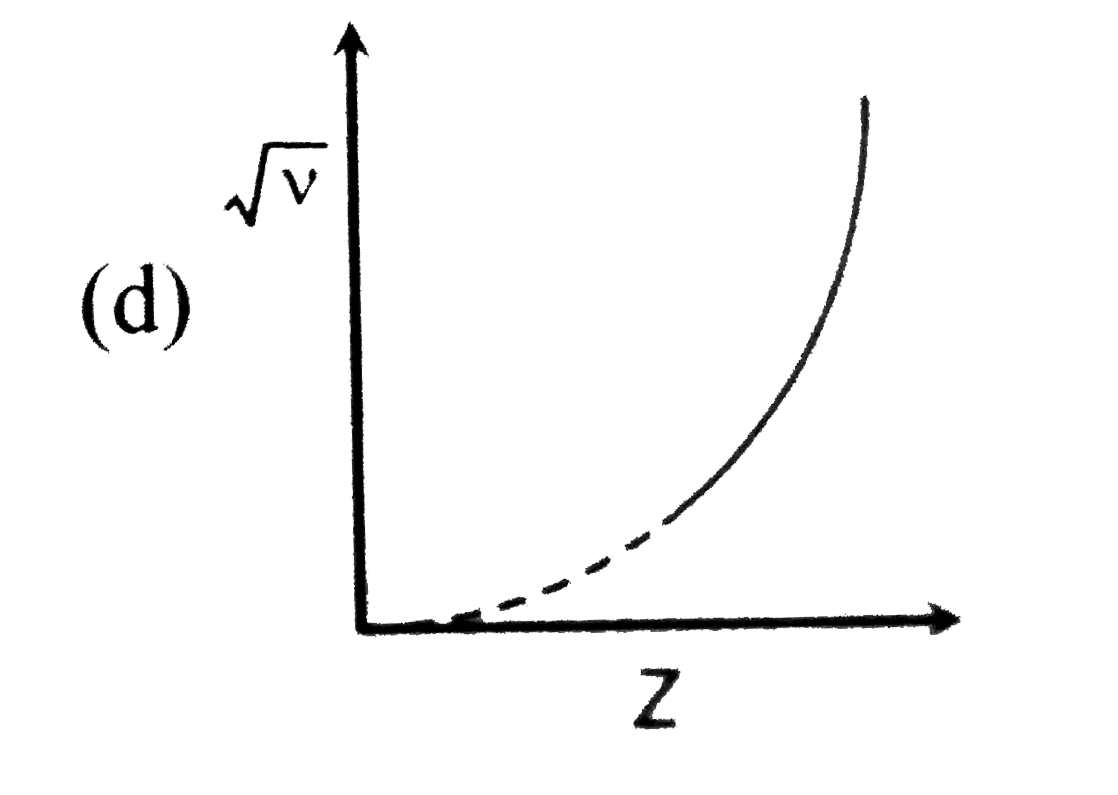
Of the following the graph that better represents the variation of frequency 'v' of a vibrating string with the square root of tension √T is
View SolutionThe characteristic of the target element that determines the frequency of characteristic X-rays, is
View SolutionThe graph that represents the relation between orbital velocity (v0) of a satellite and radius (r) of the orbit around earth is
View SolutionThe wavelength λ of the Ka line of characteristic X - ray spectra varies with atomic number approximately
View SolutionWhich of the following correctly represents the 1-V characteristic of a solar cell ?
View Solution
