The heating cuve of particular substance in solid state is as shown in the figure : Choose the correct aternativ e
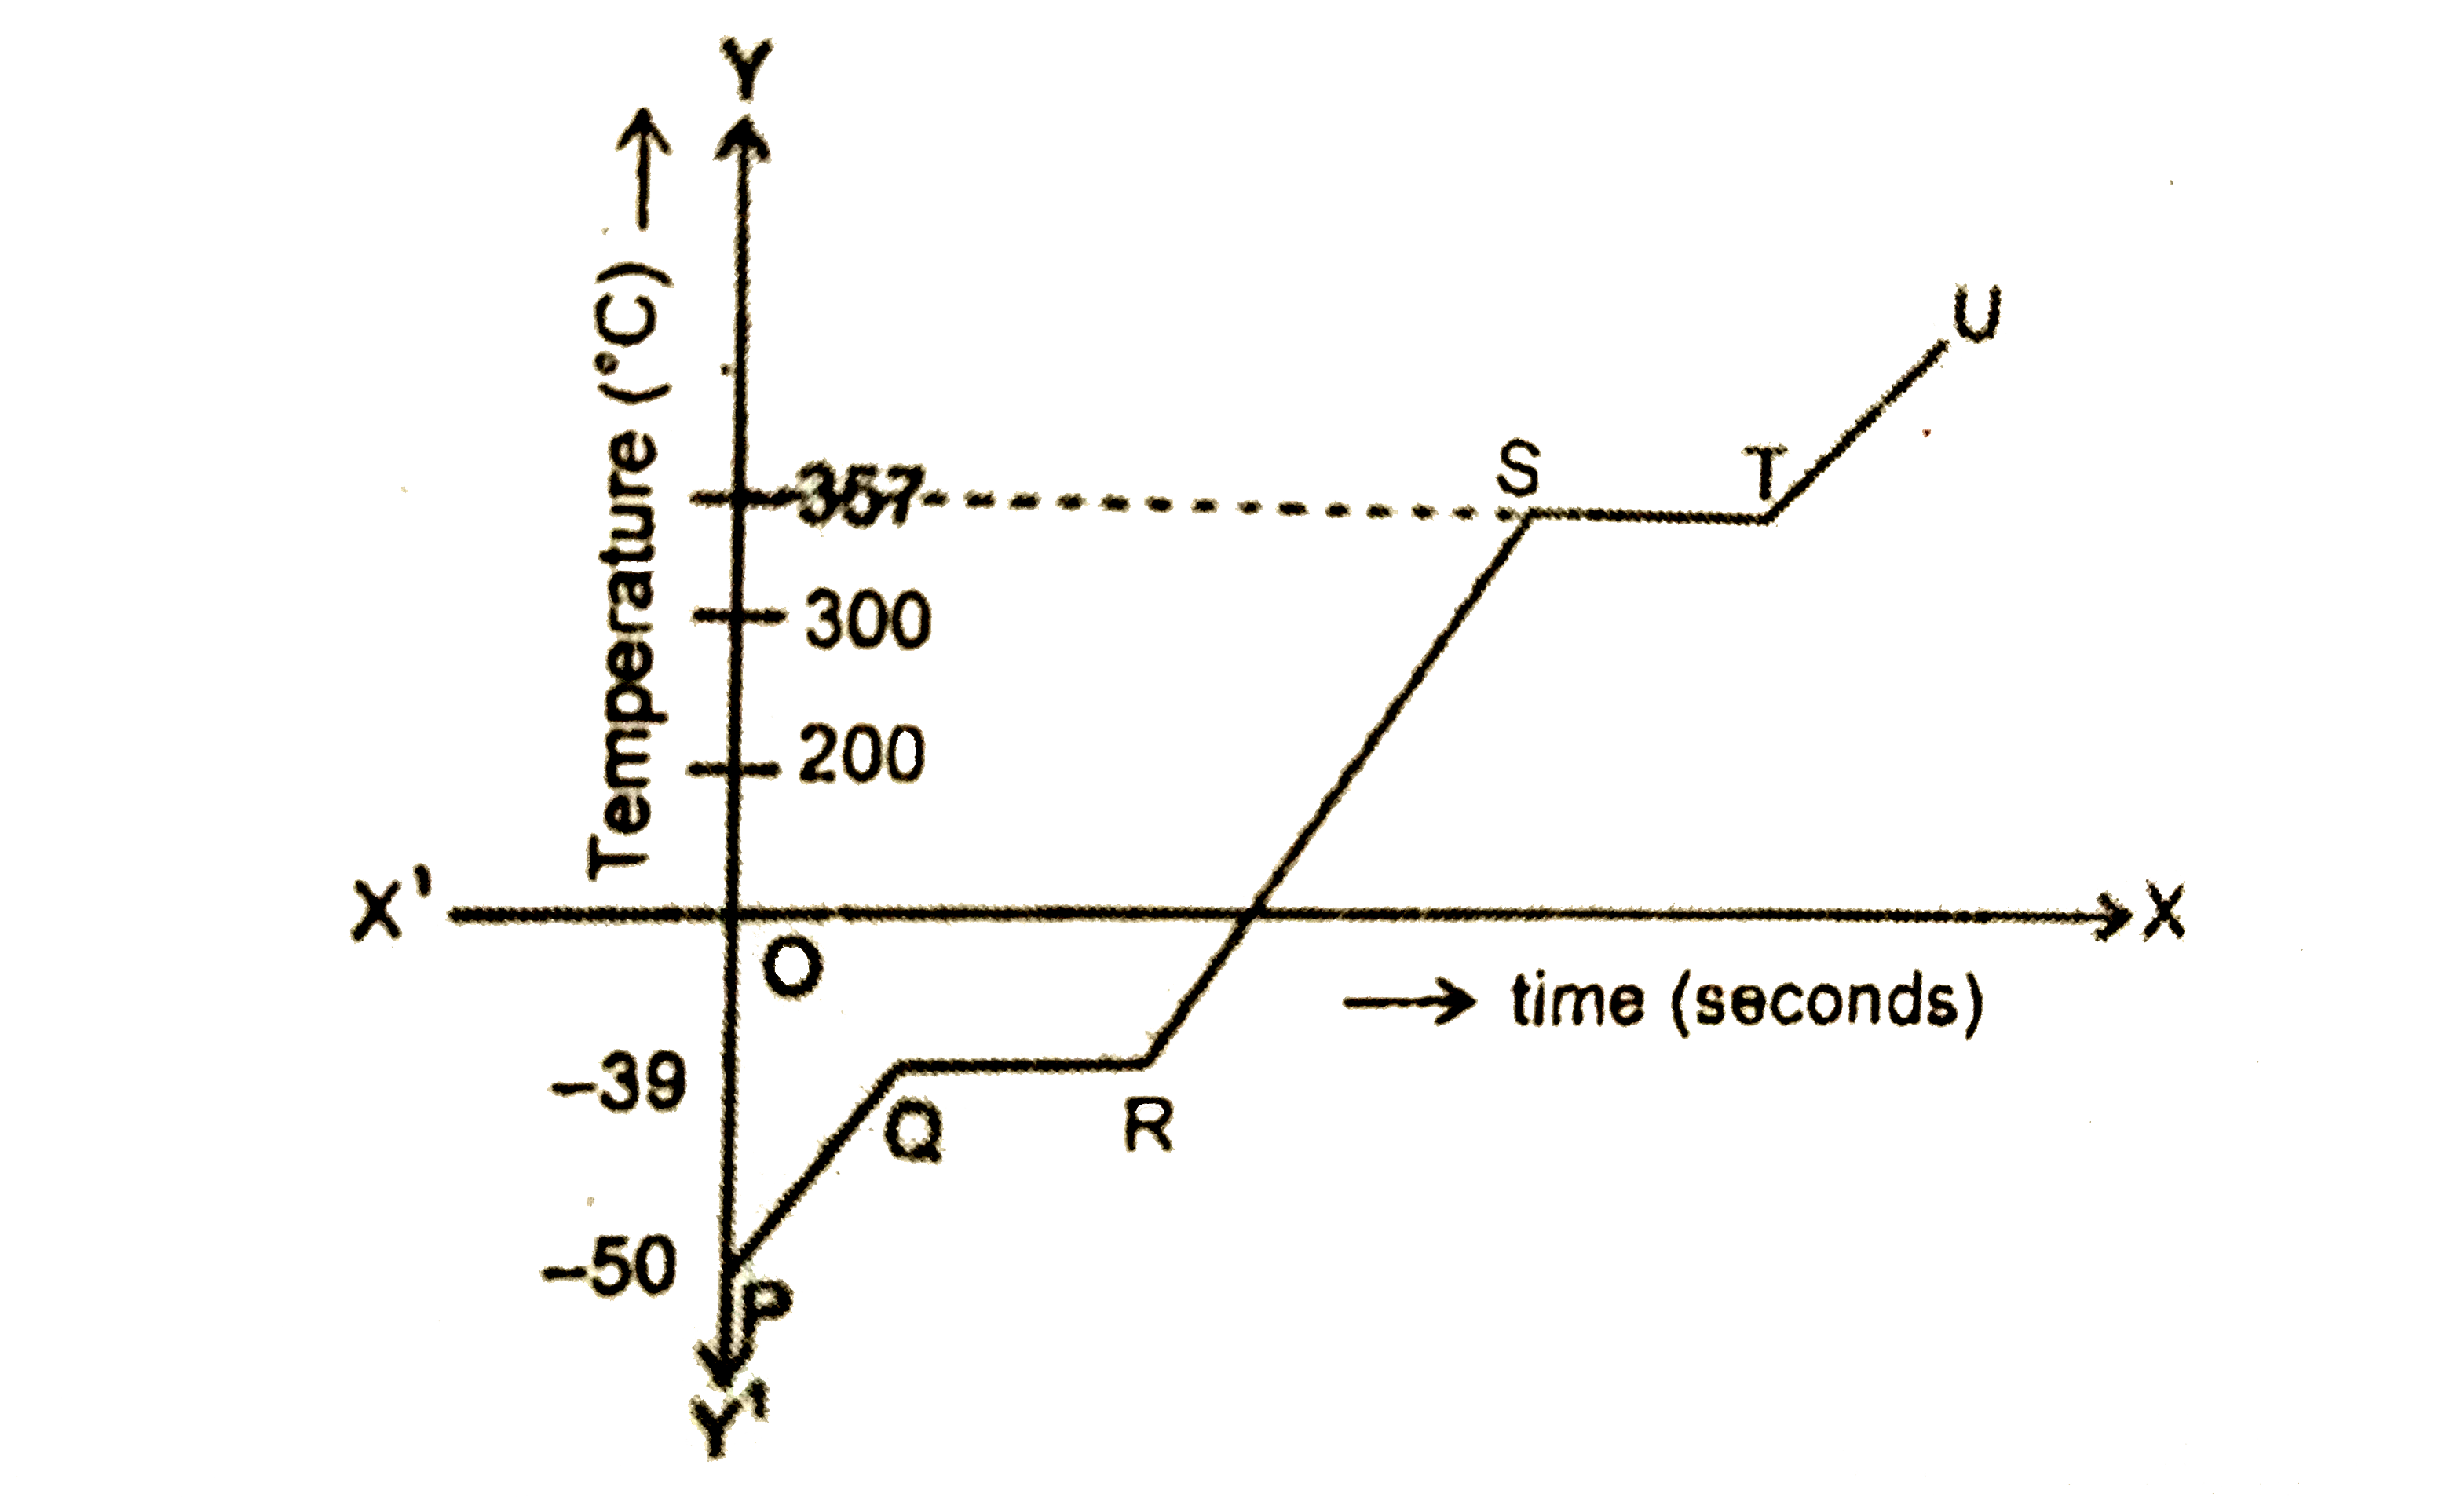 The boiling point of the substance is _________C∘
−39
300
357
cannot be determined
The correct Answer is:c
From the grap the substacne which is in liquid state at 357∘C convert in to gaseous state at the same temperature which is represented by ST in the graph
Topper's Solved these Questions
- BOOK - PEARSON IIT JEE FOUNDATIONCHAPTER - HEAT EXERCISE - Level 219videos
HEAT
- BOOK - PEARSON IIT JEE FOUNDATIONCHAPTER - HEAT EXERCISE - Level 37videos
HEAT
- BOOK - PEARSON IIT JEE FOUNDATIONCHAPTER - HEAT EXERCISE - Short Answer Type Question1videos
HEAT
- BOOK - PEARSON IIT JEE FOUNDATIONCHAPTER - ElectricityEXERCISE - ASSESSMENT TEST (TEST-2)15videos
Electricity
- BOOK - PEARSON IIT JEE FOUNDATIONCHAPTER - KINEMATICSEXERCISE - ASSESSMENT TEST (TEST 2 (SELECT THE CORRECT ALTERNATIVE)15videos
KINEMATICS
Similar Questions
The heating curve of a paritcular substance in solid state is as shown in the figure .choose the correct alternative
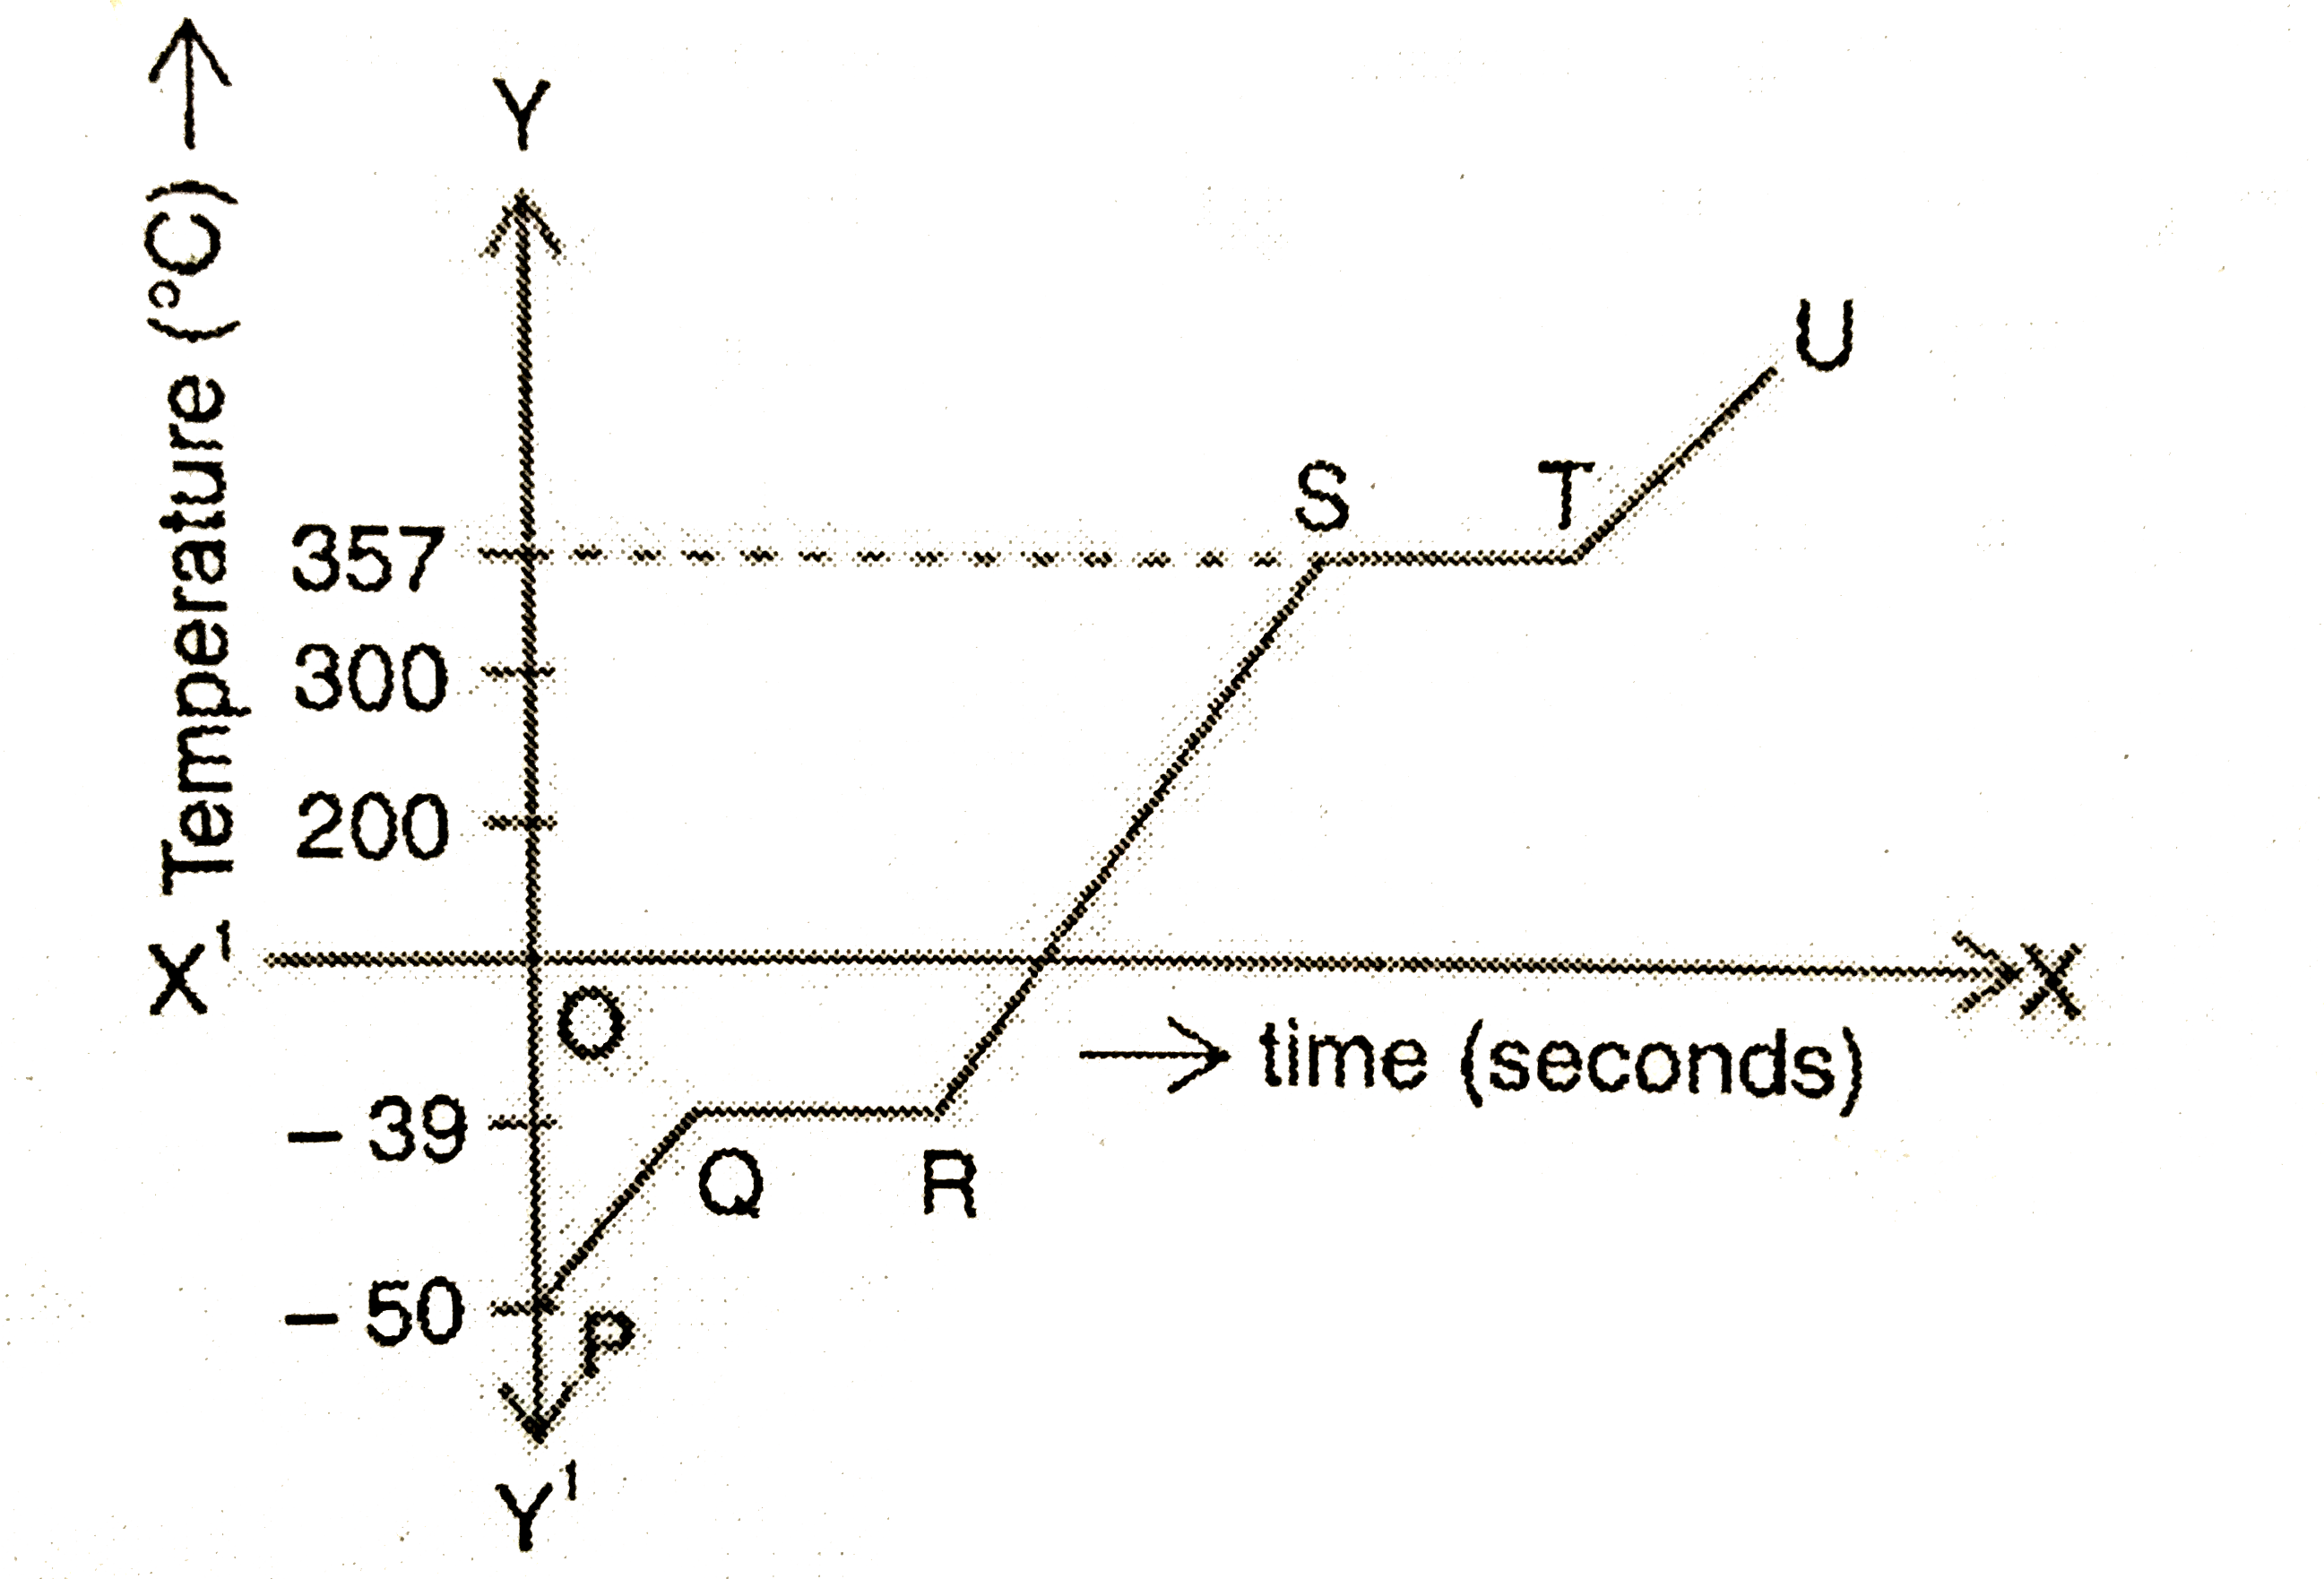
The porition QR of the graph indicatesView SolutionThe heating curve of a paritcular substance in solid state is as shown in the figure .choose the correct alternative

The porition QR of the graph indicatesView Solution
Knowledge Check
- Question 1 - Select One
The heating cuve of particular substance in solid state is as shown in the figure : Choose the correct aternativ e
 The boiling point of the substance is _________C∘A−39B300C357DCannot be determined
 - Question 2 - Select One
The heating cuve of particular substance in solid state is as shown in the figure : Choose the correct aternativ e
 The boiling point of the substance is _________C∘A−39B300C357DCannot be determined
 - Question 3 - Select One
The heating curve of a paritcular substance in solid state is as shown in the figure .choose the correct alternative

The porition QR of the graph indicatesAno change in heat energy.Bchange in temperature.Cchange of state.DBoth (b) and (c)
The heating curve of a particular substance in solid state is as shown in the figure: Choose the correct alternative.
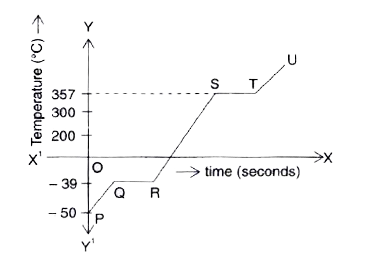
The portion RS of the graph indicates _____ state of substance.View SolutionThe heating curve of a particular substance in solid state is a shown in the figure .choose the correct alternative
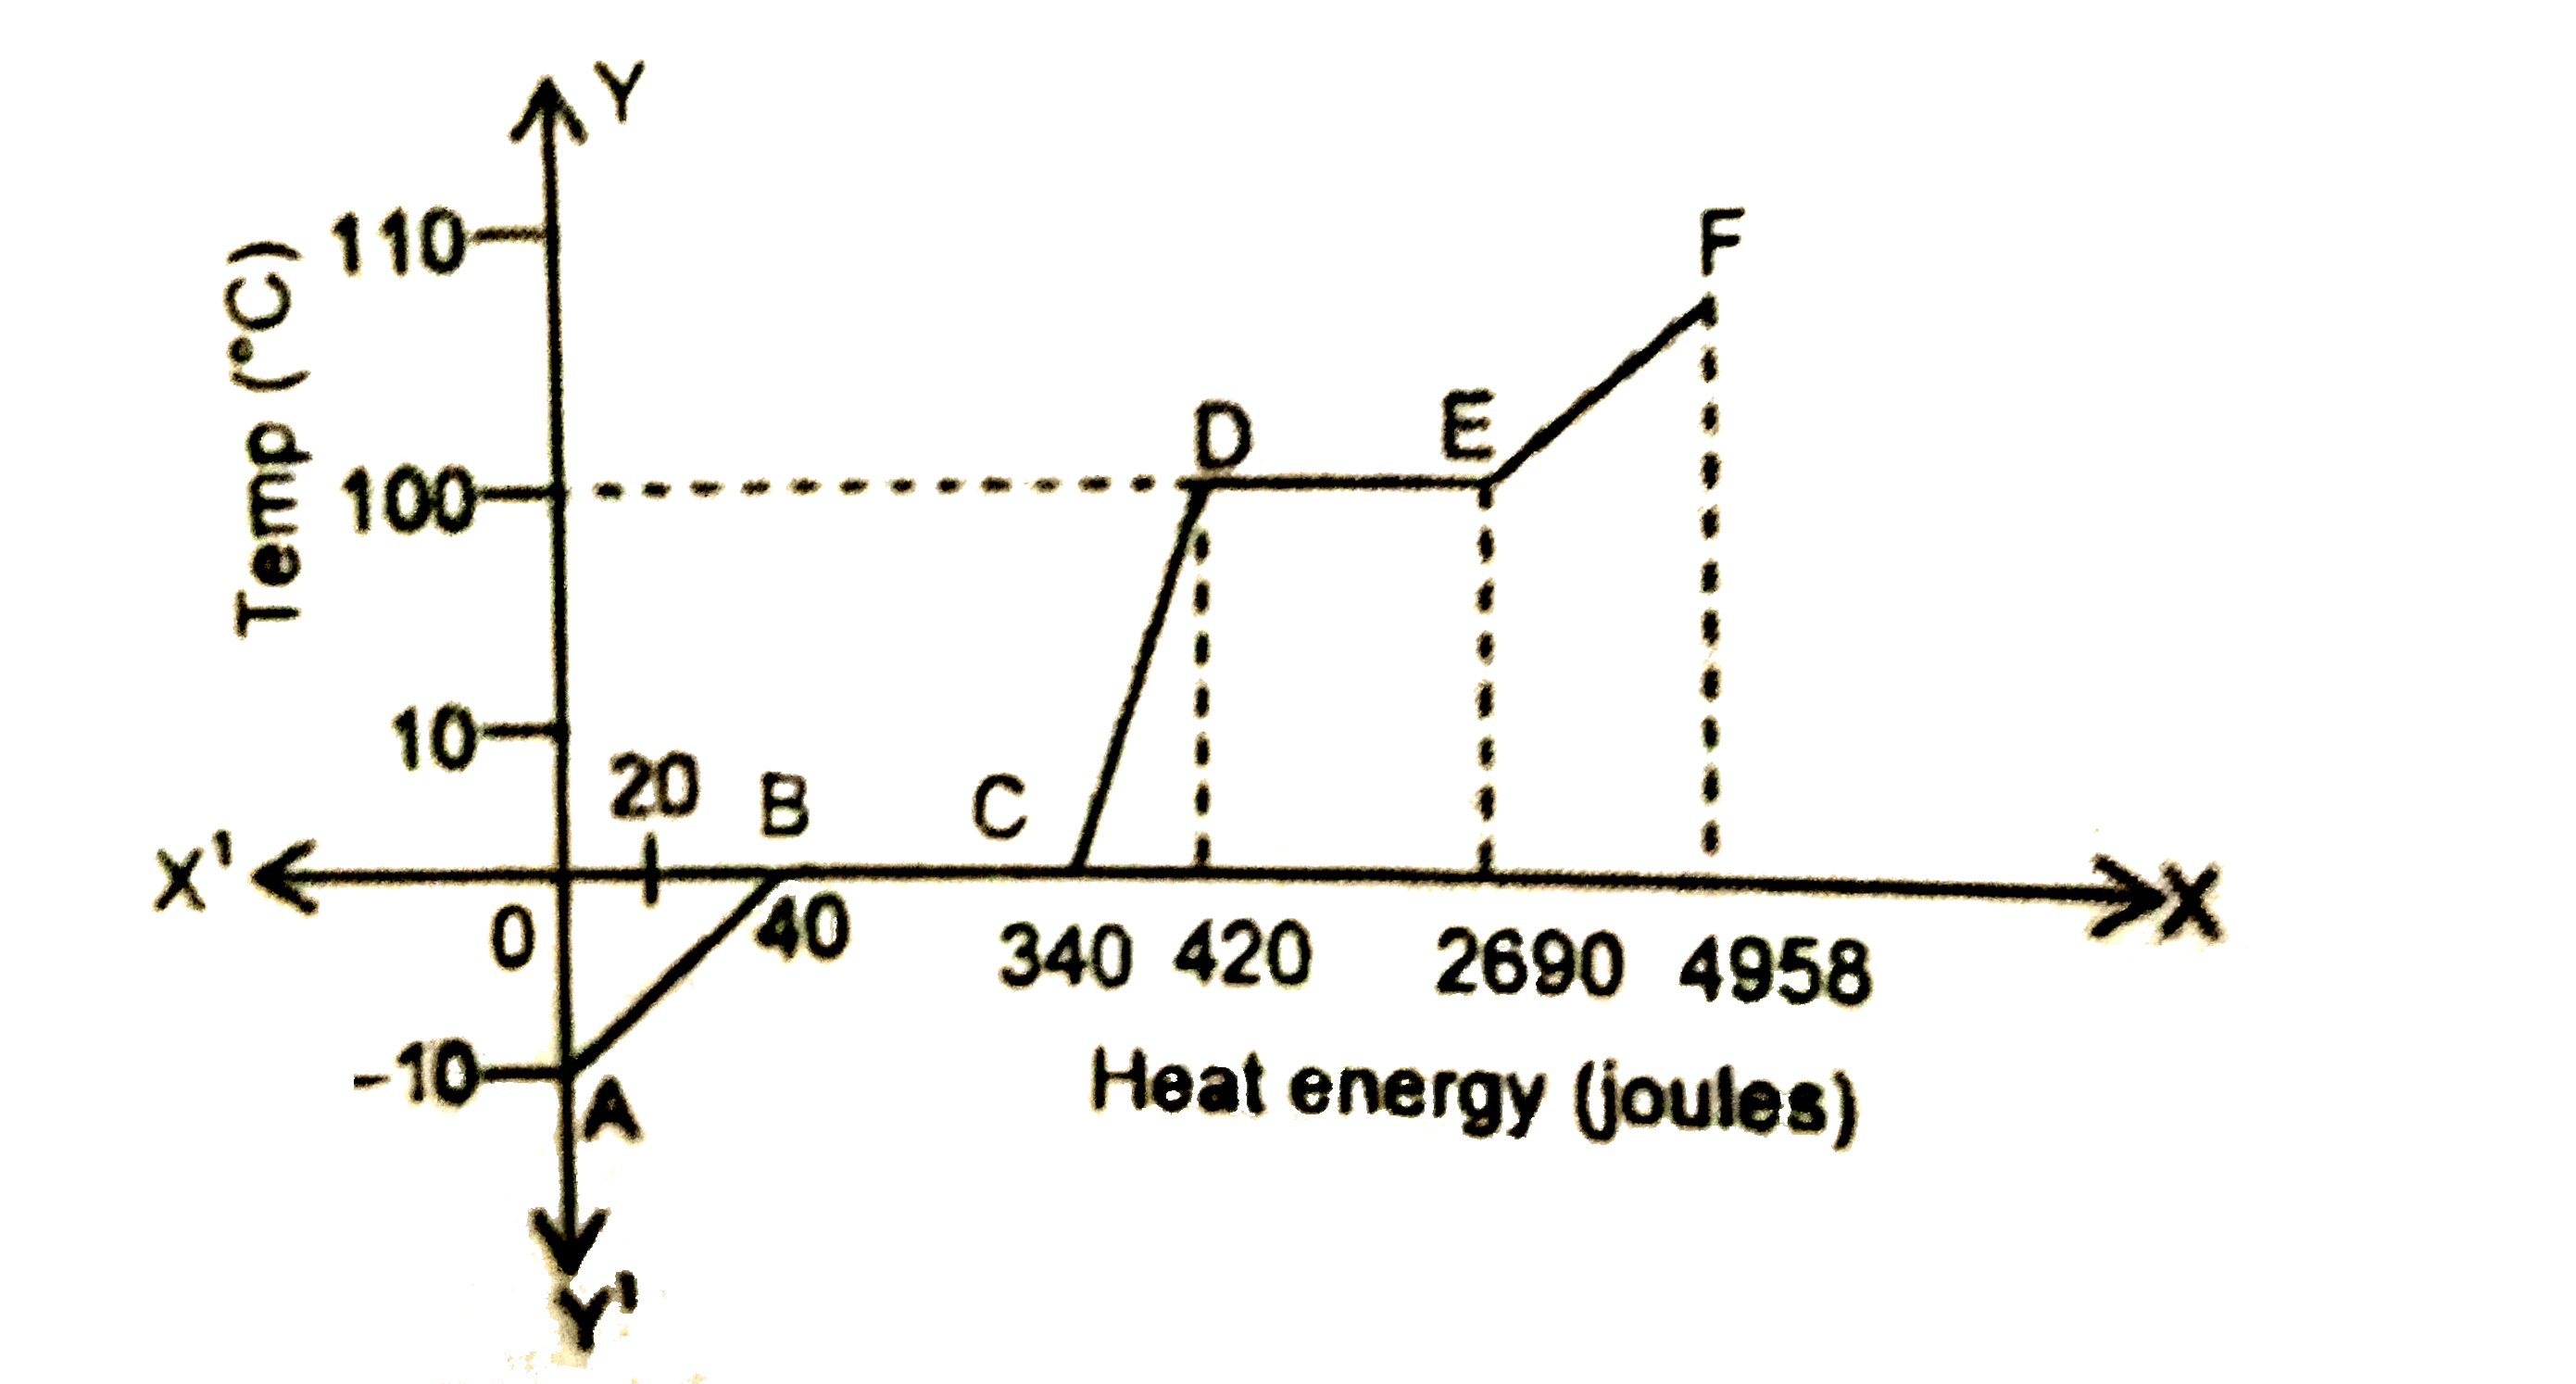
The amount of heat energy absorbed by the substacne to change completely from liquid at its boiling point to gaseous state is _______JView SolutionThe amount of heat energy absorbed by the substance to change completely form liquid at its boiling point to gaseous state is ______J
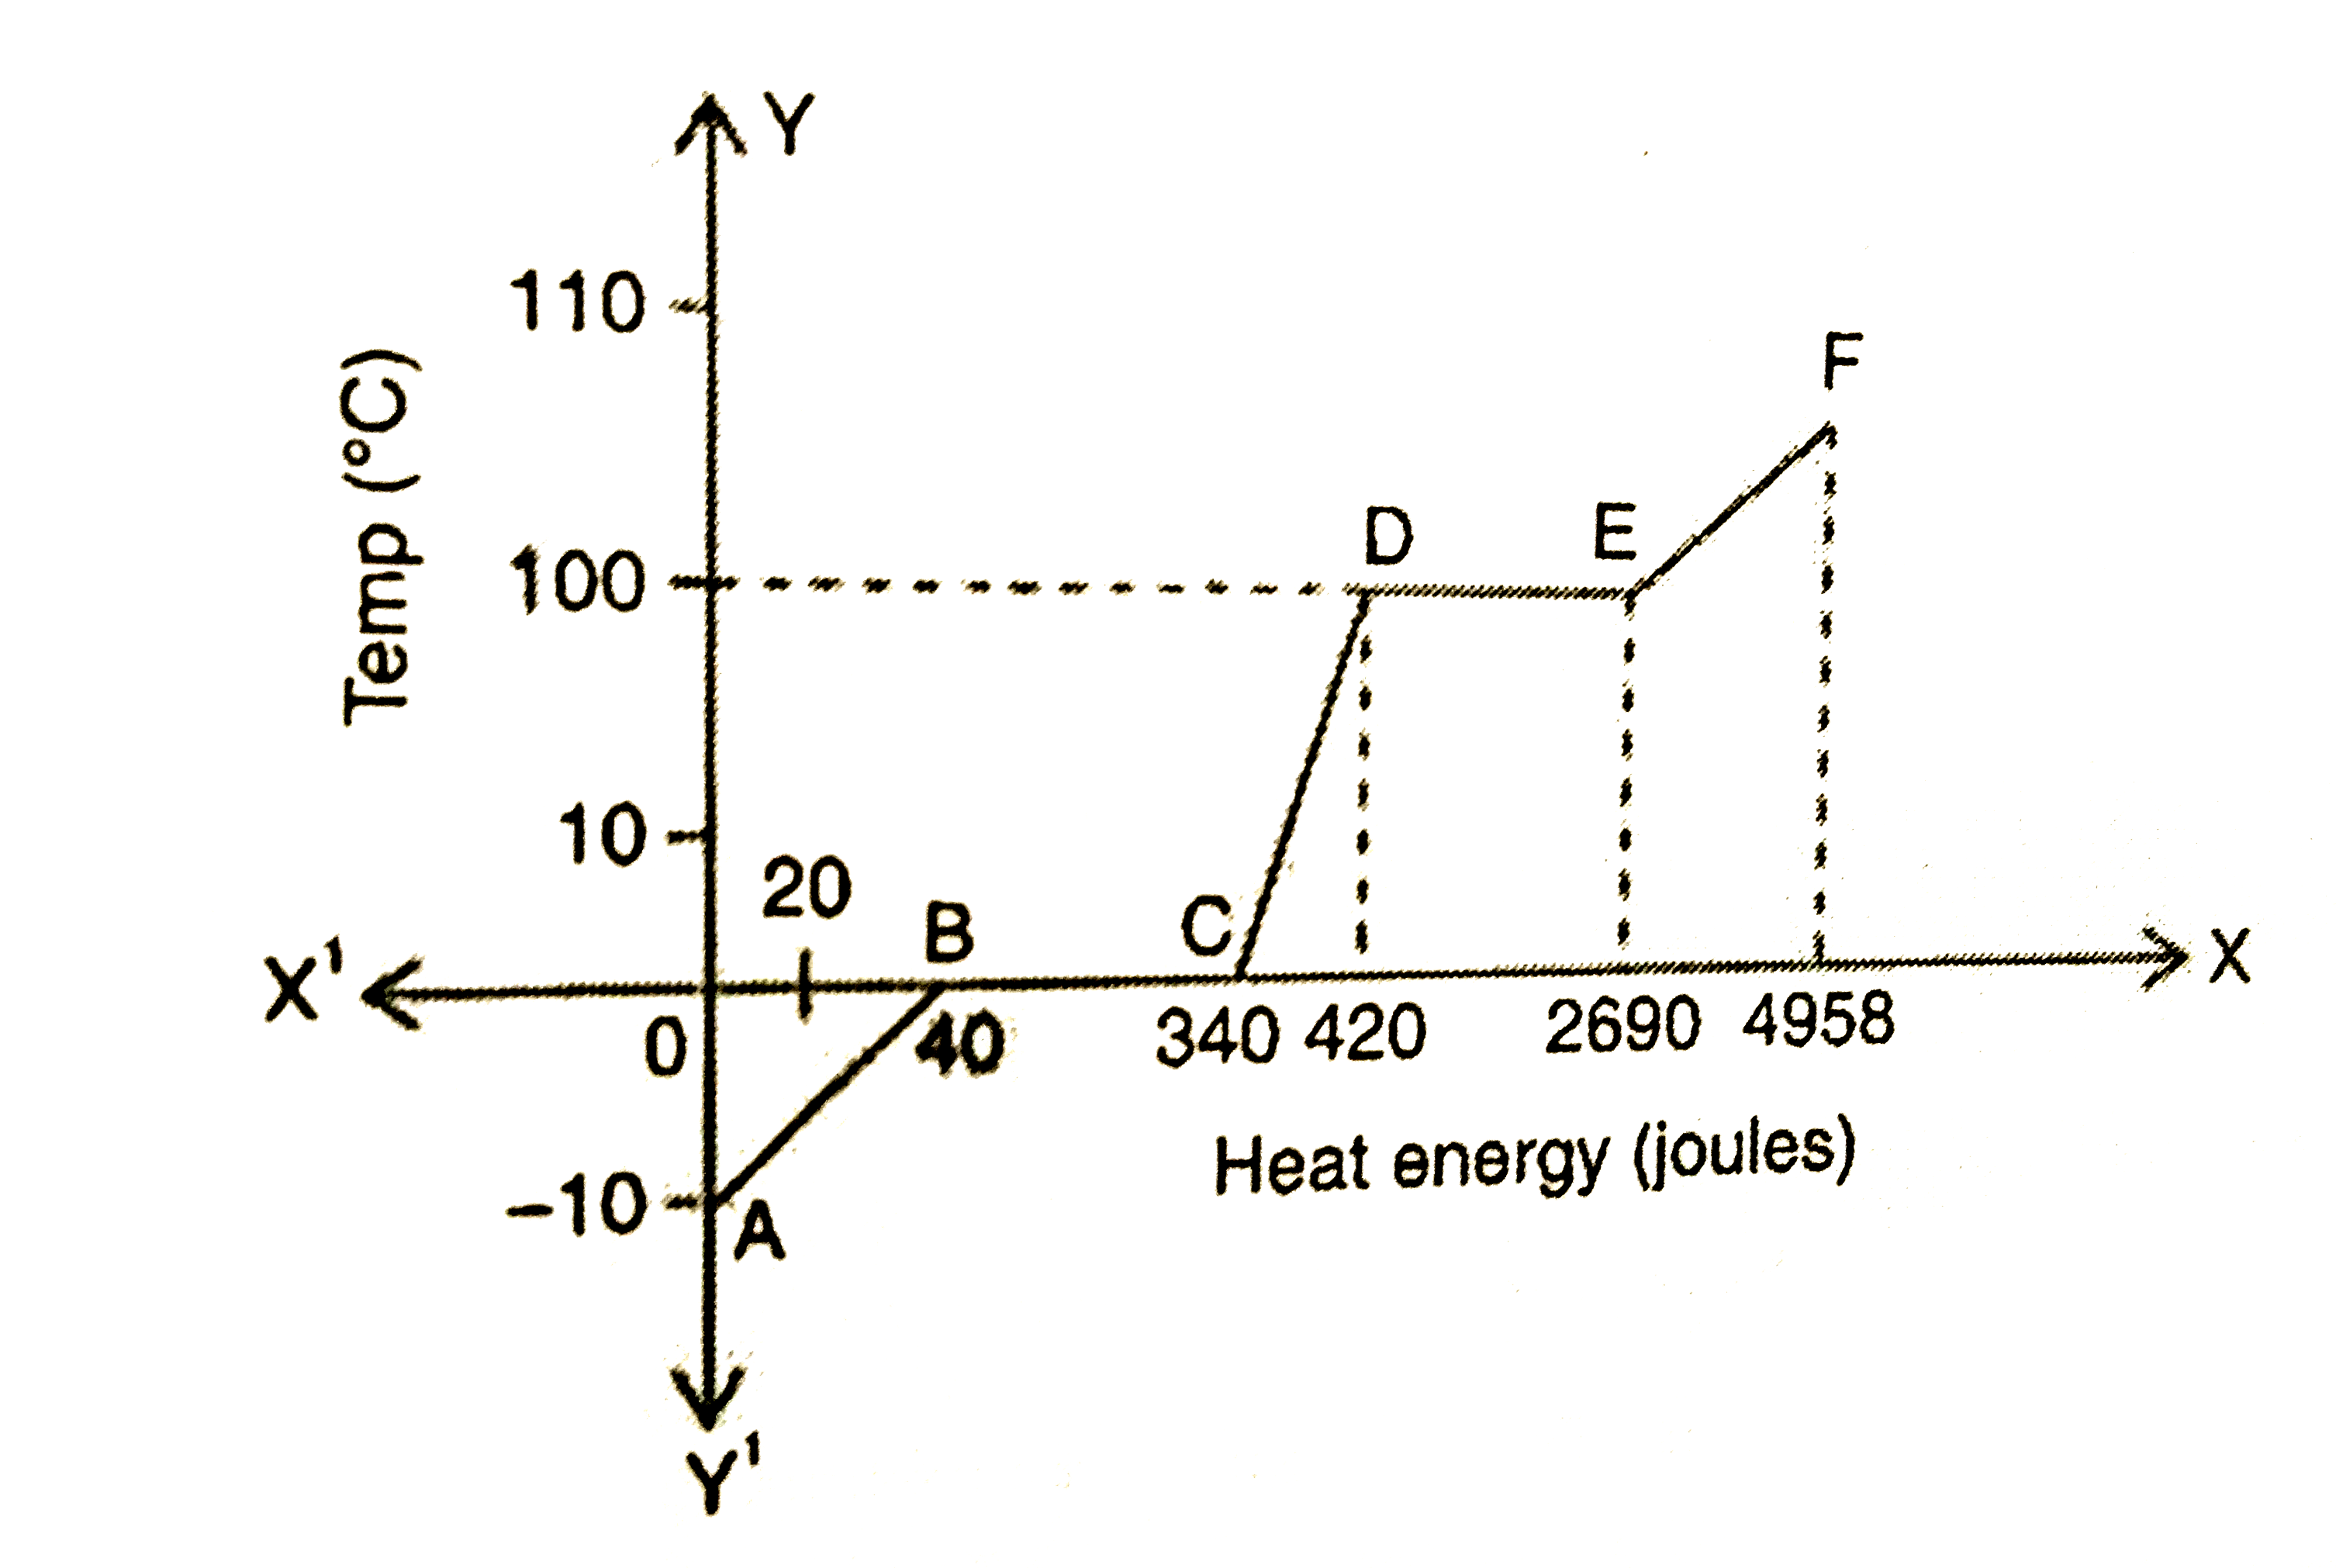 View Solution
The heating curve of a particular substance in solid state is as shown in the figure: Choose the correct alternative.
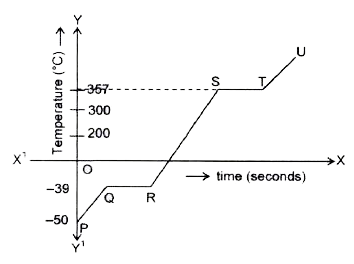
RS part of the graph indicates ___ state of substance.View SolutionThe heating curve of a particular substance in solid state is a shown in the figure .choose the correct alternative

The amount of heat energy absorbed by the substacne to change completely from liquid at its boiling point to gaseous state is _______JView Solution

