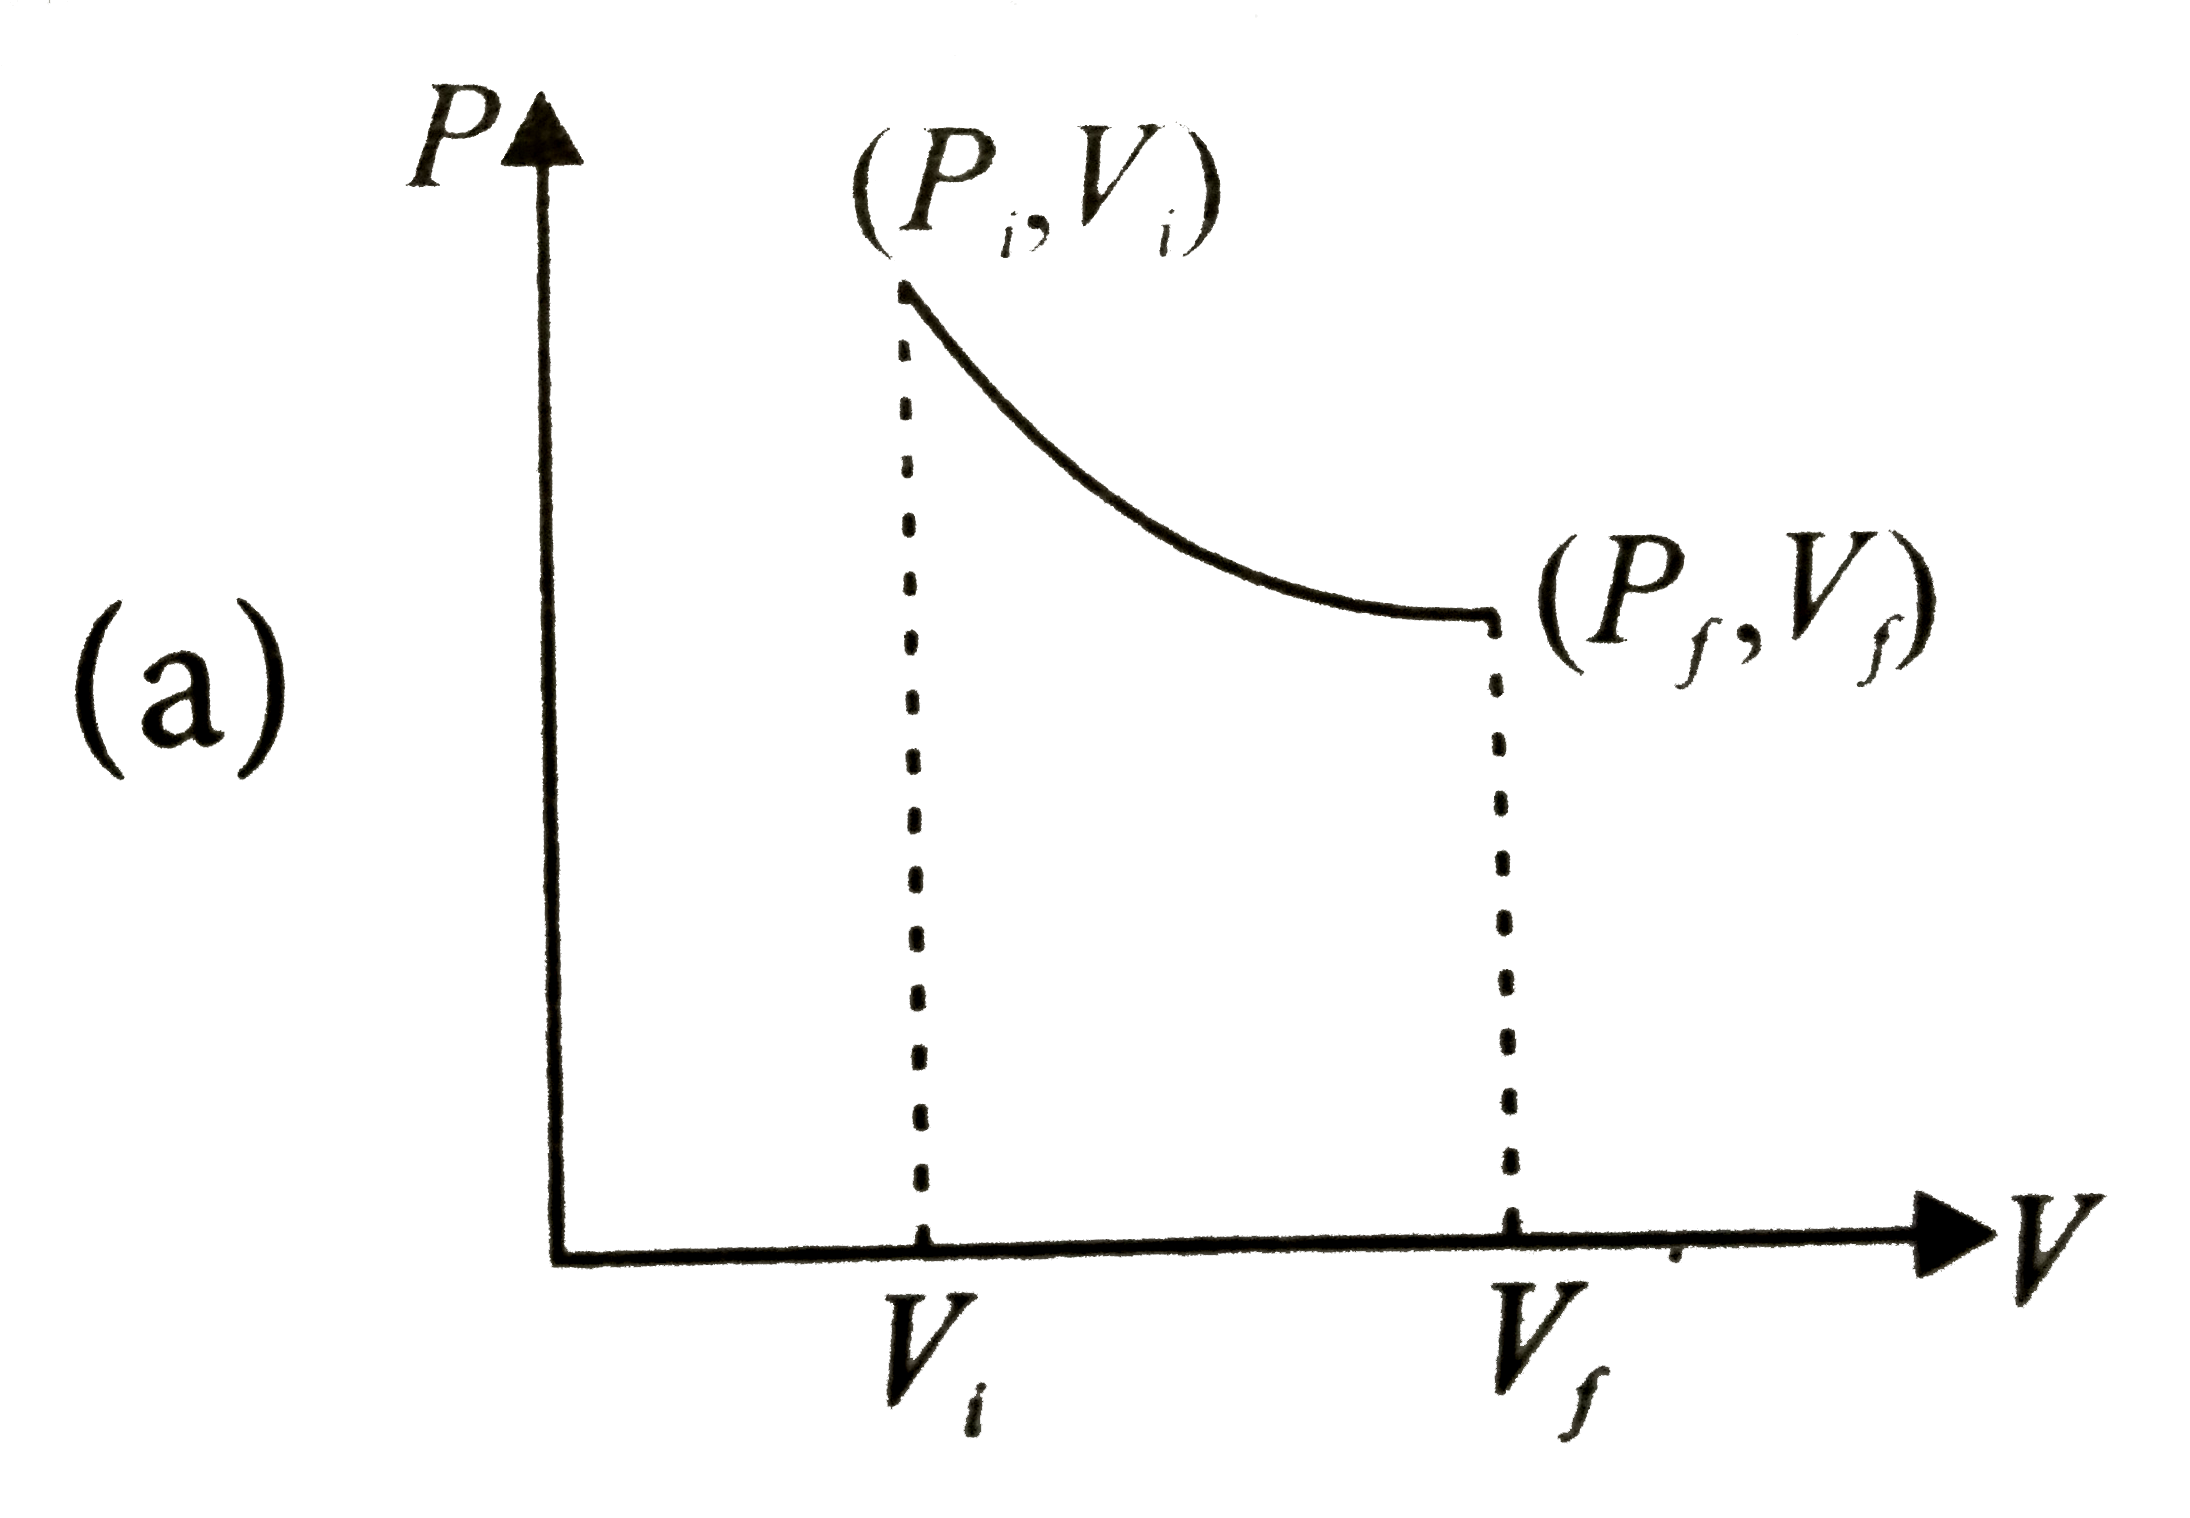
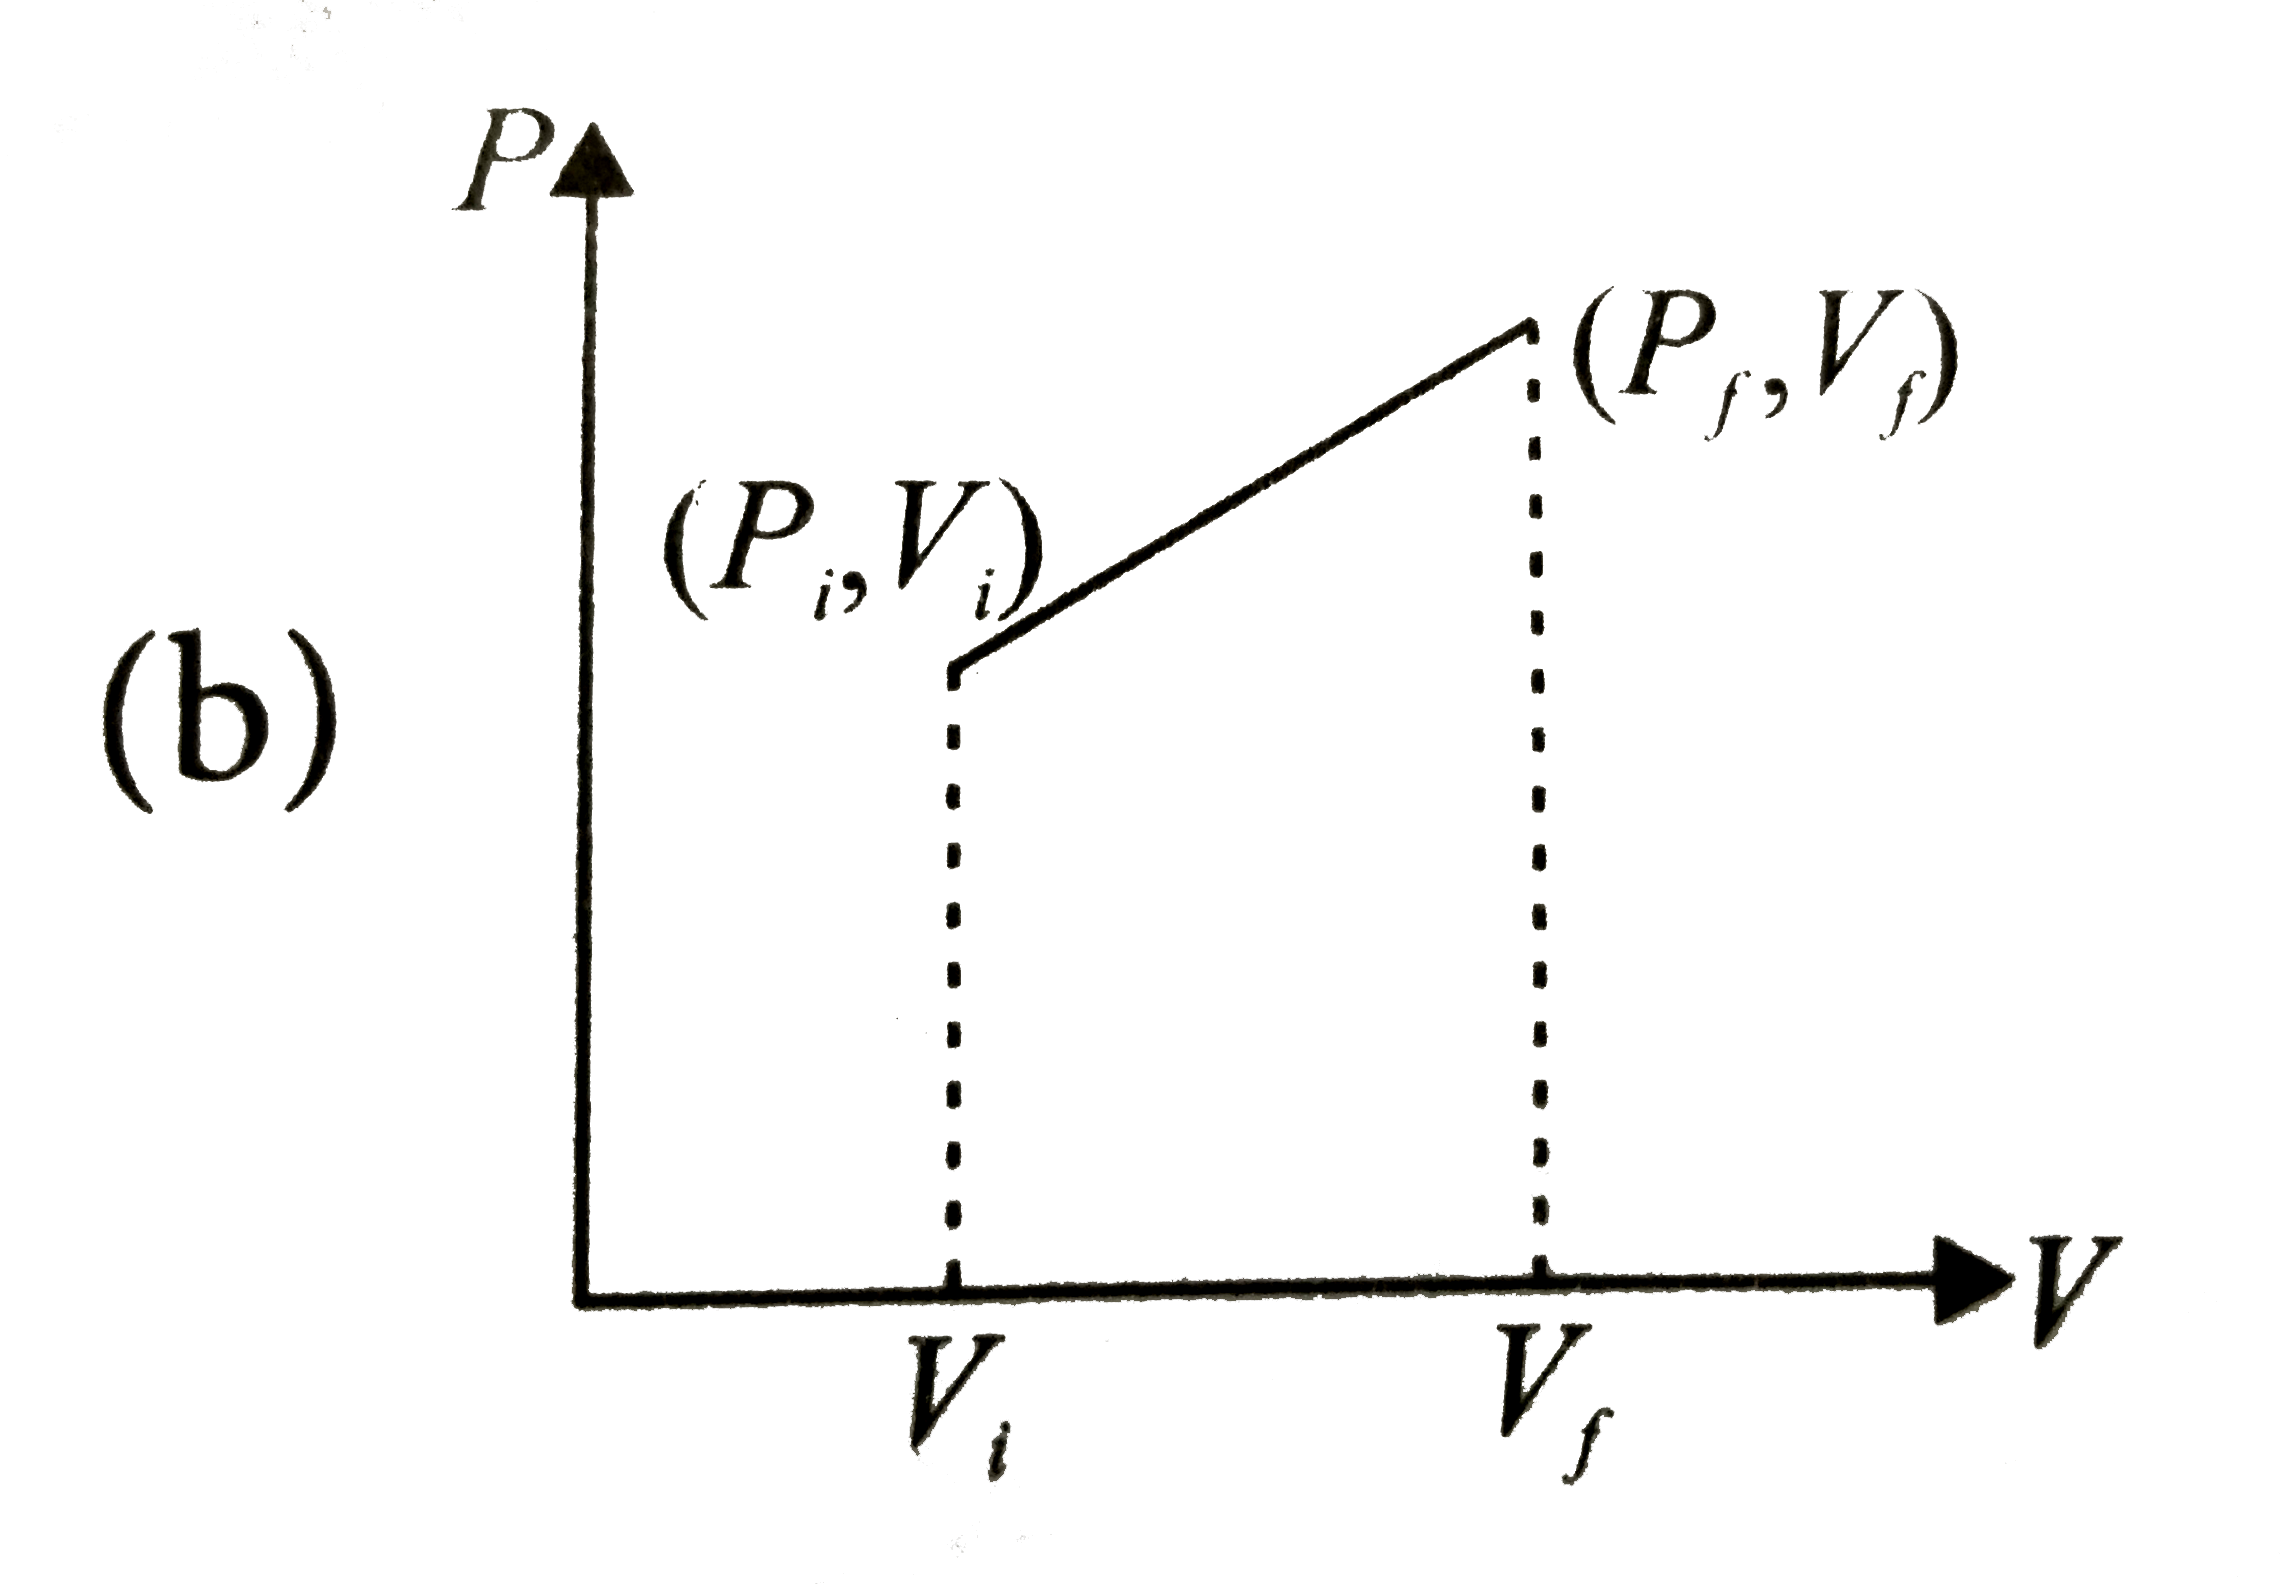
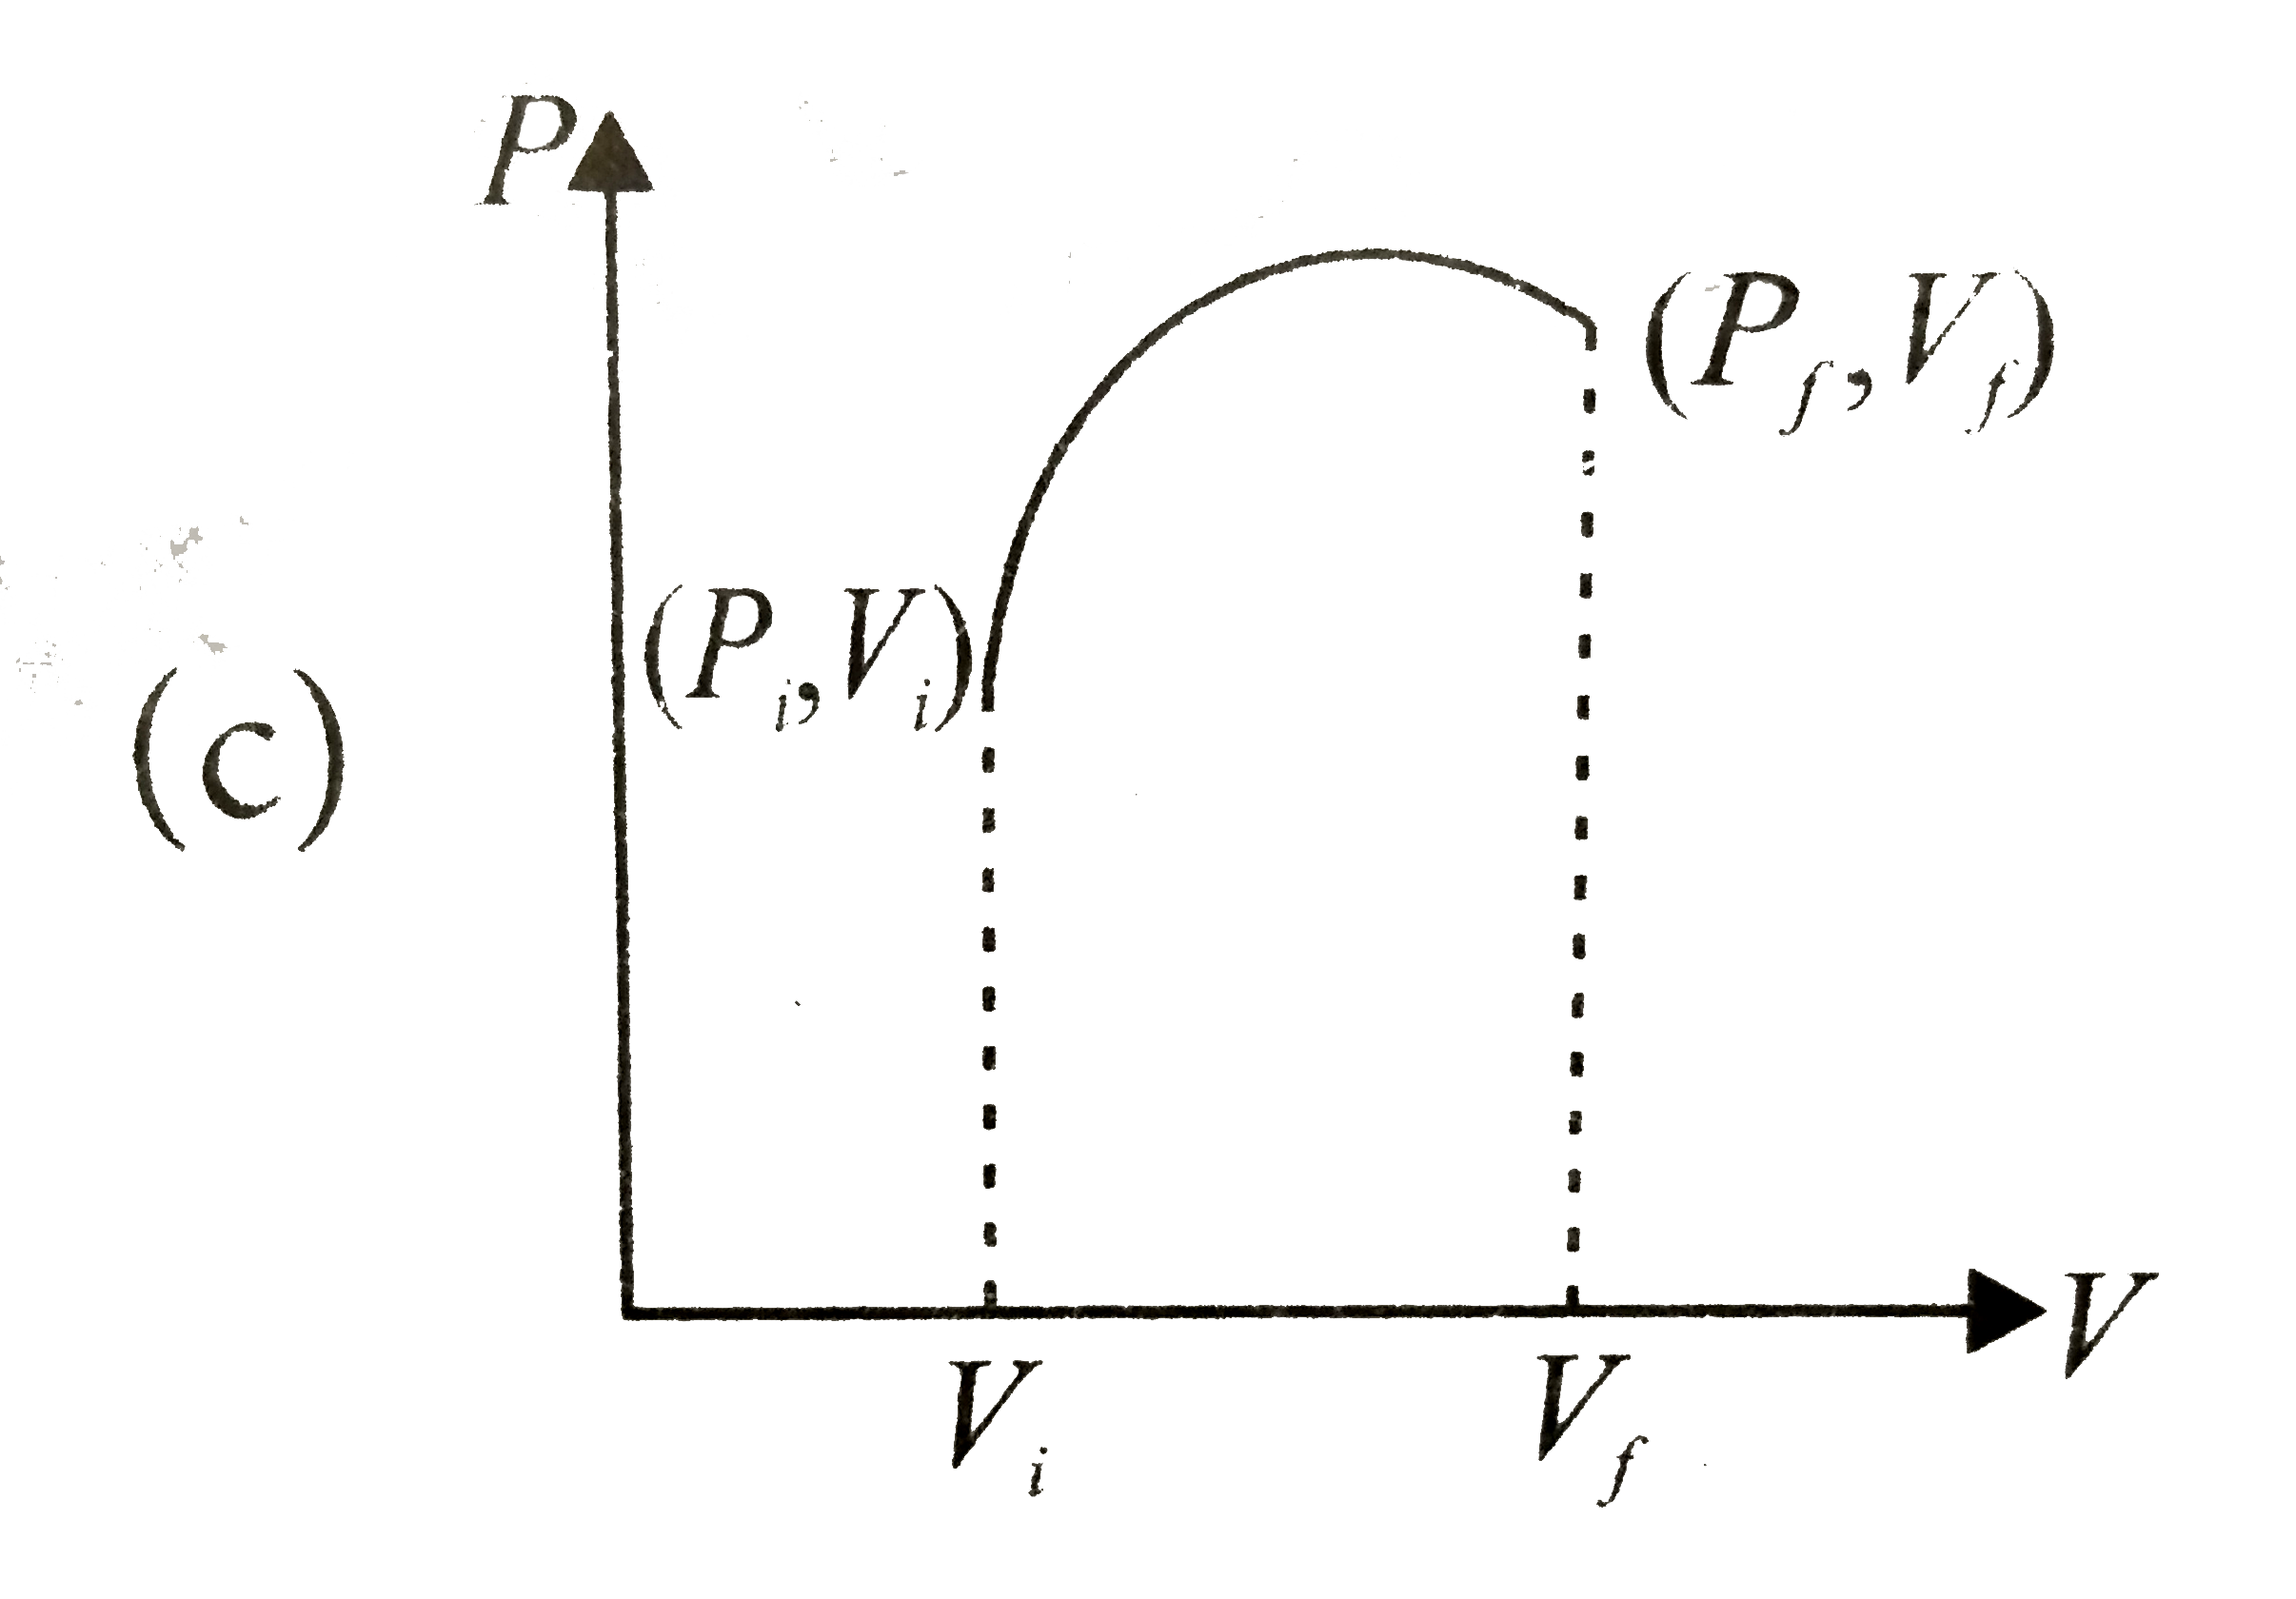
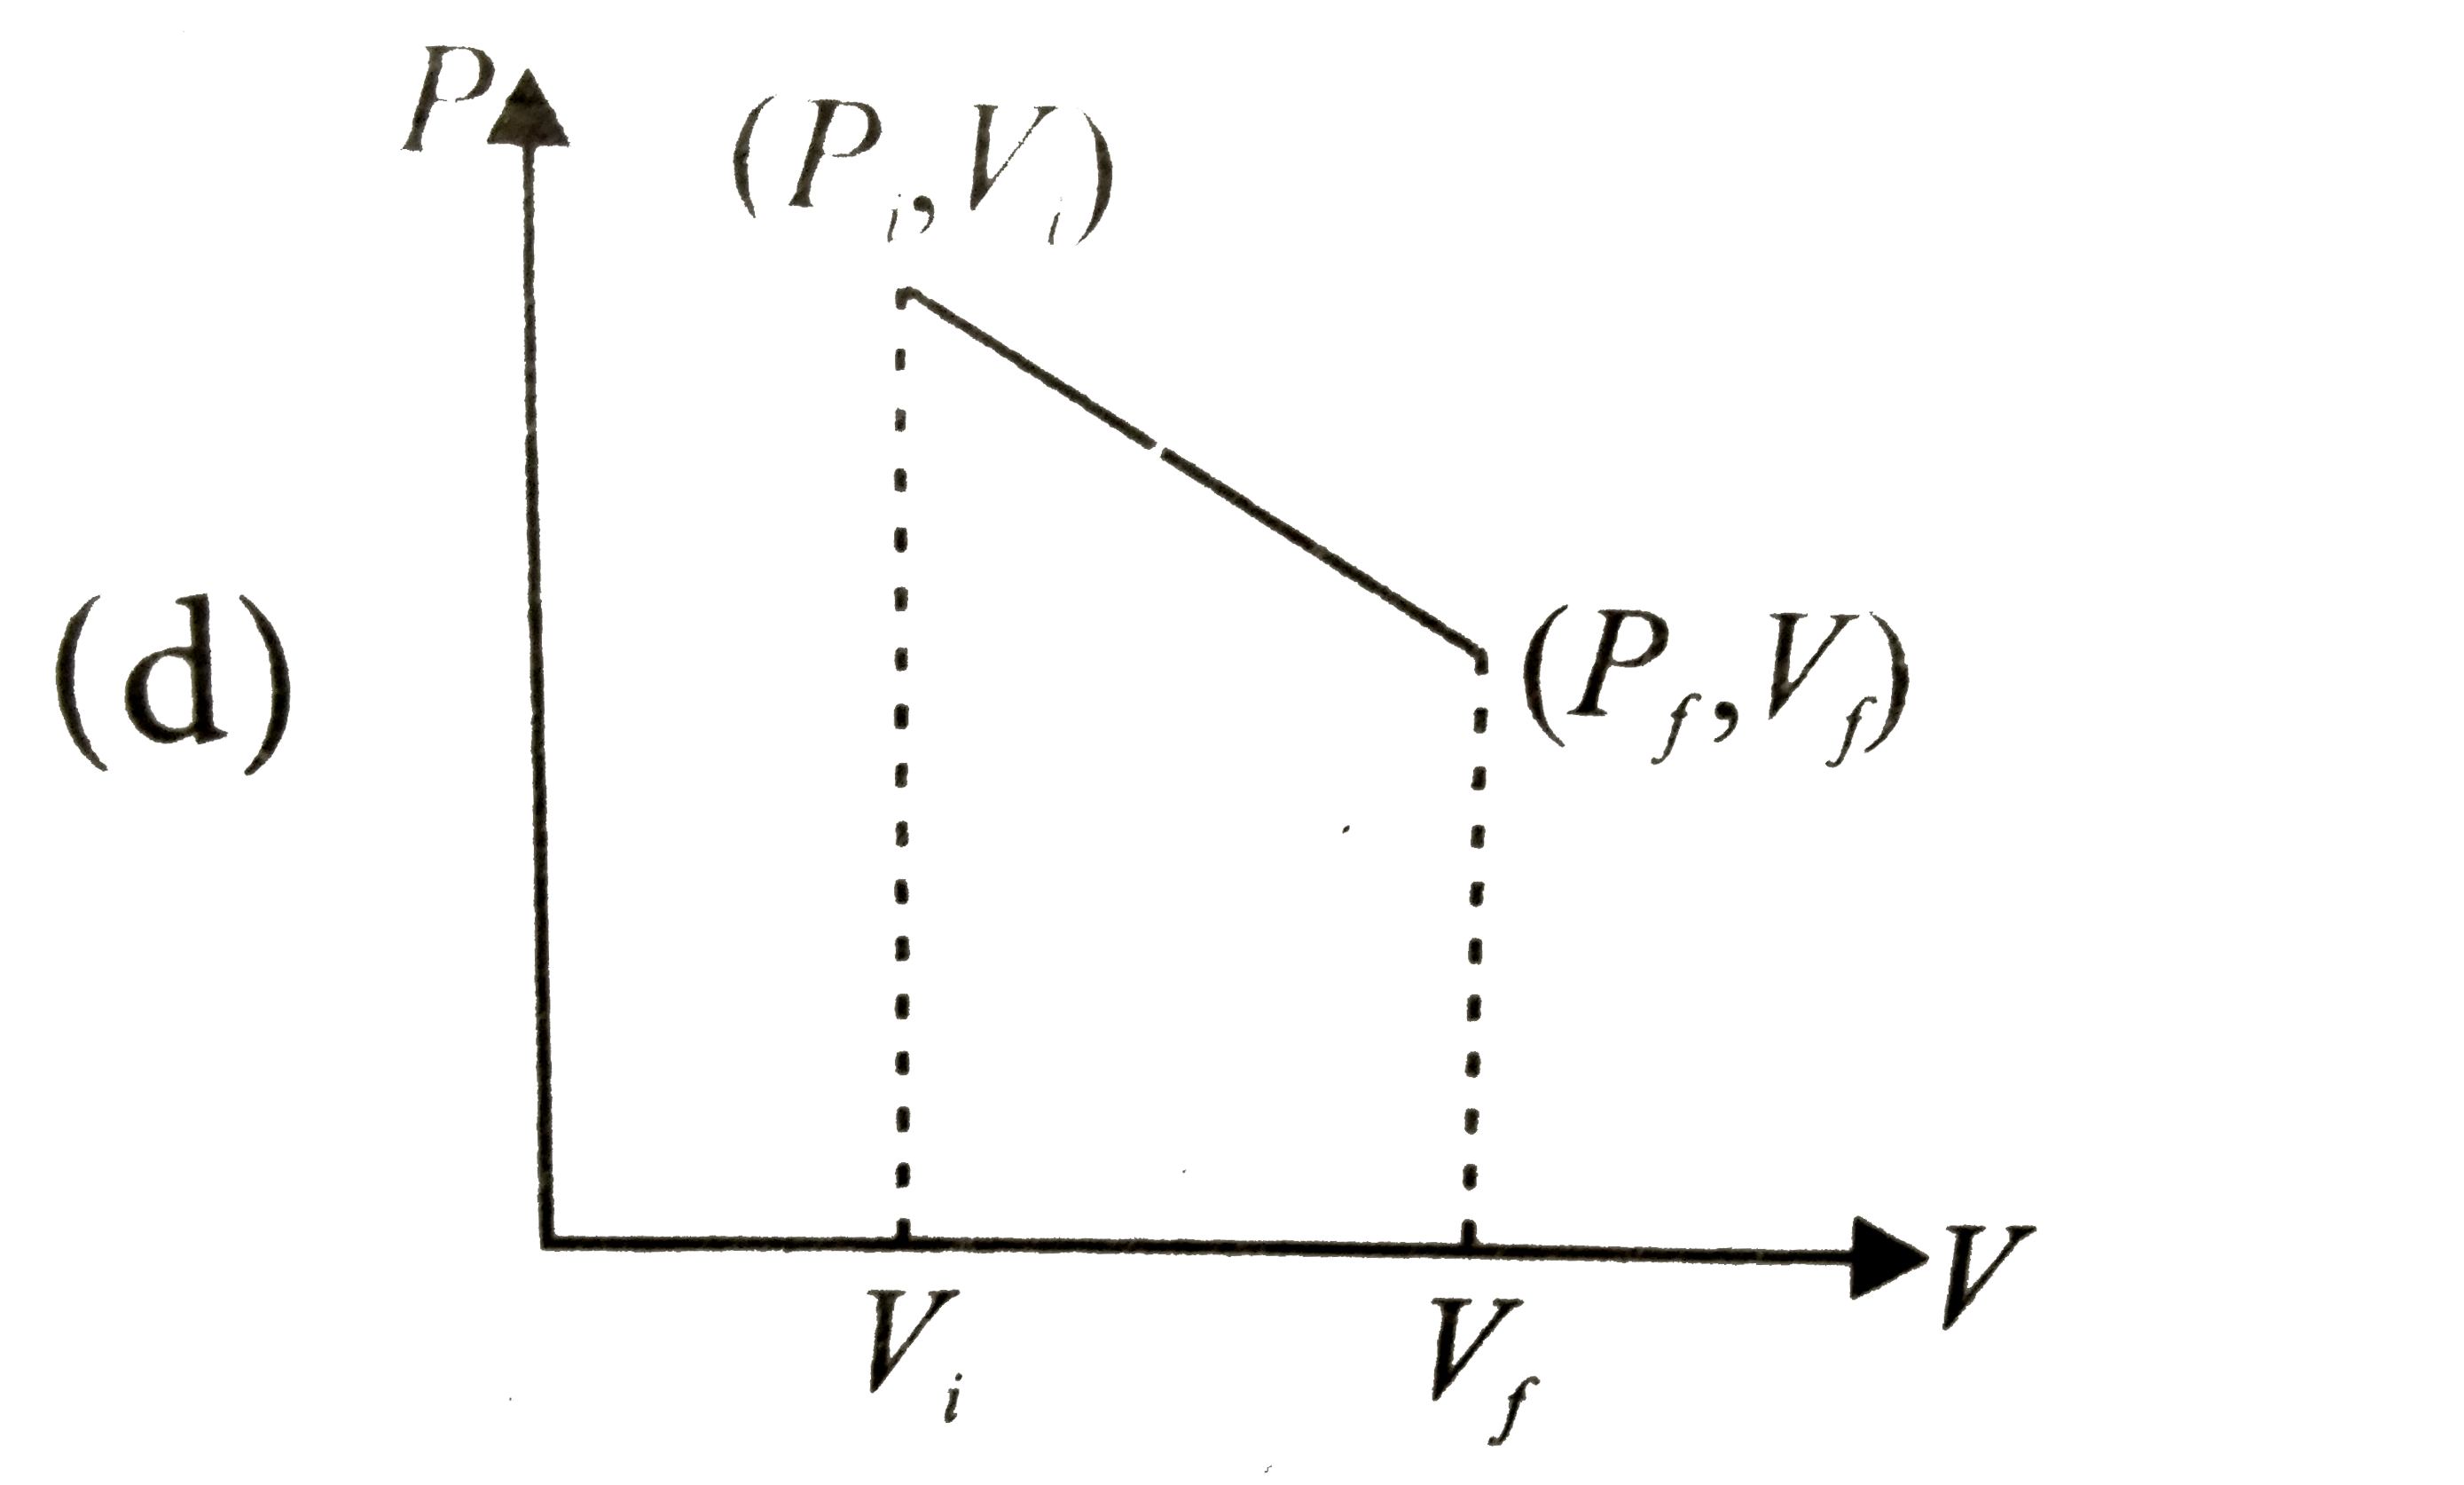
The initial state of certain gas (PiViTi).It undergoes expansion till its volume becomes Vf at constant temperature T. The correct plot of P-V diagram for it is
The correct Answer is:A
As PV =nRT
At constant temperature
PiVi=nRTandPfVf=nRT⇒PiVi=PfVf
In the given P-V diagram (a) at every point on the plot P-V is constant which shows a process at constant temperature i.e isothermal process.
Topper's Solved these Questions
- THERMODYNAMICSBOOK - NCERT FINGERTIPSCHAPTER - THERMODYNAMICSEXERCISE - Heat Engines
4 Videos
- THERMODYNAMICSBOOK - NCERT FINGERTIPSCHAPTER - THERMODYNAMICSEXERCISE - Refrigerators And Heat Pumps
10 Videos
- THERMODYNAMICSBOOK - NCERT FINGERTIPSCHAPTER - THERMODYNAMICSEXERCISE - Thermodynamic State Variables
2 Videos
- THERMAL PROPERTIES OF MATTERBOOK - NCERT FINGERTIPSCHAPTER - THERMAL PROPERTIES OF MATTEREXERCISE - Assertion And Reason
10 Videos
- UNITS AND MEASUREMENTSBOOK - NCERT FINGERTIPSCHAPTER - UNITS AND MEASUREMENTSEXERCISE - Assertion And Reason
15 Videos
Similar Questions
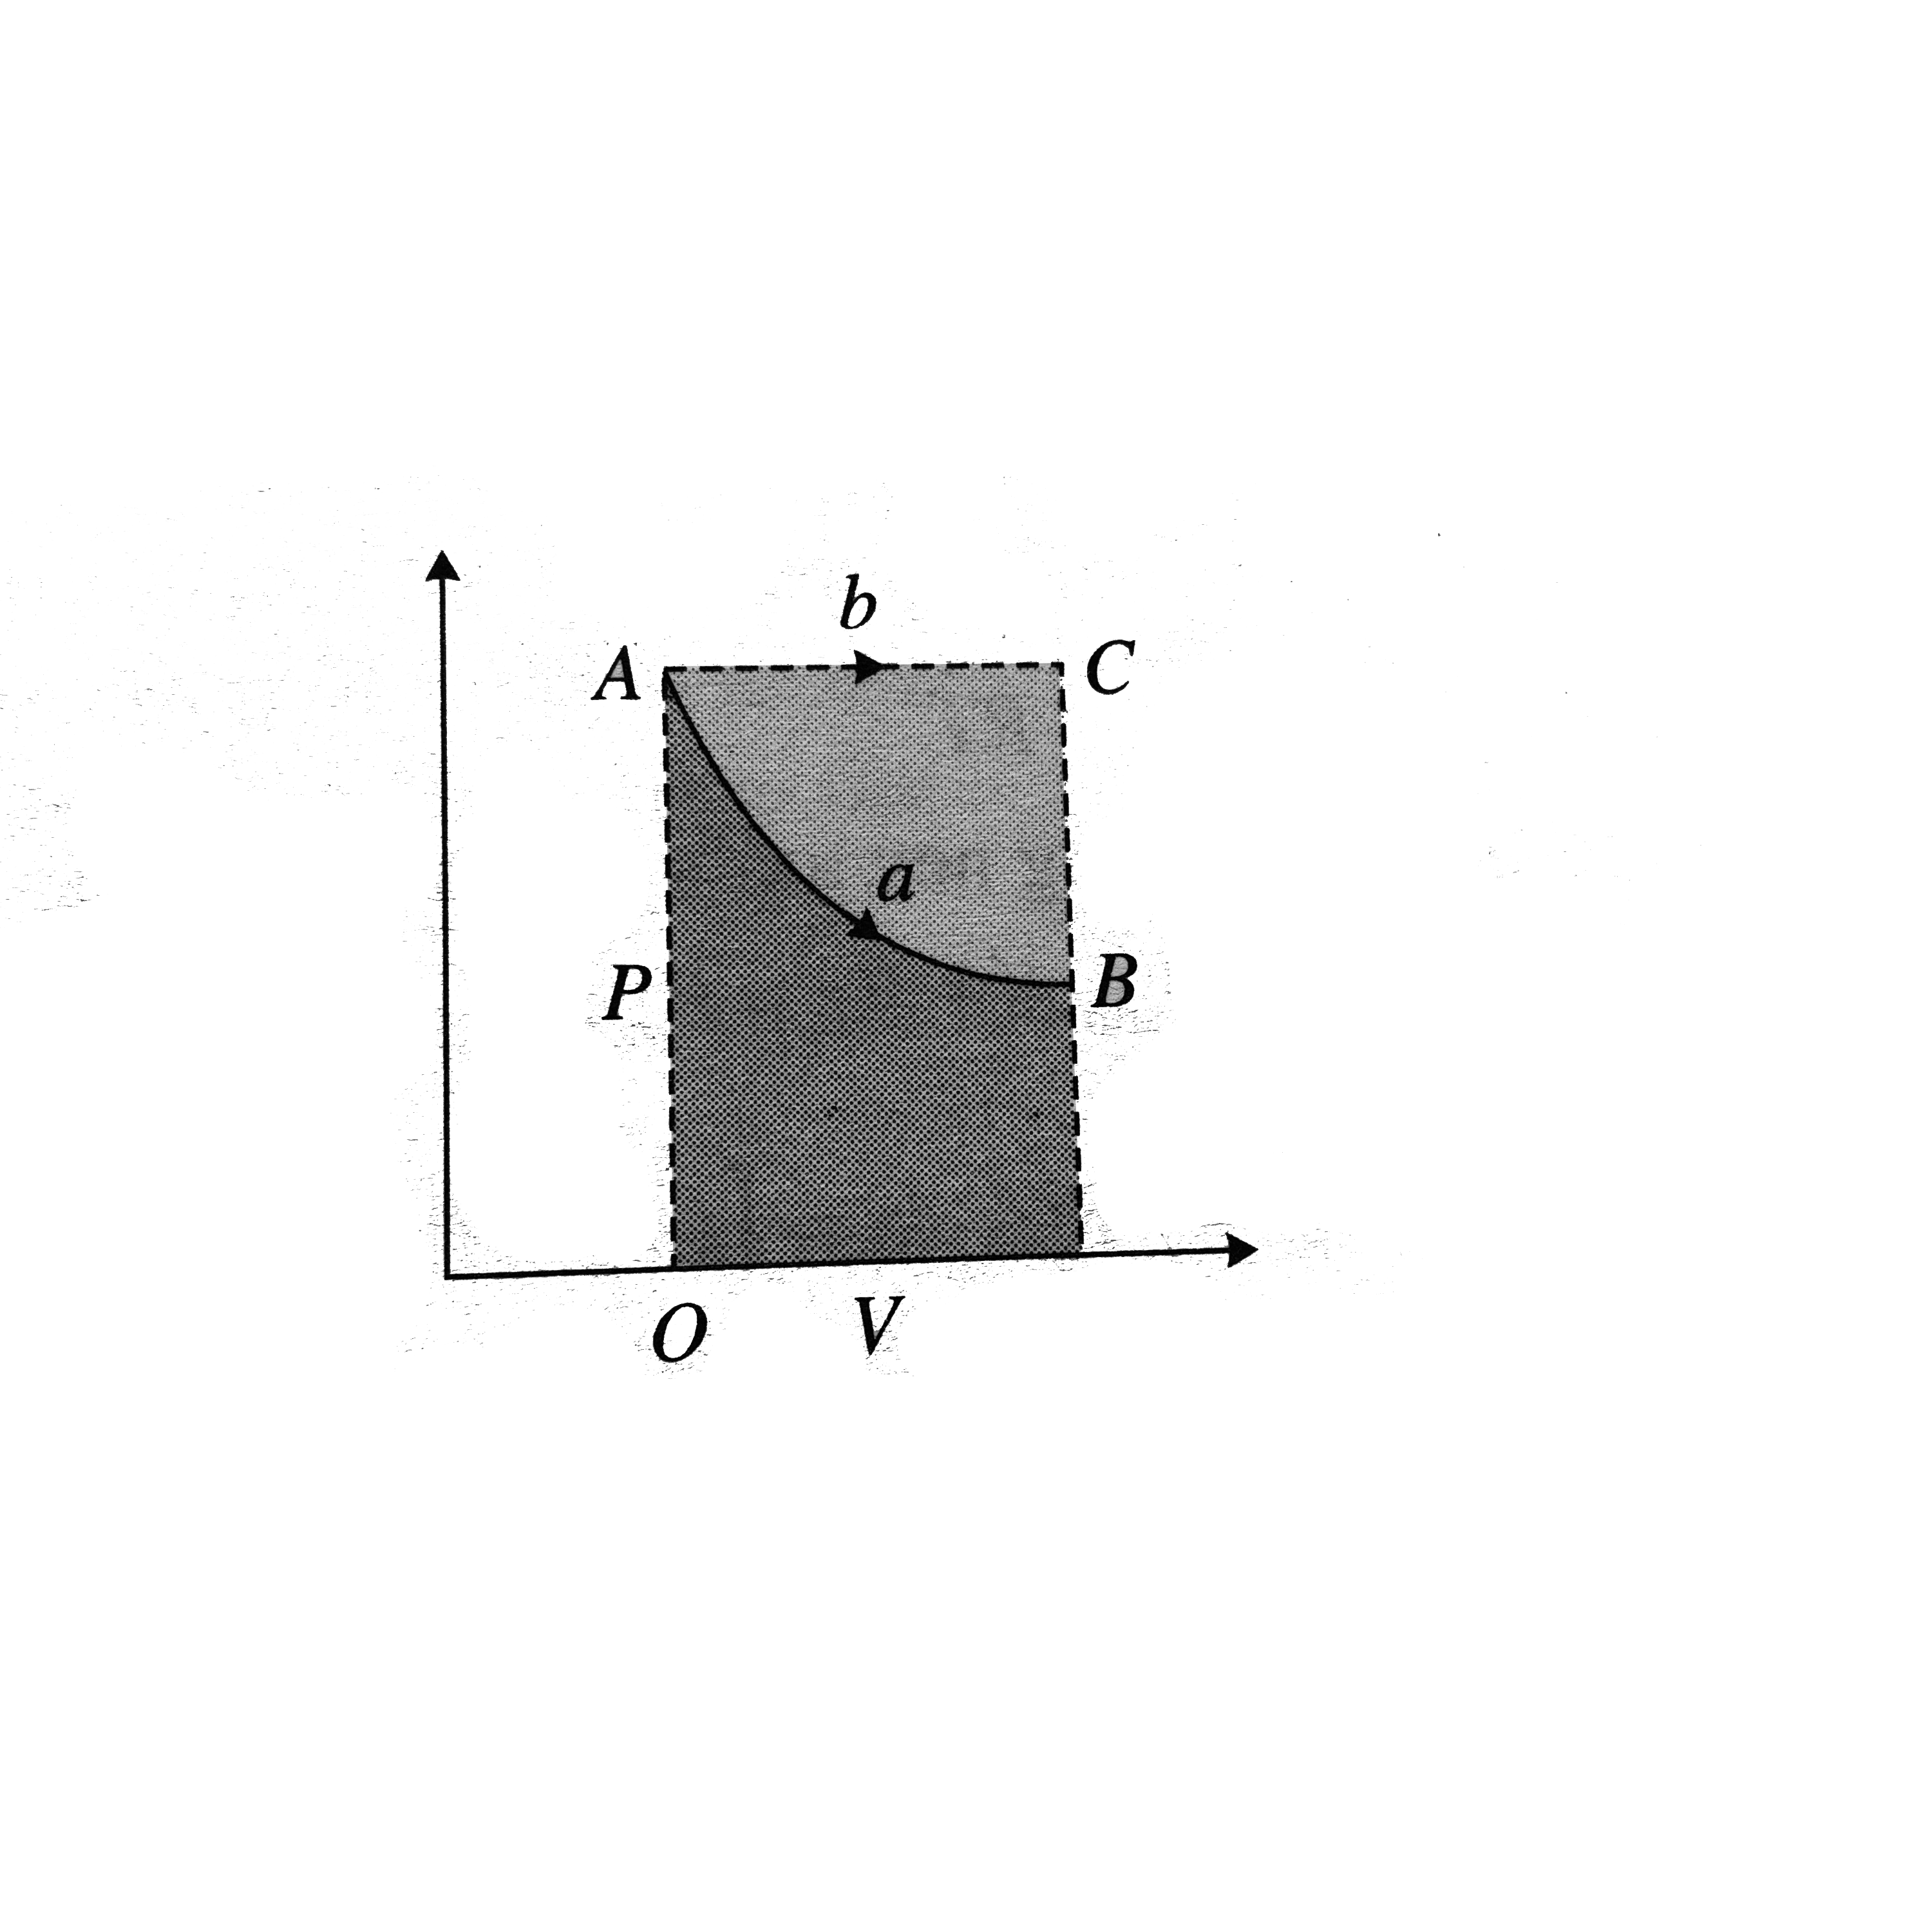
The initial state of certain gas is (Pi,Vi,Ti). It undergoes expansion till its volume become Vf. Consider the following two cases :
(a) the expansion takes place at constant temperature.
(b) the expension takes place at constant pressure.
Plot the P−V diagram for each case. In which of the two cases, is the work done by the gas more?
View SolutionThe initial state of a certain gas is (pi,Vi,Ti). It undergoes explansion till its volume becomes Vf. Consider the following two cases
(a) the expansion takes place at constant temperature.
(b) the expansion takes place at constant pressure.
Plot the p−V diagram for each case. In which of the two cases, is the work done by the gas more ?
View Solution
Knowledge Check
One mole of an ideal gas goes from an initial state A to final state B via two processes : It first undergoes isothermal expansion from volume V to 3V then its volume is reduced from 3V to V at constant pressure. The correct P-V diagram representing the two processes is
A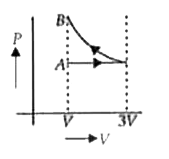 B
B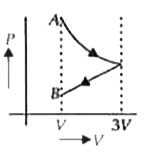 C
C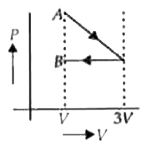 D
D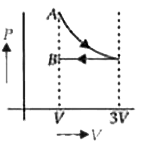
One mole of an ideal gas goes from an initial state A to final state B via two processs : It first undergoes isothermal expansion from volume V to 3V and then its volume is reduced from 3V to V at constant pressure. The correct P−V diagram representing the two process in (figure)
A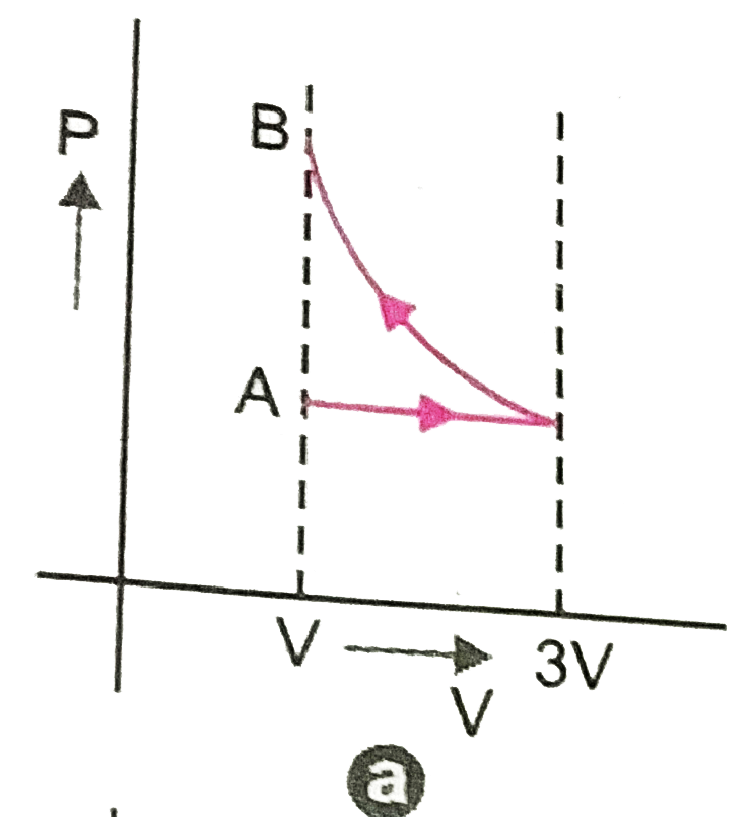 B
B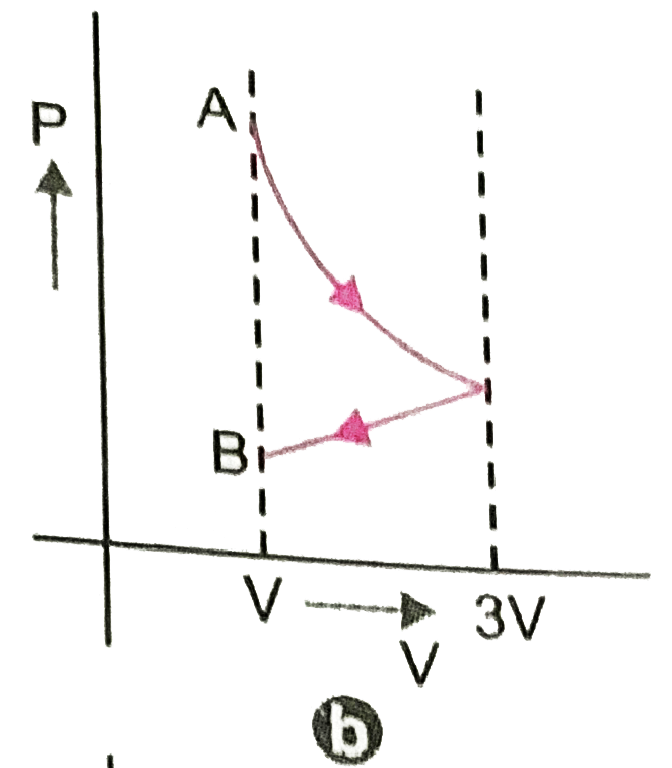 C
C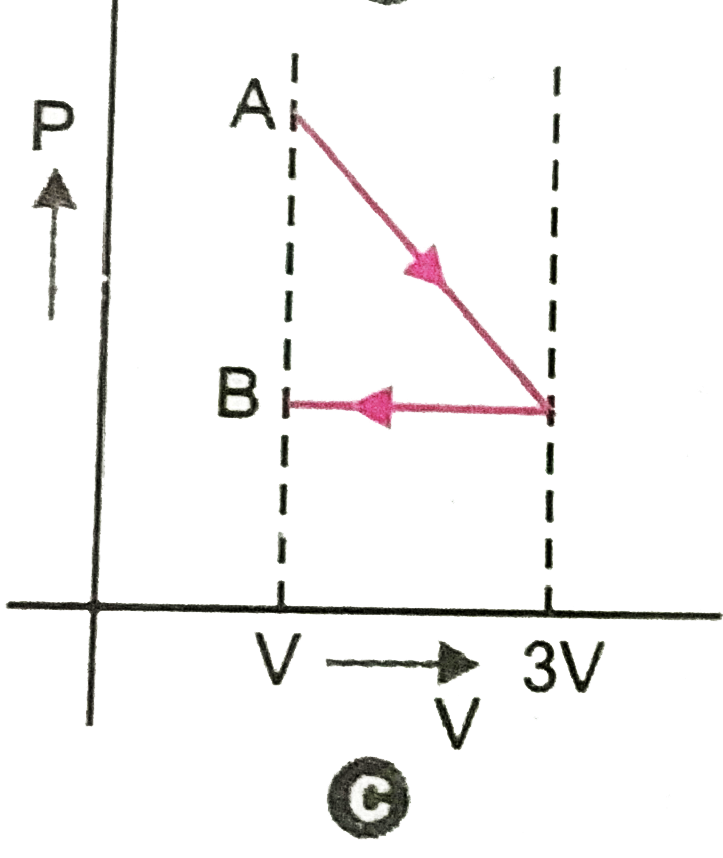 D
D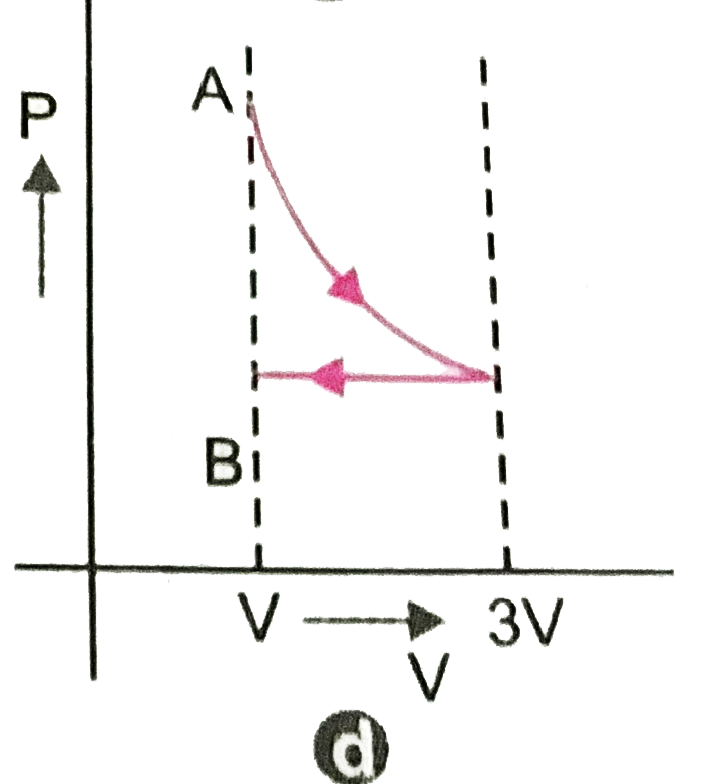
One mole of an ideal gas goes from an initial state A to final state B via two processs : It first undergoes isothermal expansion from volume V to 3V and then its volume is reduced from 3V to V at constant pressure. The correct P−V diagram representing the two process in (figure)
A B
B C
C D
D
Two gases have the same initial pressure P, volume V and temperature T. They both expand to the same volume from V to 2V, one adiabatically and the other isothermally. Plot P-V diagram for the given situation and hence explain. In which case is the final temperature greater?
View SolutionA quantity of gas occupies an initial volume V0 at pressure p0 and temperature T0. It expands to a volume V (a) constant temperature and (b) constant pressure. In which case does the gas do more work ?
View SolutionFor an ideal gas with initial pressure and volume Pi and Vi, respectively, a reversible isothermal expansion happers, when its volume becomes V0. Then it is compressed to its original volume Viby a reversible adiabatic process. If the final pressure is Pf, then which of the following statement is true?
View SolutionFor 1 mol ofan ideal gas at a constant temperature T, the plot of (log P) against (log V) is a (P: Pressure, V: Volume)
View SolutionA gas at initial temperature T undergoes sudden expansion from volume V to 2V. Then -
View Solution
