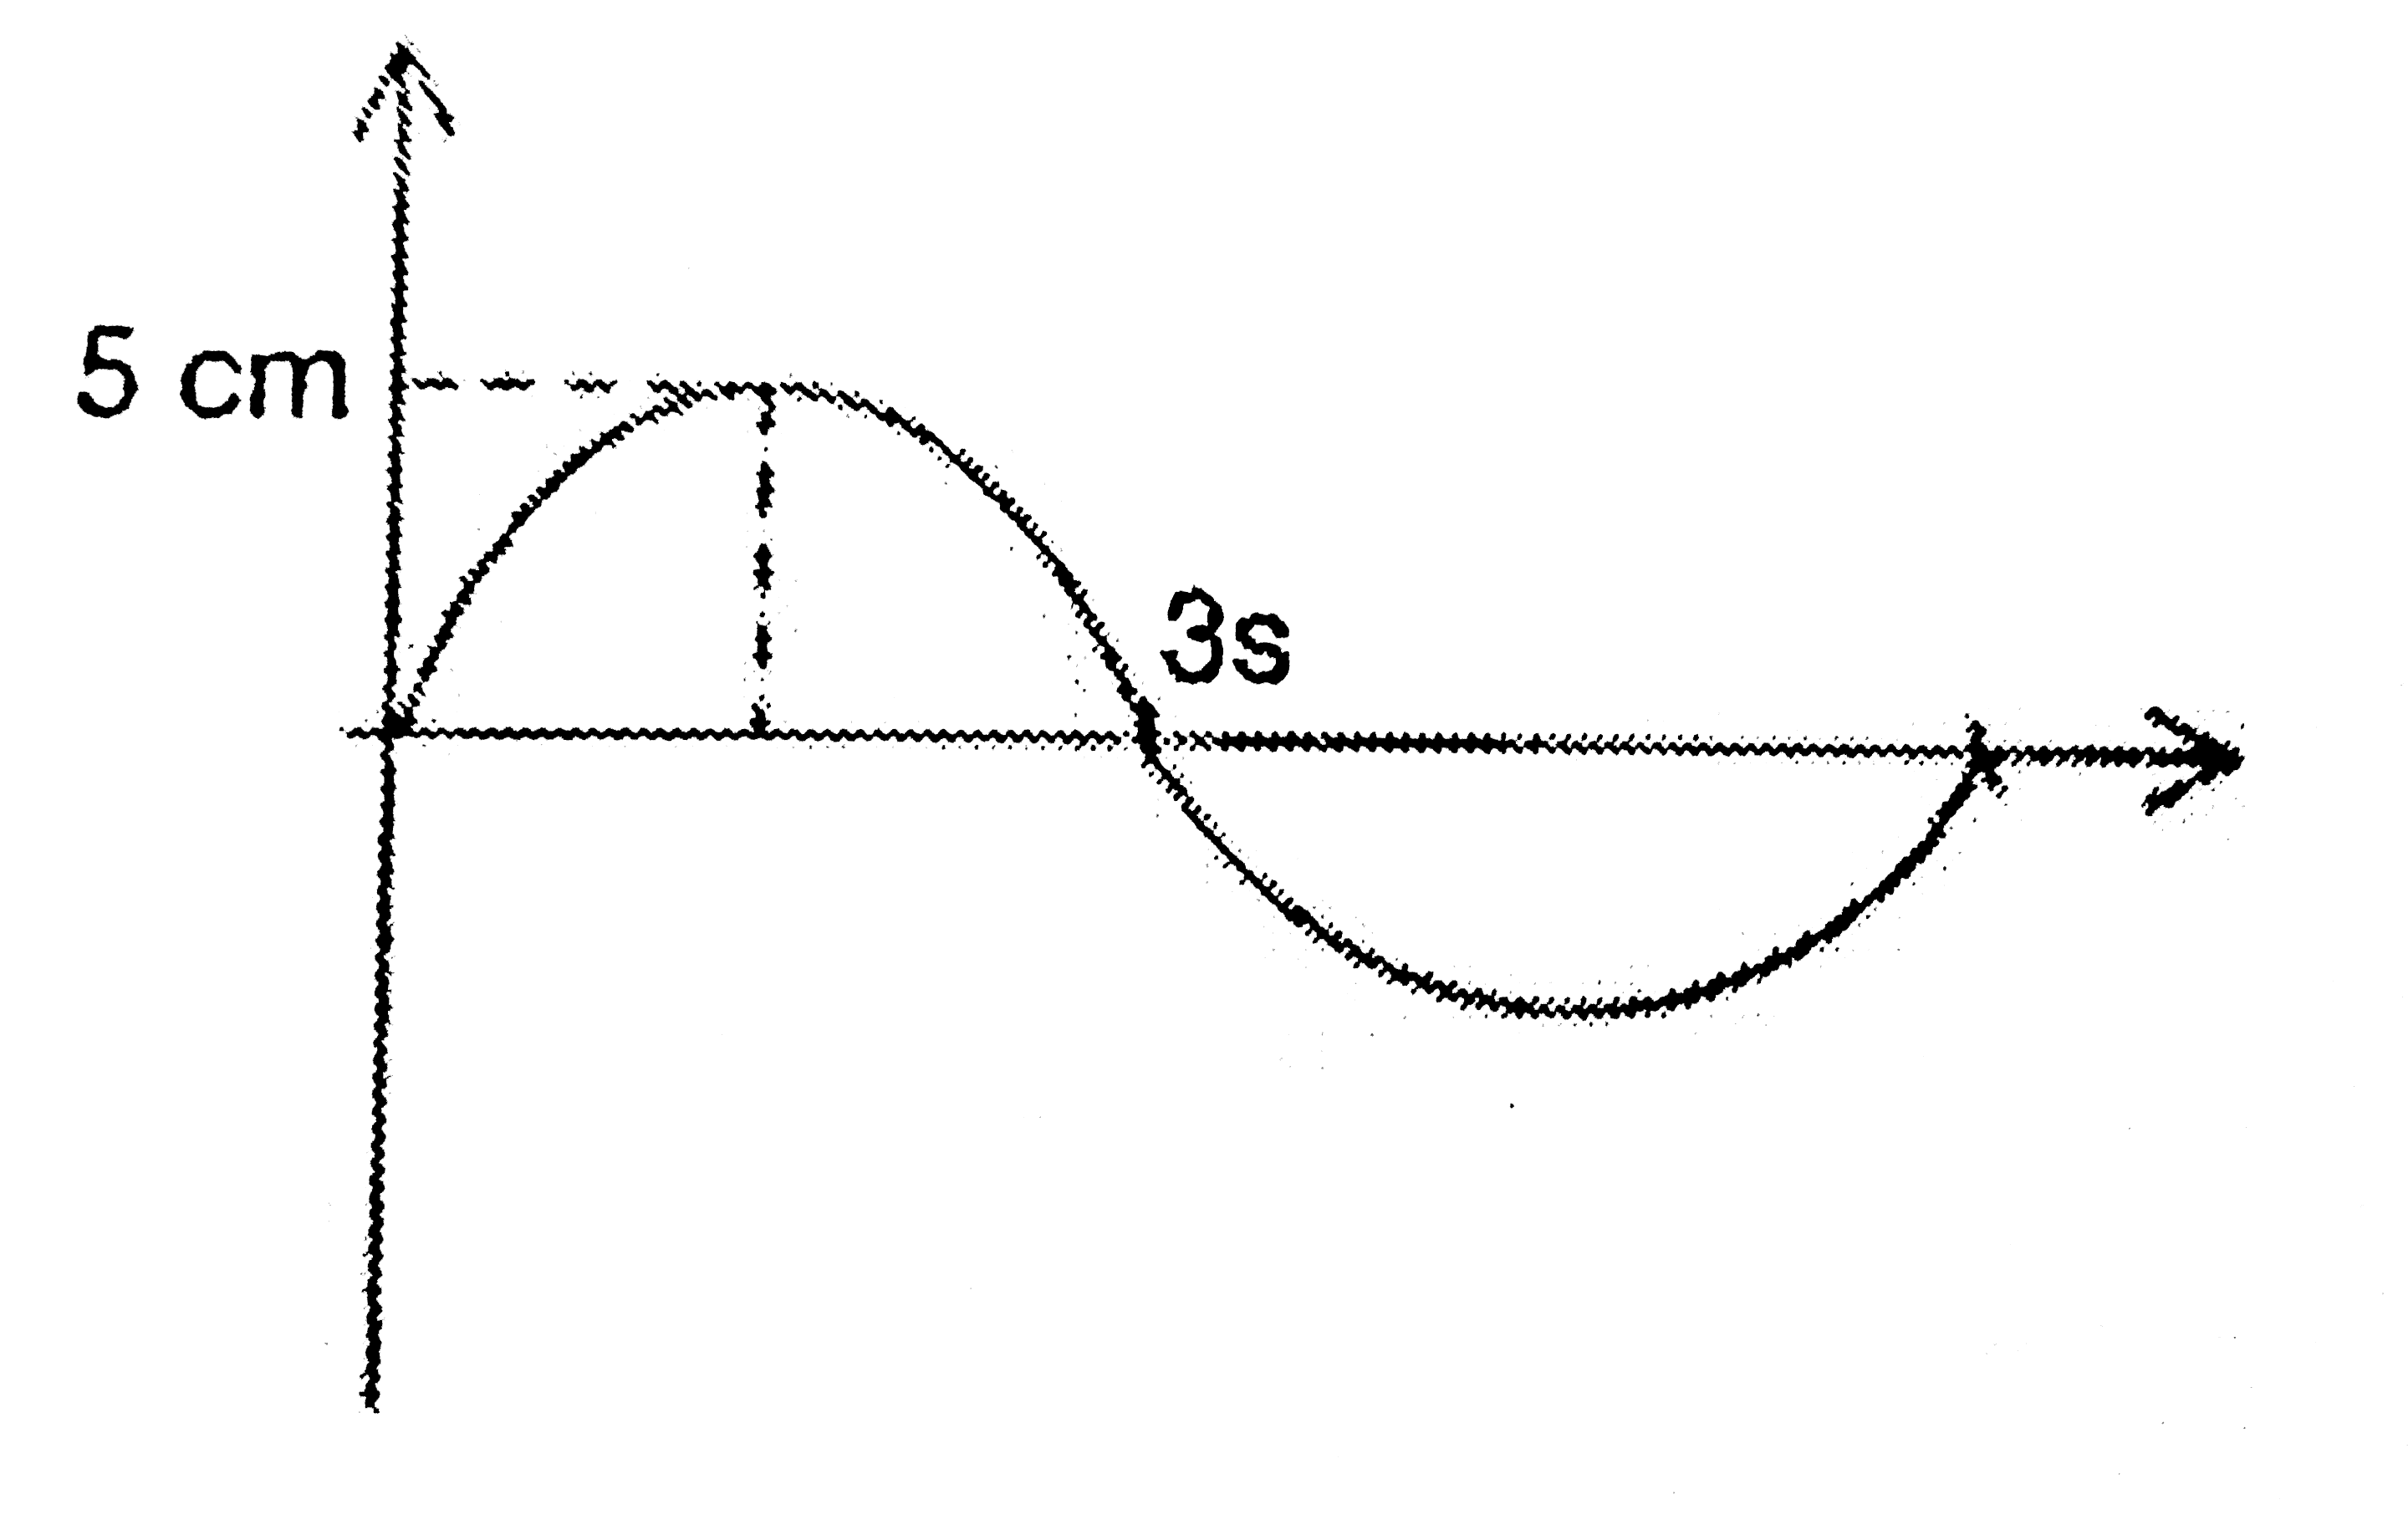
The oscillation of a simple pendulum is graphically represented as follows. Determine the
(a) time period (b) frequency (c) amplitude

Video Solution
Text Solution
Frequency 1T=16Hz
|
Topper's Solved these Questions
- WAVE MOTION AND SOUNDBOOK - PEARSON IIT JEE FOUNDATIONCHAPTER - WAVE MOTION AND SOUNDEXERCISE - CONCEPT APPLICATION (LEVEL-3)
17 Videos
- WAVE MOTION AND SOUNDBOOK - PEARSON IIT JEE FOUNDATIONCHAPTER - WAVE MOTION AND SOUNDEXERCISE - CONCEPT APPLICATION (LEVEL-1)
45 Videos
- STARS AND THE SOLAR SYSTEMBOOK - PEARSON IIT JEE FOUNDATIONCHAPTER - STARS AND THE SOLAR SYSTEMEXERCISE - COMPETITION CORNER
37 Videos
Similar Questions
Knowledge Check
Time period of simple pendulum is
AT=2π√lgBT=2π√glCT=√2πlgDT=12π√glThe time period of a simple pendulum in a satellite is
ASame on the earth,BZeroCInfiniteDNone of these.Time period of simple pendulum increase with
Aincrease in value of gBincrease in amplitudeCdecrease in value of gDdecrease in amplitude
The oscillation of a simple pendulum is graphically represented as follows. Determine the
(a) time period (b) frequency (c) amplitude

View SolutionThe time period of a simple pendulum is independent of _______ of oscillation.
View SolutionWhat is the time period of a simple pendulum ?
View SolutionThe time period of a simple pendulum is independent of _______ of oscillation.
View SolutionThe motion of a simple pendulum when it oscillates with small amplitude is
View Solution
