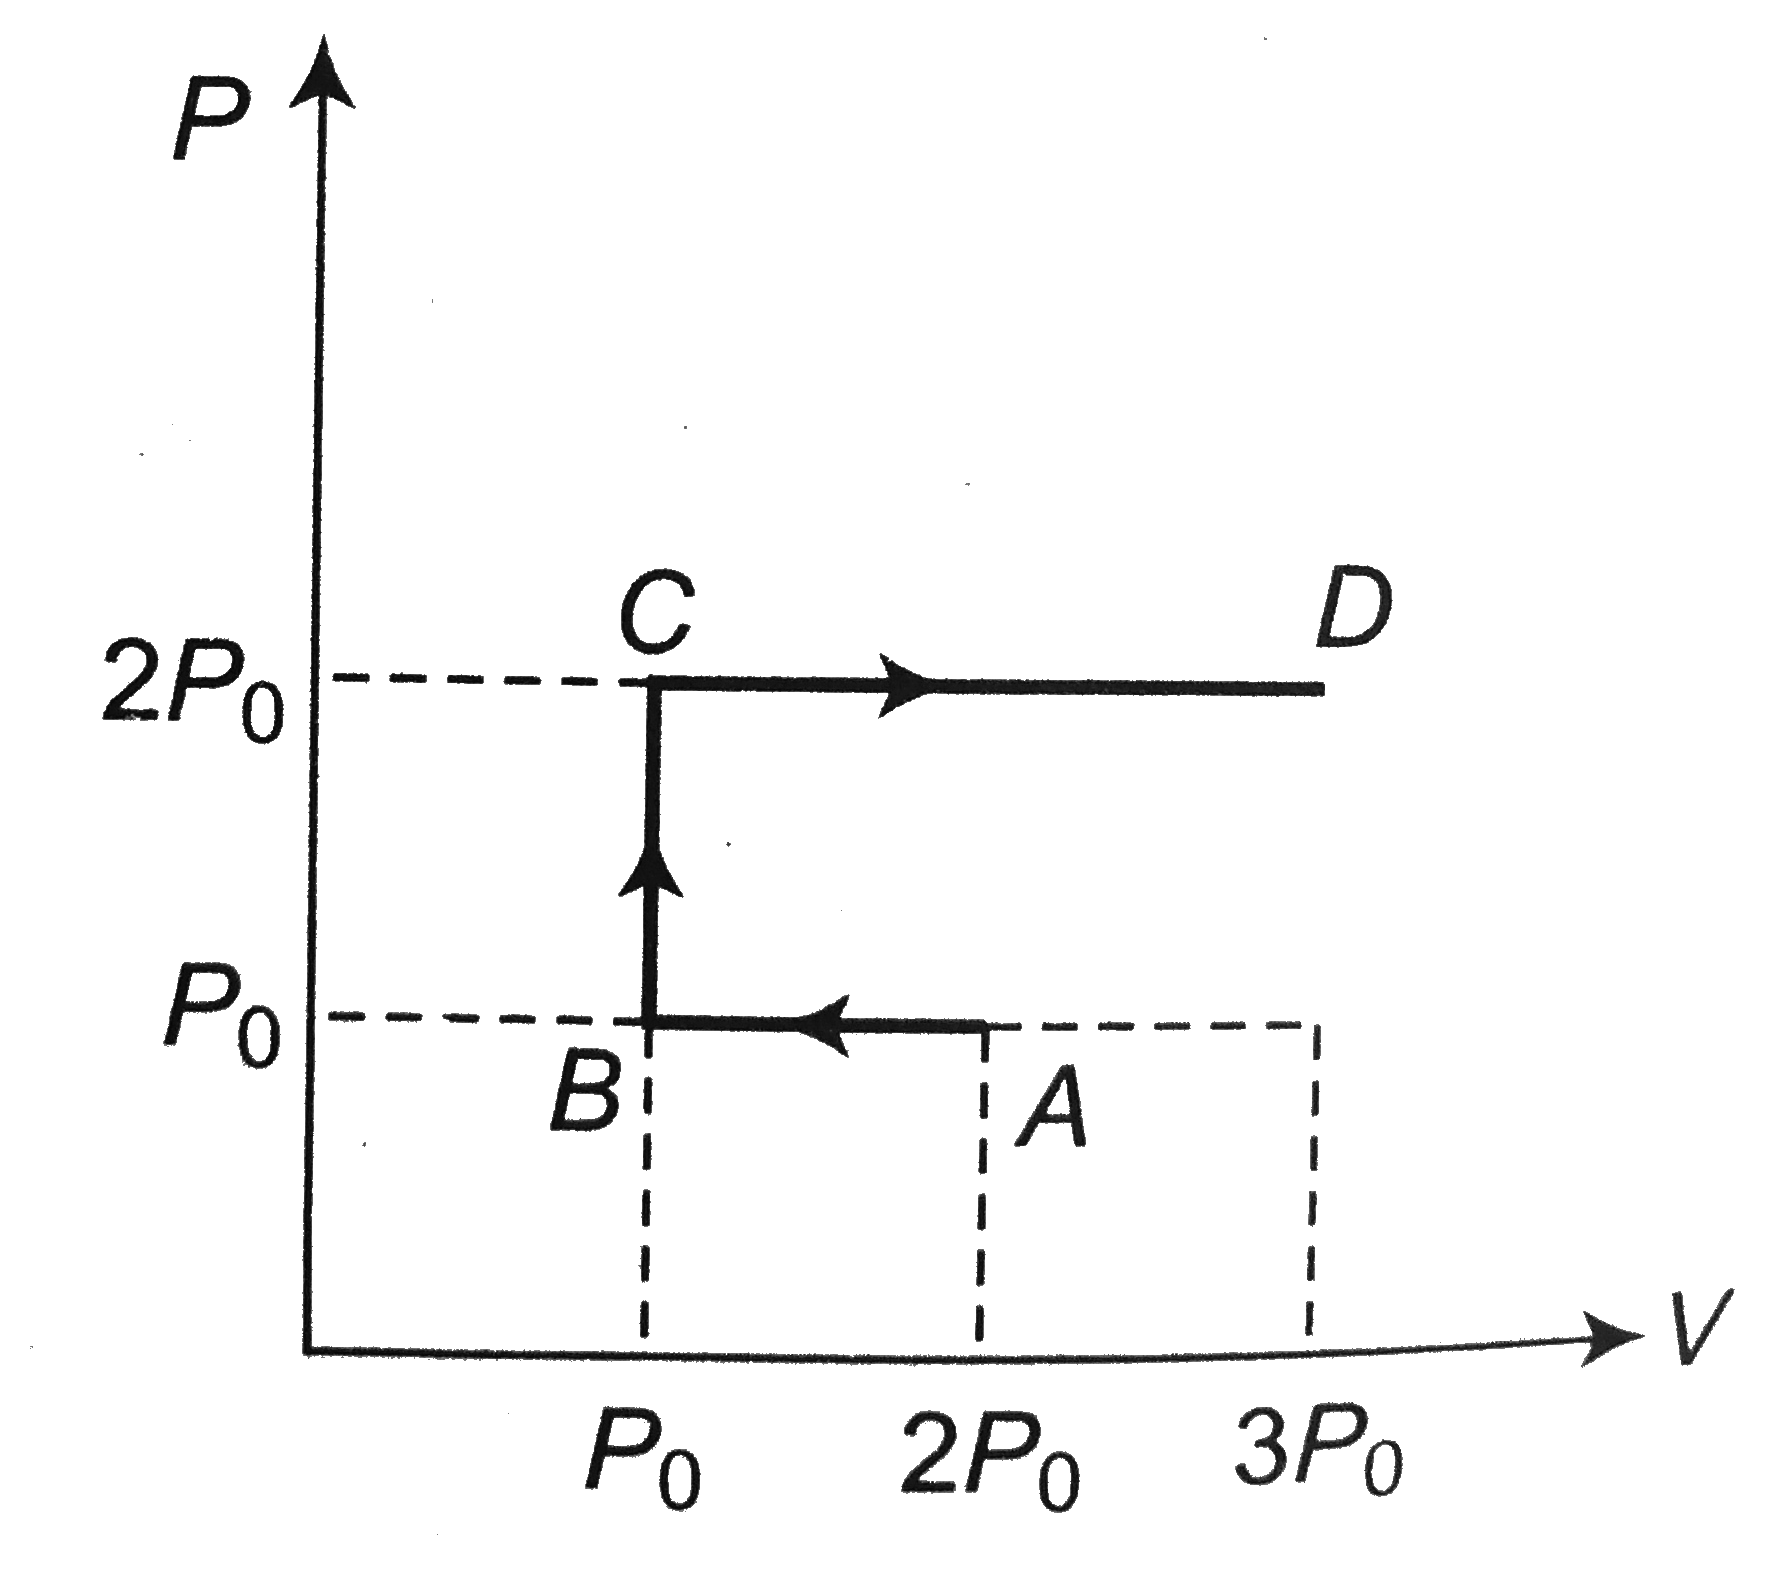
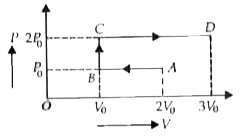
The P-V diagram for an ideal gas is shown in figure.
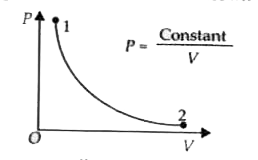
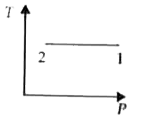
Out of the following diagrams which one represents the T-P diagram ?
A
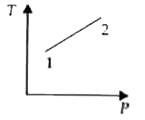
B
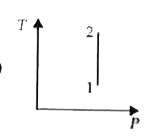
C
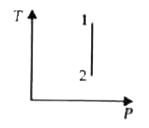
D
Text Solution
The correct Answer is:D
|
Topper's Solved these Questions
- THERMODYNAMICSBOOK - MTG GUIDECHAPTER - THERMODYNAMICSEXERCISE - AIPMT/NEET (MCQs)
26 Videos
- THERMODYNAMICSBOOK - MTG GUIDECHAPTER - THERMODYNAMICSEXERCISE - NEET Cafe (Topicwise practice Questions)
80 Videos
- PROPERTIES OF BULK MATTERBOOK - MTG GUIDECHAPTER - PROPERTIES OF BULK MATTEREXERCISE - AIPMT/NEET (MCQs)
40 Videos
- WORK, ENERGY AND POWERBOOK - MTG GUIDECHAPTER - WORK, ENERGY AND POWEREXERCISE - AIPMT/NEET (MCQs)
34 Videos
Similar Questions
Knowledge Check
Consider p-V diagram for an ideal gas shown in figure.
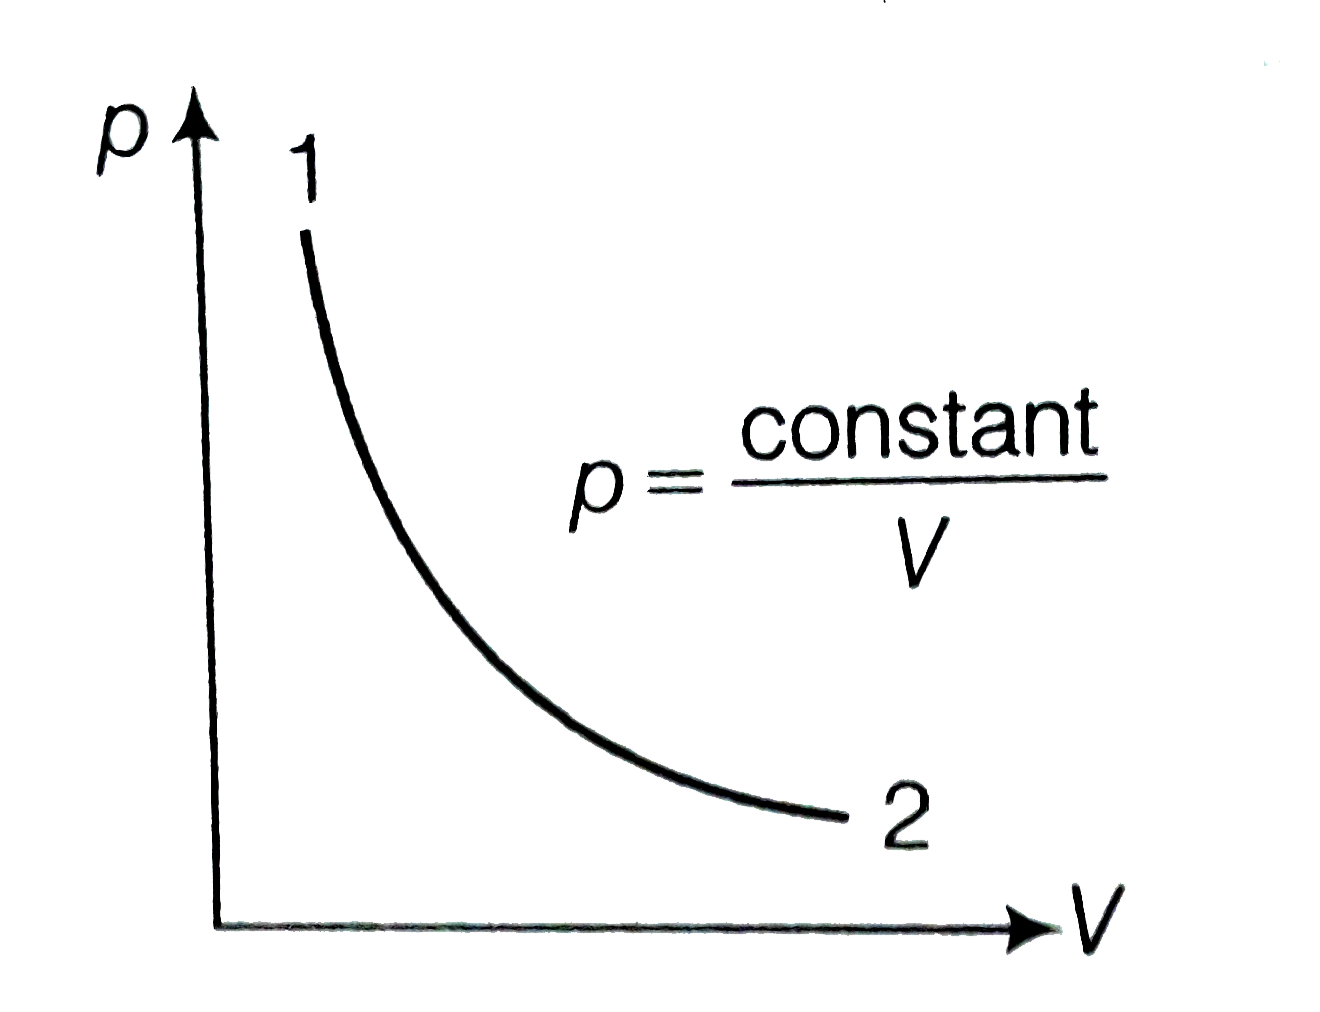
Out of the following diagrams, which figure represents the T−p diagram ?
(i)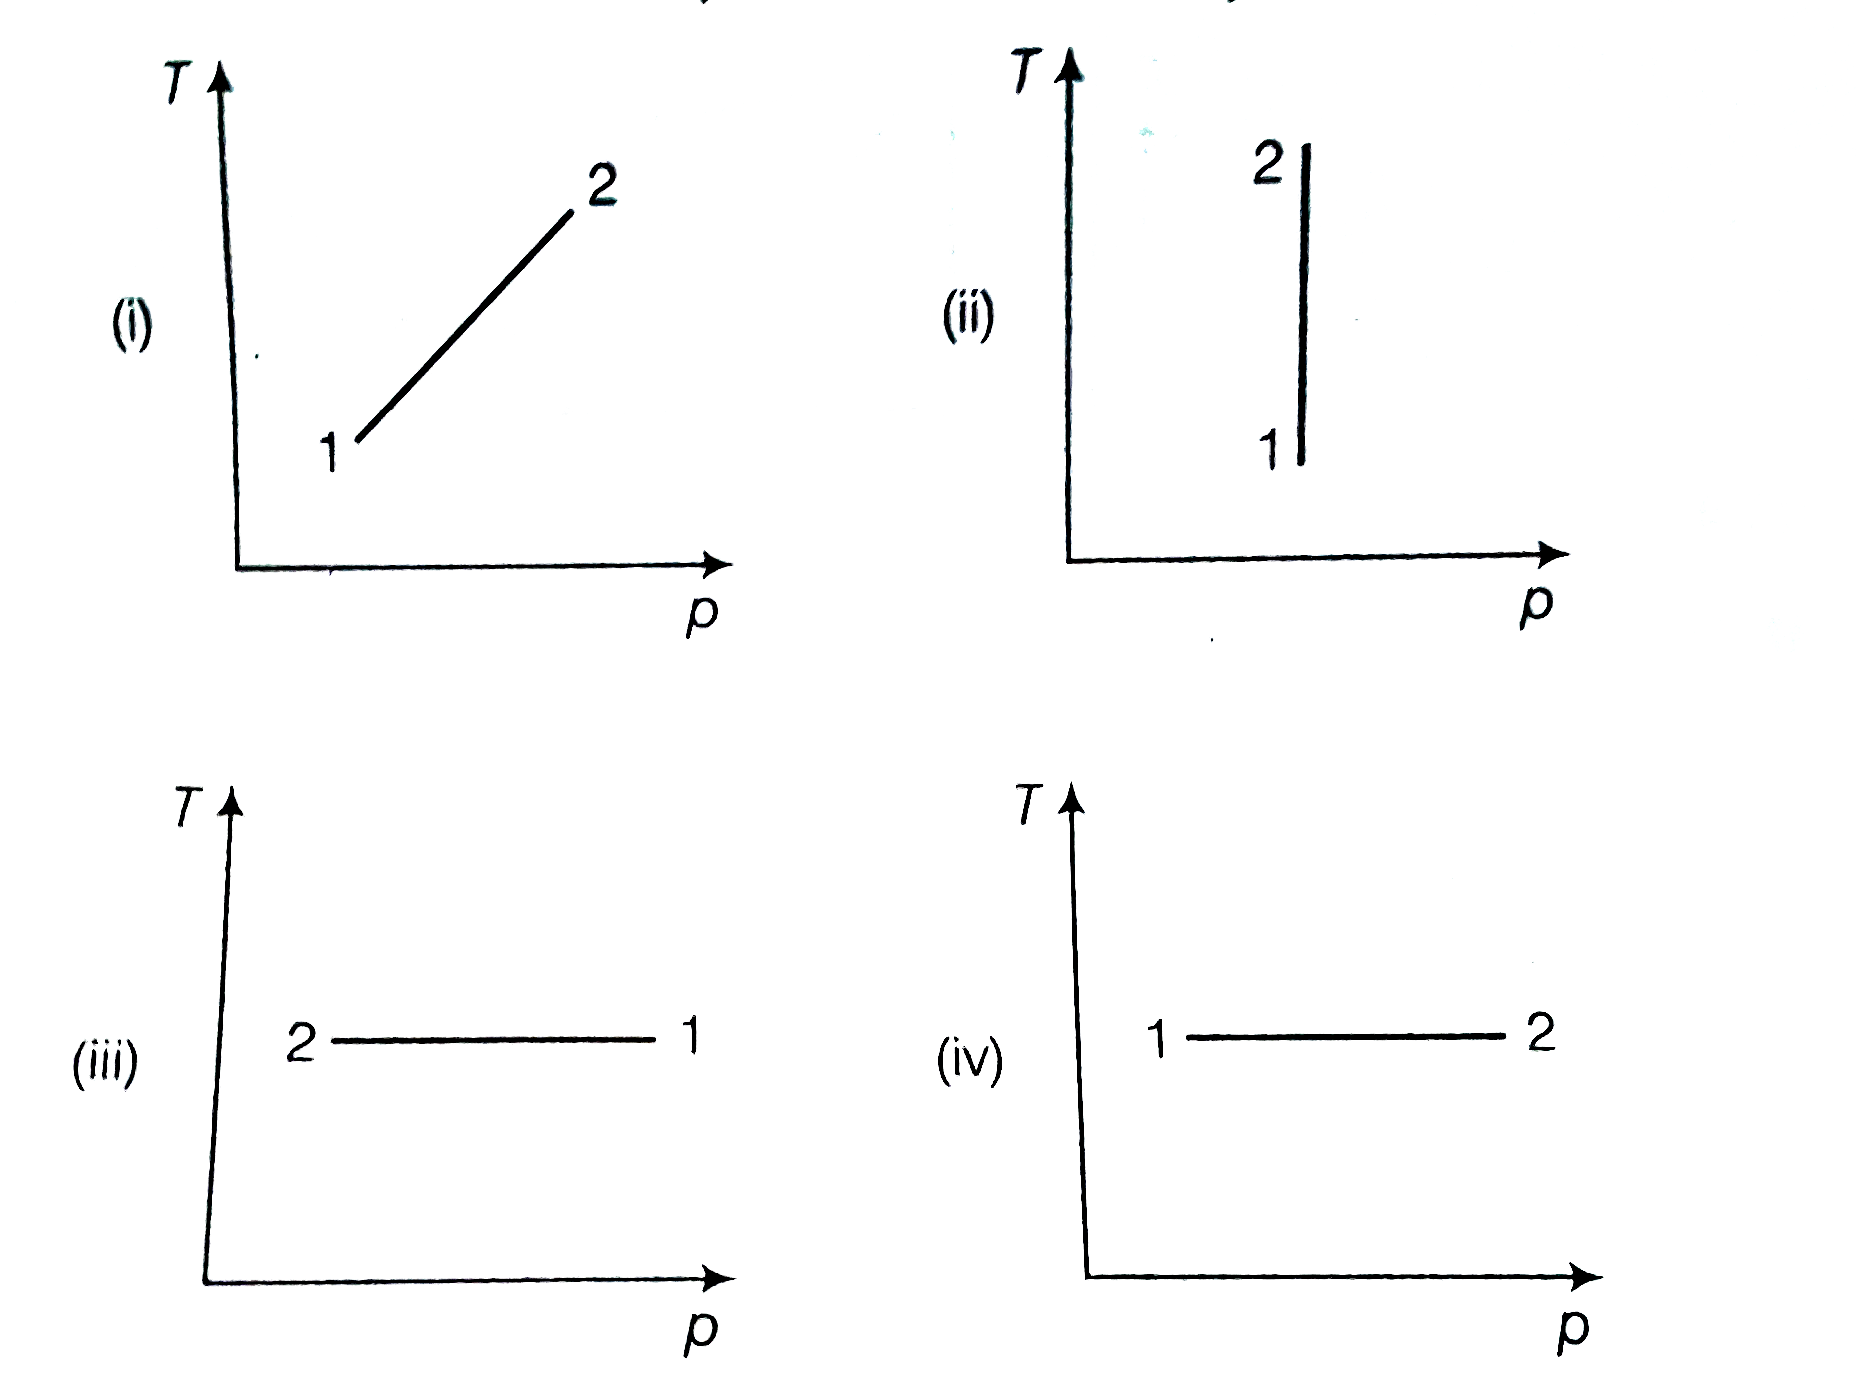 A(iv)B(ii)C(iii)D(i)
Consider p-V diagram for an ideal gas shown in figure.
Out of the following diagrams, which figure represents the T−p diagram ?
(i) A(iv)B(ii)C(iii)D(i)
Consider P−V diagram for an ideal gas shown in figure.
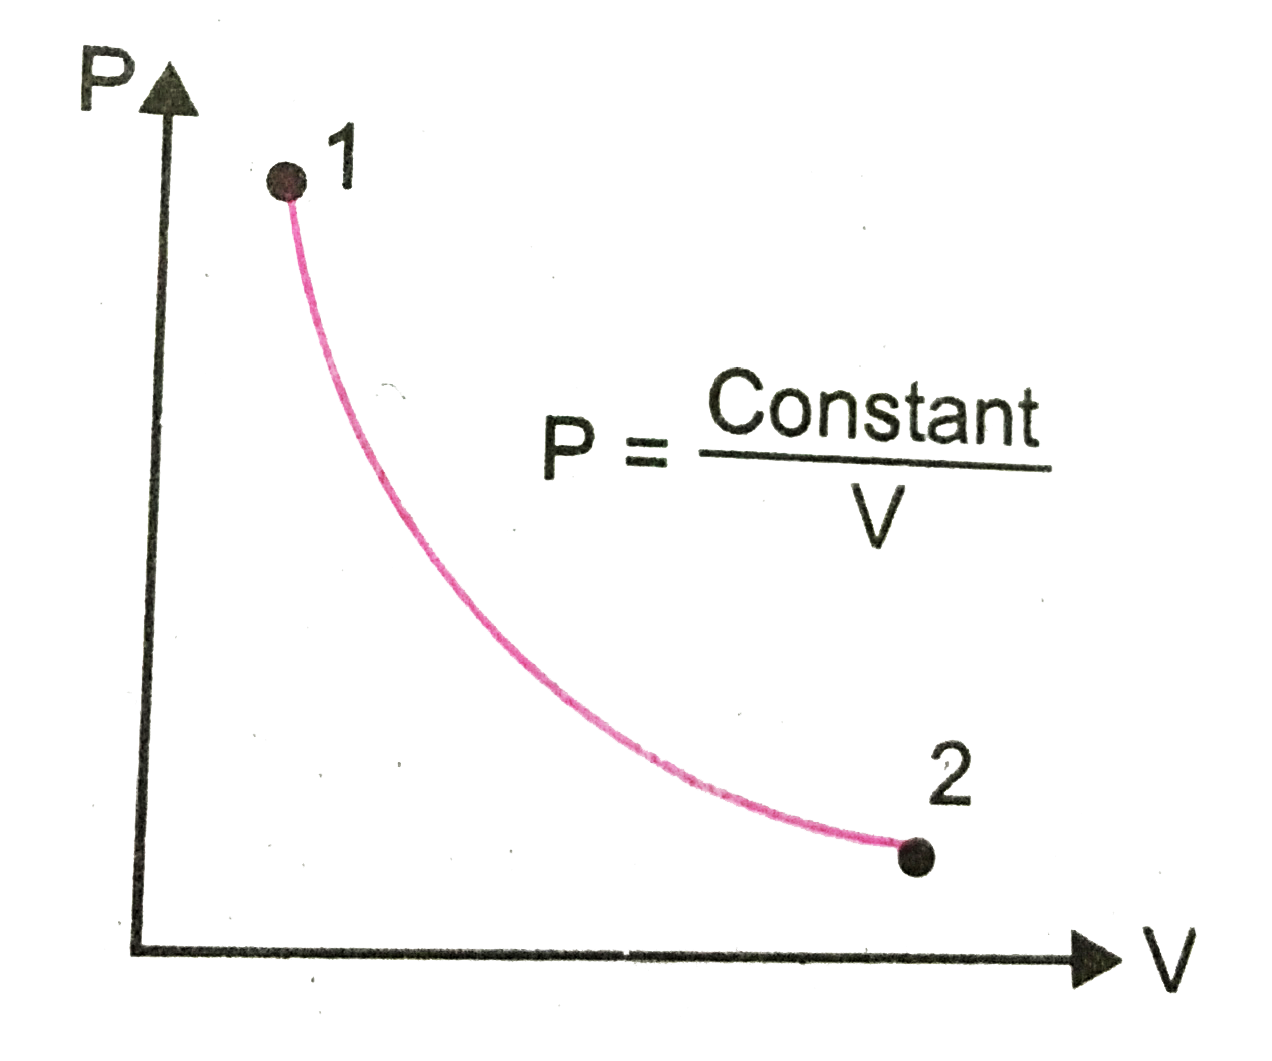
Out of following diagrams(figure). Which represents the T−P diagram?
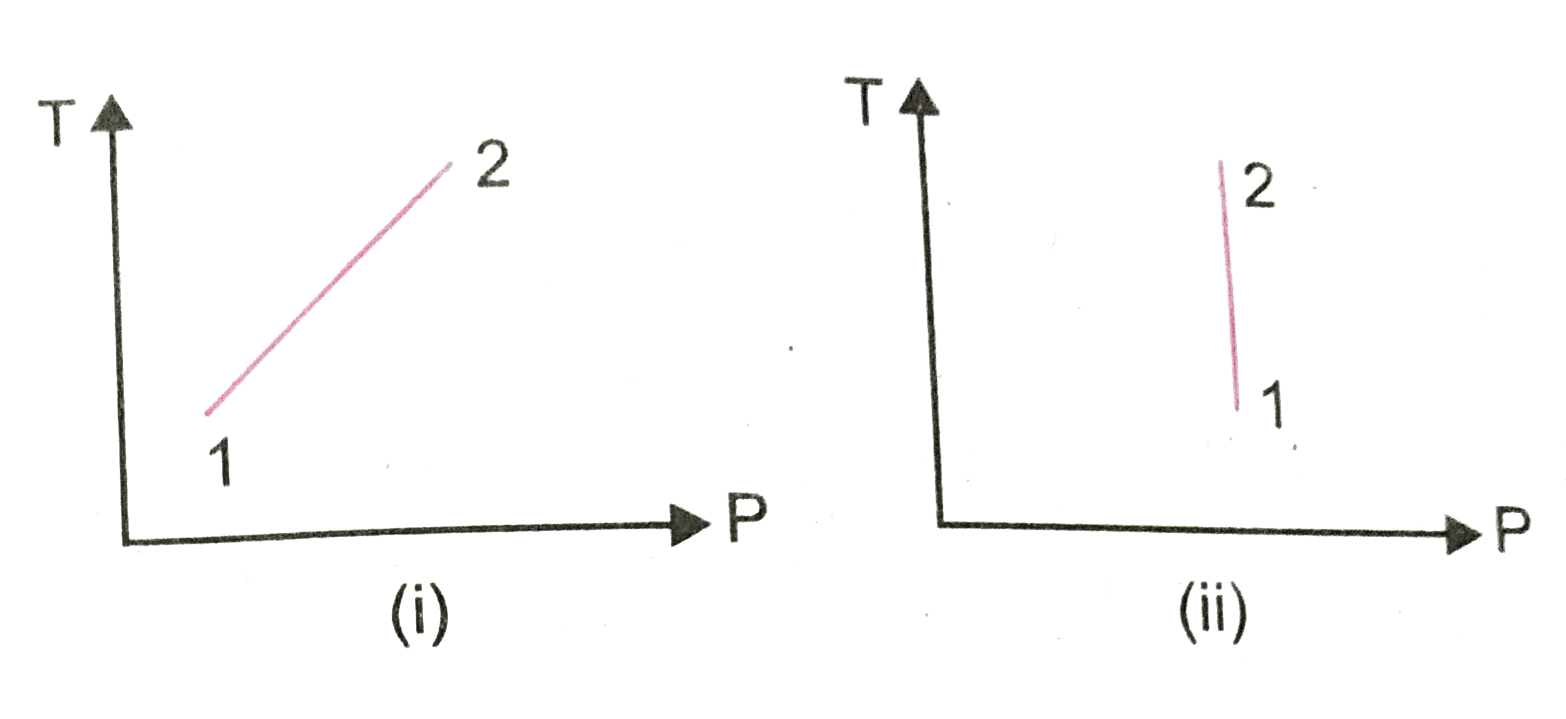
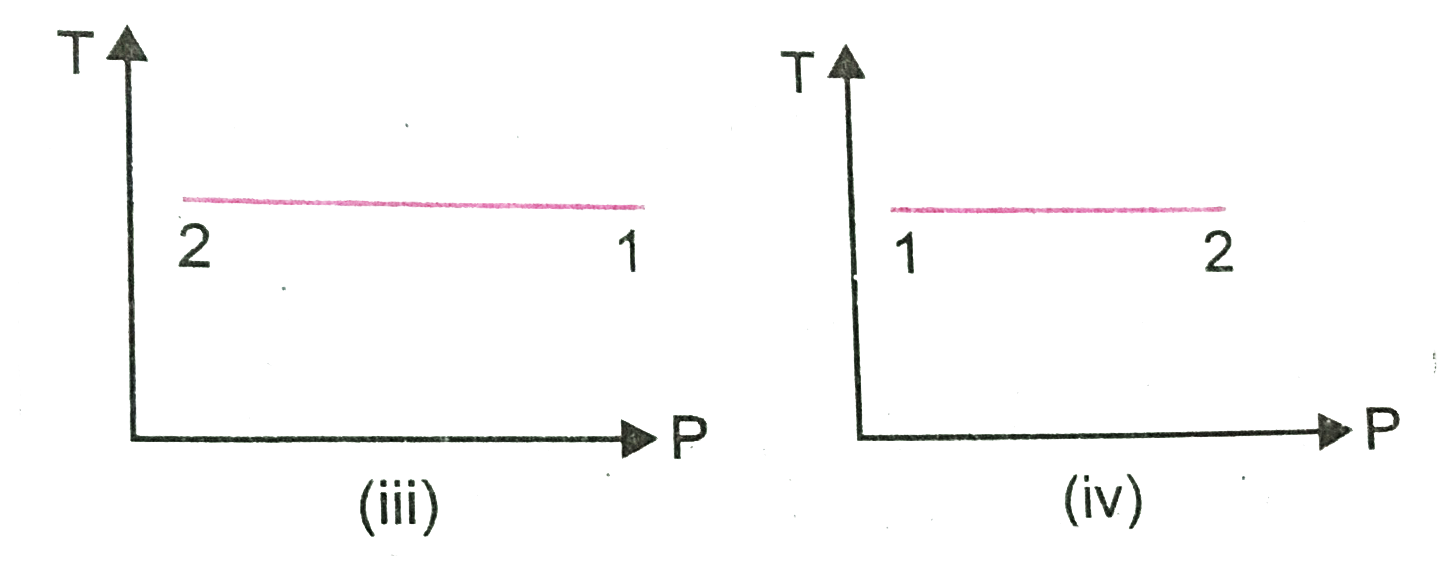 A(iv)B(ii)C(iii)D(iv)
P−V diagram of an ideal gas is as shown in figure. Work done by the gas in process ABCD is
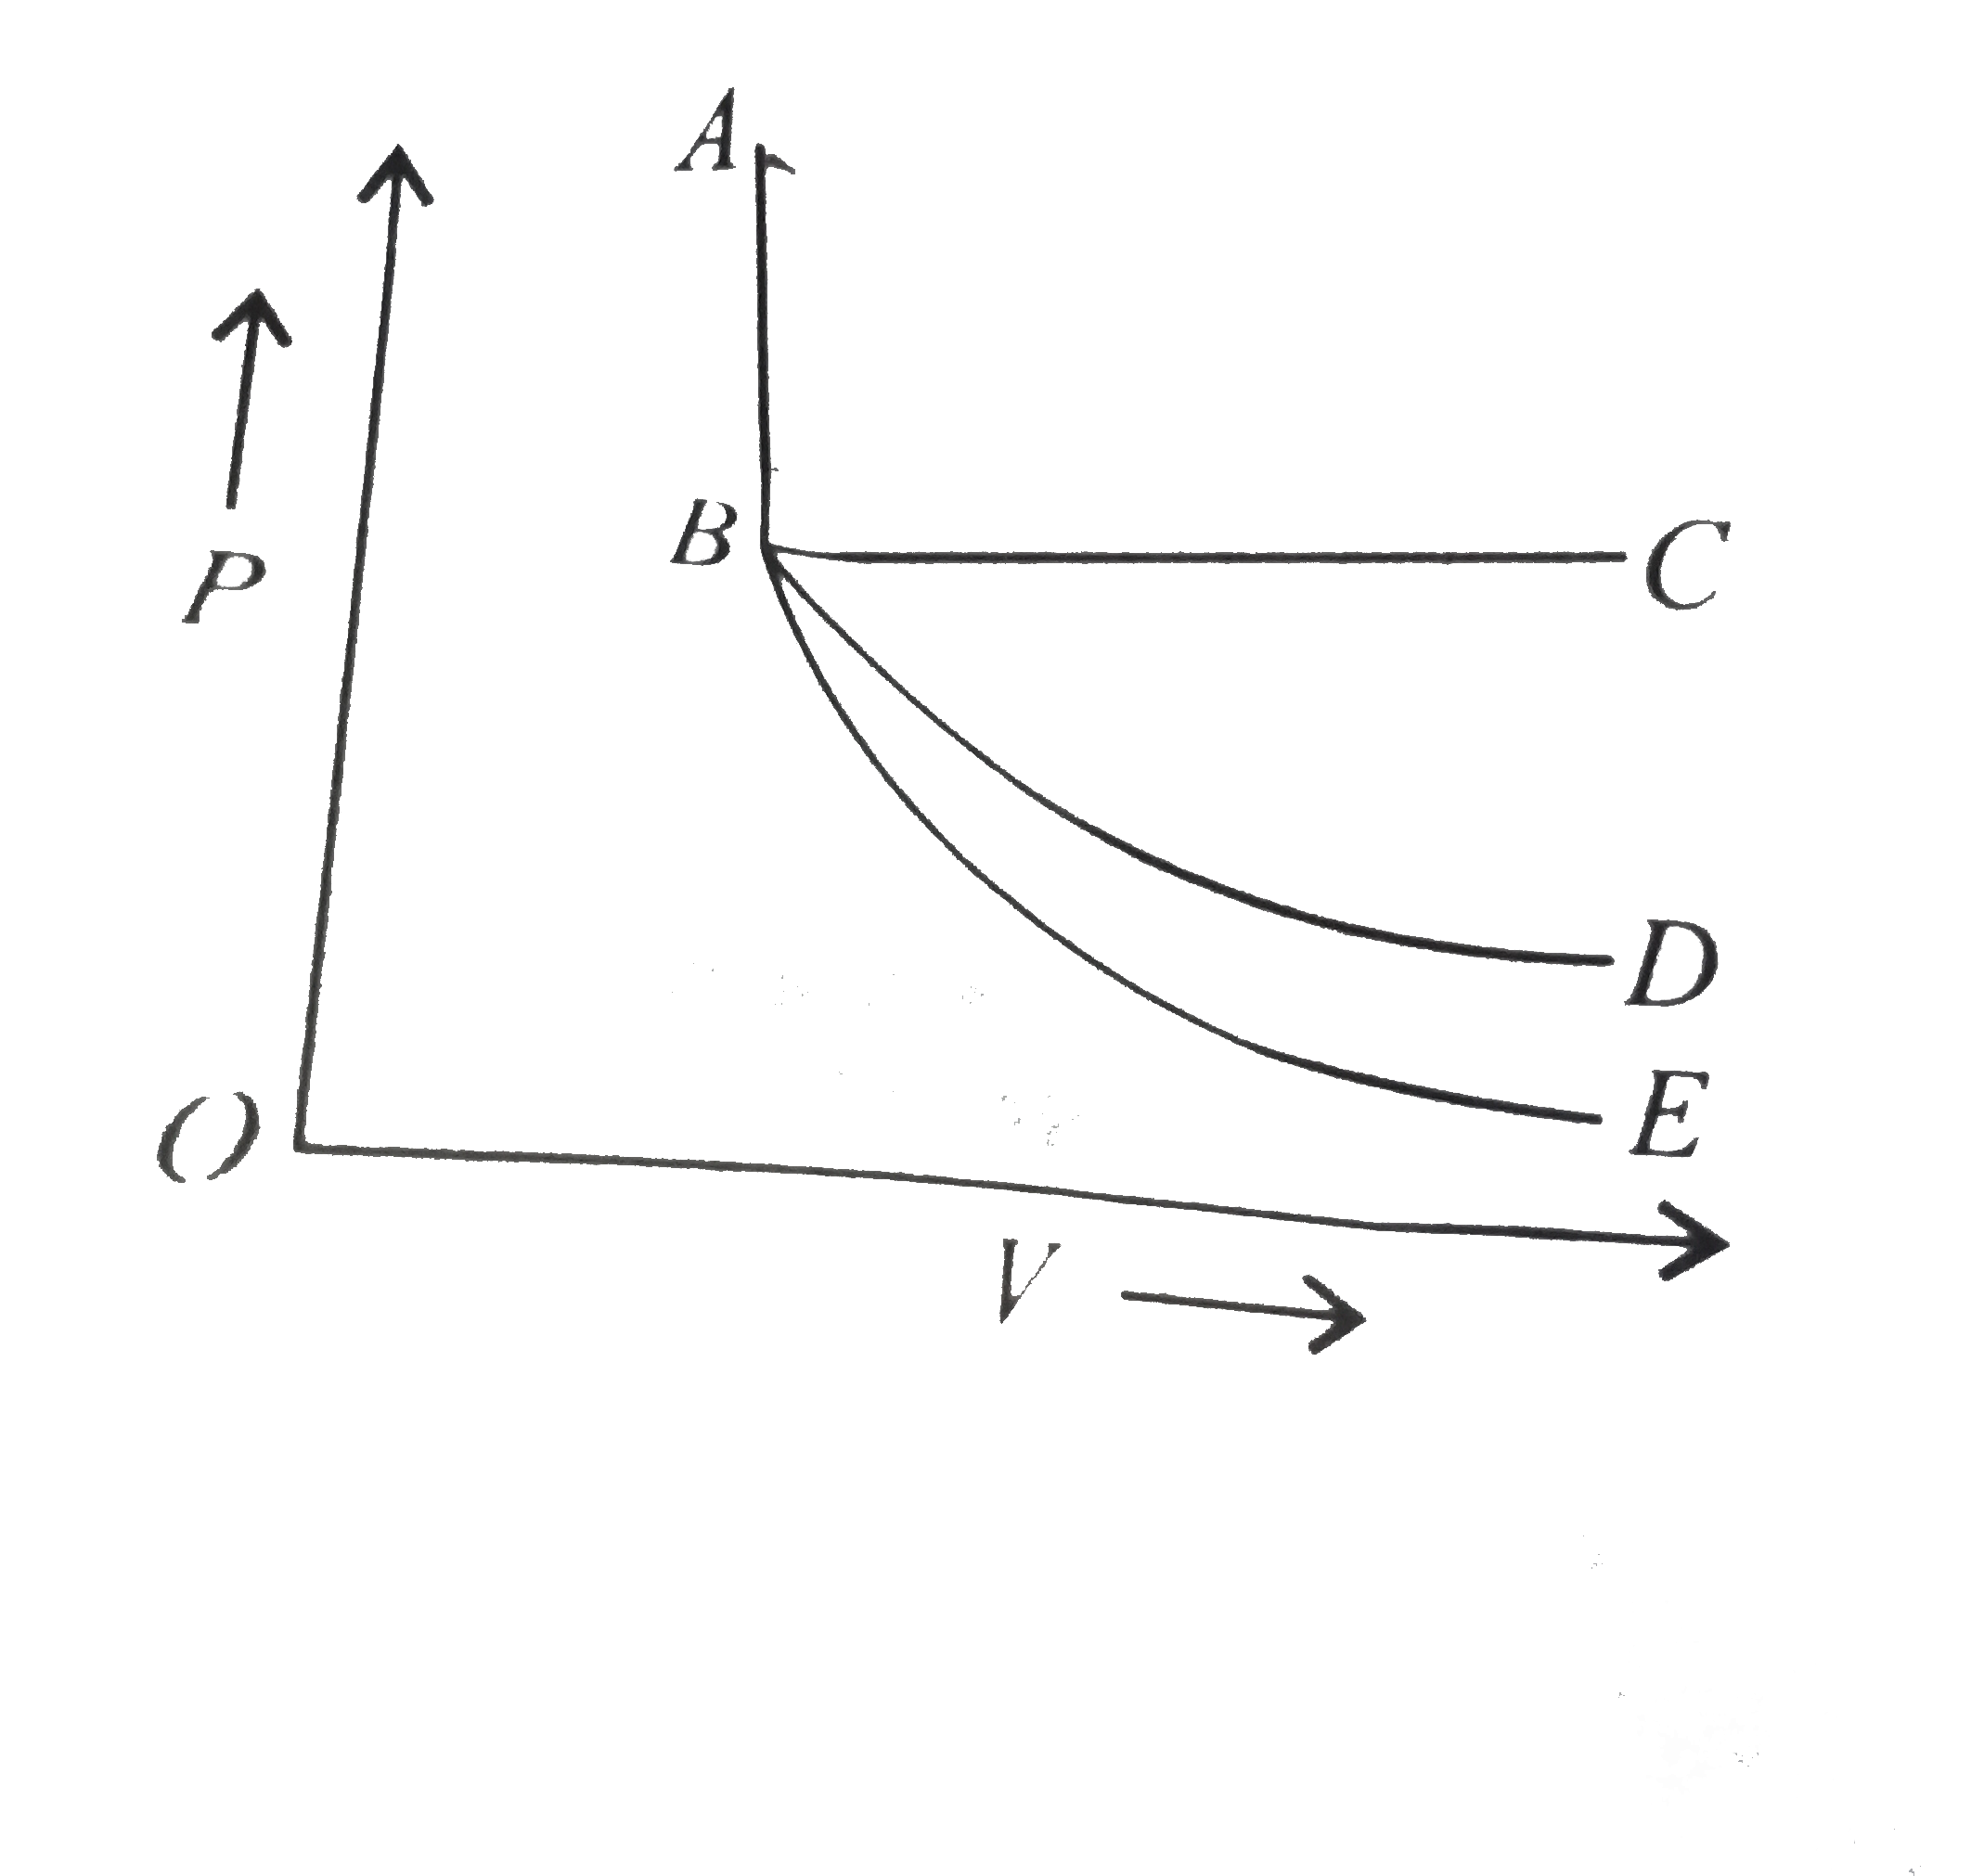
View SolutionIn P−V diagram shown below,
View SolutionP-V diagram of an ideal gas is as shown in figure. Work done by the gas in the process ABCD is
View SolutionP−V diagram of an ideal gas is as shown in figure. Work done by the gas in process ABCD is

View SolutionIn P−V diagram shown below,

View Solution

